Microphase separation in thin films of lamellar forming polydisperse di-block copolymers

Rajeev Kumar*ab, Bradley S. Lokitzb, Scott W. Sidesc, Jihua Chenb, William T. Hellerd, John F. Anknerd, James F. Browningd, S. Michael Kilbey IIe and Bobby G. Sumpterab
aComputer Science and Mathematics Division, Oak Ridge National Lab, Oak Ridge, TN-37831, USA. E-mail: kumarr@ornl.gov
bCenter for Nanophase Materials Sciences, Oak Ridge National Laboratory, Oak Ridge, TN-37831, USA
cNational Renewable Energy Laboratory, Golden, CO-80401, USA
dSpallation Neutron Source, Oak Ridge National Laboratory, Oak Ridge, TN-37831, USA
eDepartment of Chemistry, University of Tennessee, Knoxville, TN-37996, USA

Received 16th January 2015 , Accepted 2nd February 2015

First published on 3rd February 2015


Abstract

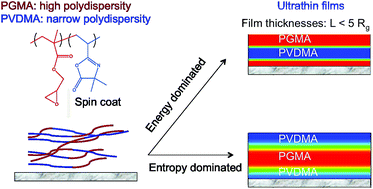
Despite the ubiquity of polydispersity in chain lengths of di-block copolymers, its effects on microphase separation in thin films have eluded a clear understanding. In this work, we have studied effects of polydispersity on the microphase separation in thin films of lamellar forming di-block copolymers using self-consistent field theory (SCFT) and neutron reflectivity experiments. Di-block copolymers containing a polydisperse block of poly(glycidylmethacrylate) (PGMA) connected to a near-monodisperse block poly(2-vinyl-4,4-dimethyl-d6 azlactone) (PVDMA-d6) are considered in this work. Effects of chain length polydispersity, film thickness, substrate–monomer and monomer–monomer interactions on the microphase segregation are studied using SCFT. The theoretical study reveals that in comparison to a film created with monodisperse di-block copolymers, an increase in polydispersity tends to decrease the number of lamellar strata that can be packed in a film of given thickness. This is a direct consequence of an increase in lamellar domain spacing with an increase in polydispersity index. Furthermore, it is shown that polydispersity induces conformational asymmetry and an increase in the polydispersity index leads to an increase in the effective Kuhn segment length of the polydisperse blocks. It is shown that the conformational asymmetry effects, which are entropic in origin and of increasing importance as film thickness decreases, drive the polydisperse blocks to the middle of the films despite favorable substrate interactions. These predictions are verified by results from neutron reflectivity experiments on thin films made from moderately polydisperse PGMA-PVDMA-d6 di-block copolymer deposited on silicon substrates. Finally, results from SCFT are used to predict neutron reflectivity profiles, providing a facile and robust route to obtain useful physical insights into the structure of polydisperse diblock copolymers at interfaces.

Introduction

Almost all polymers are polydisperse,1 and as a result, understanding the effects of chain length polydispersity on structure and self-assembly has been one of the most important problems in polymer physics.2–25 Most theoretical studies26–28 deal with monodisperse polymers and copolymers, rather than polydisperse systems, due to the relative ease of modeling such systems. The fact that even polydisperse block copolymers can self-assemble into well-ordered morphologies4,9,12–22 and macrophase separate12,14 has led to a renewed interest in understanding effects of polydispersity in block copolymers.

Almost three decades ago, Hashimoto4 et al. demonstrated that uniformity of microphase segregated domain sizes in melts of poly(styrene)-poly(isoprene) di-block was much higher than the uniformity of molecular weights of the di-block copolymers. These experiments implied that the copolymers of different molecular weight were mixed at the molecular level and packed in ordered domains to compensate for the molecular weight distribution. In the same decade, theoretical investigations2,3,6 on the effects of molecular weight distribution on the thermodynamics of di-block copolymer melts revealed that an increase in the polydispersity index (PDI) of the copolymers should lead to stabilization of the ordered morphologies over the disordered phase along with a decrease in the dominant wavevector of the composition fluctuations, q*, near the disorder–order transition. Physically, the decrease in q* hints at an increase in the domain spacing of the ordered morphology appearing in the microphase segregated regime. The increase in the domain spacing is due to the presence of longer chains and relative ease5,9–11,14 in stretching a polydisperse system in contrast to a monodisperse system. The effects of polydispersity on the stretching entropy of chains manifest in the stabilization of curved morphologies with an increase in PDI in the melts of linear di-block copolymers.9,14 The effects of increasing the PDI on the order–order transition boundaries was found to be similar to the changes expected from increasing statistical segment length of the polydisperse block.9

Self-consistent field theory7,8,10,12,14 (SCFT) and Monte-Carlo (MC) simulations16,18 have been used to study micro- as well as possible macro-phase separation in di-block copolymer melts containing one polydisperse block connected to a monodisperse block. Predictions from theory are compared with experiments14 on similar systems, and despite some unresolved issues that occur near the disorder–order transition temperature, reasonable agreement between the SCFT predictions, MC simulations and experiments are found. However, effects of chain length polydispersity on microphase separation in thin films are not frequently studied and still pose a challenge to the scientific community. Thin and ultrathin films of block copolymers have been studied extensively.28–37 In addition to the roles played by monomer–substrate interactions,31 concepts like entropic segregation29 due to conformational asymmetry between the blocks and confinement induced morphological changes30 are well-established for films of monodisperse block copolymers. In contrast, systematic studies focusing on the effects of polydispersity in thin films are only a few.15,22

On the experimental side, because of the penetrating power and short wavelength of neutrons, specular neutron reflectivity38–44 (NR) provides useful insights into structure of polymer thin films. However, interpretation of the reflectivity curves requires modeling scattering length density (SLD) profiles. Formally, the SLD is the total bound coherent scattering length per molecular volume, which depends on the relative volume fractions of the constituent monomers and how they are arranged. For example, with the lamellar forming polydisperse di-block copolymers studied in this work, a priori it is not clear how to set up the nanoscale features of the SLD profiles due to a lack of knowledge about the number of lamellar strata that are present in a film of a given thickness. On the other hand, SCFT can be used as a complementary tool to predict the number of lamellar strata that are present in a film, whose thickness is determined from fringes in NR or by using other techniques like ellipsometry. Furthermore, the density profiles obtained from SCFT can be used to construct the SLD profiles and NR curves, enabling a direct comparison with experiments.

In this work, our focus is to study microphase separation in thin films of lamellar forming polydisperse di-block copolymers, where one block is polydisperse and the other is nearly monodisperse. This work is motivated by two goals: the first goal is to develop a fundamental understanding of the effects of polydispersity in chain lengths on the microphase separation in thin films, which is different from the separation in bulk; and the second goal is to develop a computational framework for the prediction of NR profiles for the thin films. As a result, it will be possible to verify some of the theoretical predictions. Furthermore, noting that the SCFT provides an equilibrium description of the microphase separation, comparison with experimental NR profiles allows us to determine whether the structures probed by the experiments are equilibrium or non-equilibrium ones. With this aim in mind, we have generalized the SCFT28 for polydisperse di-block copolymer melts to thin films and used this theory to study the effects of the strengths of monomer–monomer and substrate–monomer interactions, film thickness and polydispersity on the microphase separation. Analytical treatment of polydisperse di-block copolymer melts in the strong segregation limit as well as numerical SCFT are used to demonstrate polydispersity-induced conformational asymmetry45,46 and to study its implications on microphase separation in thin films.

For the experiments, we have synthesized poly(glycidylmethacrylate)-poly(2-vinyl-4,4-dimethyl-d6 azlactone) (PGMA-PVDMA-d6) (see Fig. 1 for the chemical structure) di-block copolymers with equal volume fractions of PGMA and PVDMA-d6 so that the PGMA blocks are polydisperse and the PVDMA-d6 blocks are narrowly-dispersed. Our particular interest in studying PGMA-PVDMA-d6 di-block copolymers lies in the use of these reactive polymers to create functional interfaces.35–37 Microphase segregation in the bulk as well as in thin films containing these polymers are studied using small angle neutron scattering (SANS), transmission electron microscope (TEM) and NR experiments. The NR experiments provide a unique opportunity for non-invasive monitoring of the layer segment density profile. In order to create scattering contrast between the two blocks, VDMA-d6 was synthesized36 and used in these studies. Deuterium substitution of the protons on the dimethyl groups of the azlactone ring increases the SLD by a factor of 2.75 over that of VDMA,36 allowing for differentiation of PVDMA-d6 and PGMA by neutrons. Density profiles computed via the SCFT are used to construct SLD profiles as well as NR profiles that are compared with those measured on PGMA-PVDMA-d6 films.


image file: c5ra00974j-f1.tif
Fig. 1 Chemical structure for the poly(glycidylmethacrylate)-poly(2-vinyl-4,4-dimethyl-d6 azlactone) (PGMA-PVDMA-d6) di-block copolymer studied in this work.

Before presenting our results, we briefly review and contrast this work with other studies focusing on the effects of polydispersity in thin films of di-block copolymers. In ref. 15, Sriprom et al. synthesized di-block copolymers containing nearly monodisperse poly(methyl methacrylate) (PMMA) linked to polydisperse poly(butyl acrylate) (PBA) using reversible addition–fragmentation chain transfer (RAFT) polymerization. Microphase separation in thin films of thicknesses <100 nm was studied using atomic force microscopy and neutron reflectivity. Four different di-block copolymers with a fixed degree of polymerization but different relative volume fractions of PMMA and PBA were studied, and morphologies such as parallel lamellae, hexagonally packed perforated lamellae, parallel cylinders and hexagonally packed spheres were observed. However, only qualitative comparisons with predictions from theory were presented. Furthermore, Widin et al.22 synthesized narrow dispersity poly(styrene) (PS) block linked to a PMMA block with broad dispersity using sequential nitroxide-mediated polymerization and studied microphase separation in the bulk and thin films. The thin films were prepared by modifying silicon substrates via grafting hydroxyl-terminated random copolymers of styrene and methyl methacrylate. Studies were focused on films having thicknesses less than the bulk domain spacings, and lamellae as well as hexagonally packed cylinders oriented perpendicular to the substrate were observed. Quantitative comparisons with the theoretical work were not reported. In this work, we focus on the lamellar forming polydisperse di-block copolymers and provide detailed comparisons between the theoretical predictions and experiments done on films (without any surface modifications) of varying thicknesses. The comparisons have been made possible due to the use of neutron reflectivity and the SCFT in a synergistic way.

Experimental section

Polymer synthesis and characterization

The syntheses of 2-vinyl-4,4-dimethyl-d6 azlactone (VDMA-d6) and PGMA-PVDMA-d6 by reversible addition–fragmentation chain transfer (RAFT) polymerization are detailed in a previous report,36 so only a brief summary of the polymerization is presented here. The diblock copolymer of PGMA-PVDMA-d6 was made by chain extension of a PGMA macro-chain transfer agent (PGMA-macroCTA) made by RAFT polymerization of glycidylmethacrylate (GMA): VDMA-d6 (2.18 g, 1.50 × 10² mol) was combined with PGMA-macroCTA (1.36 g, 5.44 × 10⁻⁵ mol; VDMA:PGMA-macroCTA = 276), V-70 (5.59 mg; molar ratio of PGMA-macroCTA[thin space (1/6-em)]:[thin space (1/6-em)]AIBN = 3[thin space (1/6-em)]:[thin space (1/6-em)]1) and benzene (15.0 mL). The reaction vessel was capped with a rubber septum and the solution was sparged with dry argon for approximately 30 min. The reaction vessel was then placed in a heated oil bath thermostatted at 30 °C and allowed to react for a predetermined time, after which the reaction vessel was immersed in liquid nitrogen to quench the polymerization. PGMA-PVDMA-d6 was subsequently reconstituted in THF and precipitated in a 10-fold excess of hexanes (repeated 3 times) and dried in vacuo.

The recovered PGMA-macroCTA and di-block copolymer were characterized by NMR spectroscopy and size exclusion chromatography (SEC). Solution 1H and 13C NMR spectroscopy was performed on a Varian VNMRS 500 MHz multinuclear spectrometer. Samples were placed in 5 mm o.d. tubes with sample concentrations of 5 and 10% (w/v), respectively. Chloroform-d (CDCl3) was used as the solvent and residual solvent peaks serve as internal standards. Molecular weights and polydispersities were obtained by SEC using a Waters Alliance 2695 Separations Module equipped with three Polymer Labs PLgel 5 m mixed-C columns (300 × 7.5 mm) in series, a Waters Model 2414 Refractive Index detector (λ = 800 nm), a Waters Model 2996 Photodiode Array detector, a Wyatt Technology miniDAWN multi-angle light scattering (MALS) detector (λ = 660 nm), and a Wyatt Technology ViscoStar viscometer. THF was used as the mobile phase at a flow rate of 1 mL min−1. The refractive index increment, dn/dc, was determined off-line and calculated using Astra V software, as described previously.36

Thin film assembly and transmission electron microscopic (TEM) characterization

Silicon samples (1.0 × 1.2 cm, Silicon Quest) were cleaned immediately before use by immersion for 45 minutes in a piranha acid solution at 110 °C (3[thin space (1/6-em)]:[thin space (1/6-em)]1 v/v solution of sulfuric acid (EMD, 95–98%) and 30% hydrogen peroxide (VWR, 29–32%)) followed by rinsing with copious amounts of distilled, de-ionized water and drying with a stream of dry nitrogen. Thin films were made by the protocols described in our earlier work.36 In short, silicon wafers were spin-coated (Laurell WS-400B-6NPP/LITE) with a solution of block copolymer (PGMA-PVDMA-d6) in chloroform (2500 rpm, 15 s), and immediately annealed for 18 h in an oven preheated to 110 °C, which provides chain mobility and allows the epoxide groups of PGMA to react with surface hydroxyl groups, thus anchoring the chains to the surface. After cooling under vacuum to room temperature, the modified wafers were immersed in chloroform and sonicated for 15 min to remove any physisorbed polymer from the surface, and then dried with a stream of dry, filtered N2.

TEM characterizations were done using samples embedded in a low viscosity epoxy resin (Ted Pella) and microtomed into ∼75 nm thick slices for experiments. Bright-field TEM imaging was performed in a Zeiss Libra 120 equipped with an in-line energy filter. A low emission current of ∼4 μA and acceleration voltage of 120 kV were used along with other proper beam conditions to carefully monitor and effectively minimize electron-dose introduced microstructural changes.

Neutron reflectivity (NR)

Measurements were made using the Spallation Neutron Source Liquids Reflectometer (SNS-LR) at Oak Ridge National Laboratory. The SNS-LR collects specular reflectivity data in continuous wavelength bands at several different incident angles. For the data presented here we used the wavelength bands ranging over 2.5 Å < λ < 17 Å and measured reflectivity at discrete angles ranging between 0.6° < θ < 1.97°, thereby spanning a total wavevector transfer (q = 4π[thin space (1/6-em)]sin[thin space (1/6-em)]θ/λ) range of 0.008 Å−1 < q < 0.16 Å−1. Data were collected at each wavelength band and angle with incident-beam slits set to maintain a constant wavevector resolution of δQ/Q = 0.03, enabling data obtained at seven different (λ, θ) settings to be stitched together into a single reflectivity curve. To fit the data, the initial thicknesses measured using spectroscopic ellipsometry were used for reflectivity simulations and then these thicknesses were adjusted to correspond to the fringes in the neutron reflectivity. The neutron scattering length density (SLD) was determined using the equation SLD = b/v, where b is the monomer scattering length (sum of scattering lengths of constituent atomic nuclei) and v is the monomer volume. The calculated reflectivity curves were optimized for goodness-of-fit.

Small angle neutron scattering

SANS data were collected at the Spallation Neutron Source at ORNL with the EQ-SANS instrument using the standard sample environment at ambient temperature.47 The beam was collimated with a 25 mm source aperture and a 3 mm sample aperture. Three different instrument configurations were employed for the measurements: 7.0 m sample-to-detector distance with a minimum wavelength setting of 10 Å; 4.0 m sample-to-detector distance with a minimum wavelength setting of 2.5 Å; and 1.3 m sample-to-detector distance with a minimum wavelength setting of 1.0 Å. The combined q-range provided by these three instrument configurations was 0.002 Å−1 < q < 2.79 Å−1. In all configurations, the choppers were set to run at 60 Hz, thereby providing a single wavelength band of neutrons.47 The samples were affixed in screw-together titanium cells having quartz windows for the measurements. An empty titanium sample cell was measured to provide a background to use during the reduction.

Data reduction into I(q) vs. q, where q is the neutron momentum transfer, followed standard procedures implemented in the MantidPlot software.48 The data from the three configurations were merged into a single profile using analysis algorithms implemented in MantidPlot. Data analysis was limited to fitting a Gaussian function to the observed diffraction peak using OriginPro (OriginLab Corp., Northamption, MA 01060, U. S. A.). The fitting utilized data from the 7.0 m and 4.0 m configurations described above. While the 1.3 m configuration did provide data in the range that included the diffraction peak, the q-resolution for that configuration is sufficiently broader (greater than 3 times as broad) than that of the other two configurations and not as well-characterized, making it prudent to not employ data from that configuration when fitting the diffraction peak.

Self-consistent field theory (SCFT)

SCFT for monodisperse and polydisperse di-block copolymer melts is very well-documented in literature. Details of our generalization of the SCFT for polydisperse di-block copolymer melts to thin film geometry can be found in the ESI. The SCFT results presented in this work were obtained by using the parallel SCFT code PolySwift++ (http://www.txcorp.com/polyswift) developed at Tech-X Research in collaboration with the Oak Ridge National Laboratory (ORNL).

Results and discussion

In order to develop a fundamental understanding of microphase separation in thin films of polydisperse di-block copolymers, we have simulated films of varying thicknesses containing polymers of different polydispersity indices (PDIs). The theoretical predictions and comparison between theory and experiments are sequentially presented in the following sections. Details of the SCFT are presented in the ESI.

Before detailing the results, we present an outline of following sections. SCFT predictions of the volume fraction profiles for different film thicknesses and PDIs in the lamellar forming di-block copolymers are presented in the next section. These predictions are compared with analytical theories in the strong stretching and weak segregation limit at appropriate places. This is followed by our comparison with experiments revealing that the effects of polydispersity on structure and segregation behavior determined by SCFT can both be verified by NR measurements and used to help interpret the measured reflectivity profiles. Also, microphase separation in thin films is contrasted with the bulk (i.e., in the absence of substrates) and highlights importance of entropic effects and monomer–substrate interactions.

Theoretical predictions

Annealing the thin polymer films provides mobility to the chains and also allows the epoxide groups of PGMA to react with silenol groups on the silicon substrate. Previous studies used NR and contact angle measurements to show that PVDMA-d6 prefers the air interface.36 The asymmetric monomer–substrate interactions in the case of PGMA-PVDMA-d6 lead to surface-parallel lamellar morphology, which is confirmed by NR experiments and shown in the next section. Keeping these features in mind, we have studied a polydisperse A–B block copolymer system where the polydisperse block (A) has a preference for one substrate (silicon) and dislike the other (air). Also, lamellar forming di-block copolymers corresponding to equal average volume fractions of A and B monomers are studied using the SCFT.

The asymmetry in monomer–substrate interactions leads to volume fraction profiles shown in Fig. 2, where the components A and B have preference for left (silicon) and right (air) substrate, respectively. For comparison with the experiments, which is presented in the next section, the left and right substrates correspond to polymer–silicon and polymer–air interfaces, respectively. The asymmetry in interactions leads to a higher volume fraction of component A next to the substrate (left) and depletion from the film–air interface (right), as shown in Fig. 2. In our simulations, we take into account the diffuse nature of the two substrates by incorporating masking functions (cf. Fig. 2). The form of the masking functions are assumed based on modeling the NR data presented in the next section. Here we have taken these masking functions to be of the form 0.5(1 ± tanh((zz±)/ξ±)), where − and + corresponds to left (i.e., polymer–silicon) and right (i.e., polymer–air) interface, respectively. Parameters z± and ξ± prescribe the center and width of the masking functions, respectively.


image file: c5ra00974j-f2.tif
Fig. 2 Model set of volume fraction (= ϕ) profiles for the different components and masking functions used to capture the diffuse nature of substrates in the SCFT simulations are shown here. The masking functions are assumed to be known for these simulations.

We have parameterized the interaction energy between the monomers and particles in the substrates by χ parameters. Subscripts a and s are used to represent air and silicon substrate, respectively. For example, χaA represents the parameter for interaction between A monomer species and the air. The interaction parameters χjA and χjB (j = a, s) determine tendencies for the polymer chains either to wet or to be excluded from the confining surface, with the relative magnitude of the χ parameters (i.e., χjAχjB) determining the effective attraction or repulsion for a monomer species to a substrate. For example, if χsA < χsB then A monomers preferentially wet the silicon substrate. Absolute values of these parameters determine how strongly the monomers are repelled from the substrate or air interfaces.

We have systematically varied different parameters characterizing film thicknesses, monomer–substrate and monomer–monomer interaction energies to study their effect on the structure of the thin films. We have found that the polydispersity of the A block leads to two effects. First, in strongly confined systems corresponding to film thicknesses (L) less than 6Rg, Rg being the radius of gyration of Gaussian chains of the same length, the polydisperse block tends to populate the middle of the film despite favorable interactions of the block with the left substrate (cf. Fig. 3). Second, in weakly confined systems (L > 6Rg), an increase in segregation strength is observed with an increase in polydispersity index of the A block, PDIA (cf. Fig. 4). Both of these effects lead to a dependence of the number of strata present in a film of given thickness on the polydispersity index (cf. Fig. 5). This means, in turn, that the effects of polydispersity and film thickness play important roles in the modeling and interpretation of NR data, which is discussed in the next section.


image file: c5ra00974j-f3.tif
Fig. 3 Results from SCFT showing effects of polydispersity and monomer–substrate interaction strength on the microphase segregation in a film of thickness L = 5Rg are presented here. In (a), it is shown that an increase in polydispersity of the block A (PDIA) leads to an increase in volume fraction of the A monomers, ϕA, near the middle of the film despite favorable interactions with the left substrate i.e., χsBχsA > 0. In generating results for (a) using the SCFT, we have taken χaA = χsB = 0.11, χsA = χaB = 0.001 so that χsBχsA > 0, χaAχaB > 0, which should lead to wetting of the left and right substrate by the A and B block, respectively. Furthermore, an increase in monomer–substrate interaction parameter (so that χaA = χsB = χpw, χsA = χaB = 0.001) leads to enrichment of the polydisperse component near the left substrate with favorable interaction parameter. For (b), we have taken PDIA = 1.36. Also, in order to obtain the results shown in (a) and (b), we have taken the monomer–monomer interaction parameter to be χABNn = 10.

image file: c5ra00974j-f4.tif
Fig. 4 Effect of PDI on the microphase segregation for bulk and thin film systems. (a) Shows the theoretical predictions for the lamellar domain spacing in polydisperse di-block copolymer melts in the strong stretching limit (eqn (4)) and without any boundaries, where one block is polydisperse and the other is monodisperse. (b) Shows the volume fraction profiles predicted by SCFT for the polydisperse block in a film of thickness L = 12Rg, χABNn = 10, χsA = χaB = 0.001, χaA = χsB = 0.11.

image file: c5ra00974j-f5.tif
Fig. 5 Volume fraction profiles of A monomers in thin films of lamella forming di-block copolymers for χABNn = 10, χsA = χaB = 0.001 and χaA = χsB = 0.11. (a) Represents films containing monodisperse chains and (b) corresponds to films containing polydisperse di-block copolymers with PDIA = 1.36.

In order to investigate the effects of polydispersity, we have increased PDIA and found an increase in volume fraction of the polydisperse component, ϕA, near the middle of the film and a depletion from the substrate with preferential interactions, as shown in Fig. 3(a). Also, we have varied the relative magnitudes of the interaction energy parameter between the monomers and the substrates for the thinnest films, and results are presented in Fig. 3(b). An increase χsBχsA leads to an increase in ϕA next to the substrate. Deconvolution of the volume fraction profile of the polydisperse component into contributions from different chain lengths (inferred by analyzing different quadrature points used in the SCFT for construction of volume fraction profiles – for details, see Fig. S1 in the ESI) reveals that short chains are uniformly dispersed in the thin film while the longer chains lead to non-uniform distribution within the film. An increase in χsBχsA leads to a higher volume fraction of the long chains near the left substrate (data not shown), as expected, due to the fact that (χsBχsA)N characterizes the relative strength of interaction between monomers and the left substrate, with N being the number of Kuhn segments in a block copolymer chain.

The observed behaviors in the thin films of polydisperse di-block copolymer system are quite similar to entropic effects at play in confined polymer blends resulting from conformational asymmetry between the polymers constituting the blend. In particular, it has been shown49 that in a binary blend, the polymer having a smaller Kuhn segment length tends to prefer the substrate in cases where energetic effects due to monomer–substrate interactions are negligible. Furthermore, entropic effects were shown to be strongest in the thinnest films. These behaviors are similarly reflected in the results observed for the thin films of polydisperse di-block copolymers where L < 6Rg. An increase in χsBχsA is similar to transition from an entropy dominated regime to energy dominated regime (cf. Fig. 3(b)). Using this analogy, it appears that chains in the polydisperse block have larger effective Kuhn segment lengths.

Insights into the effect of PDI on the conformational entropy and in turn, on the effective Kuhn segment length can be obtained by considering the chains in the strong stretching limit. In this limit, the chain conformational entropy in a lamellar morphology can be approximated by the cost of stretching (= Fst) (per chain) a polydisperse brush5,11 by a distance R, given by

 
image file: c5ra00974j-t1.tif(1)
where n is the number of chains, fA is the average volume fraction of A component, 〈Nn is the number average molecular weight of the chains, lA, lB are the Kuhn segment lengths of blocks A and B, respectively. Parameter SA depends on PDI via its definition
 
image file: c5ra00974j-t2.tif(2)
where pA(N) is probability distribution function of the chain lengths of A blocks. Numerical estimates of SA can be obtained assuming that pA(N) is described by the Schulz–Zimm distribution,1,7,8,11,12,14 given by
 
image file: c5ra00974j-t3.tif(3)
where ν and NA control different characteristics such as the average, width and height of the distribution. For example, for the distribution, the number average, weight average and polydispersity index of the A block is given by 〈NAn = vNA, 〈NAw = (v + 1)NA and PDIA = (v + 1)/v, respectively. Also, Γ(v) is the Gamma function. Because we have assumed that the B block is monodisperse, this, in turn, leads to the number average molecular weight of the chains as 〈Nn = vNA + NB, where NB is the number of Kuhn segments in the B block. Numerical calculations11 based on the Schulz–Zimm distribution reveal that SA decreases with increasing PDIA and is always less than unity. Physically, this means that it is easier to stretch the polydisperse system in comparison to a system comprised of monodisperse chains. From eqn (1), we can define an effective Kuhn segment length of the polydisperse chains as image file: c5ra00974j-t4.tif. Also, the monotonic decrease in SA with an increase in PDIA leads to an increase in lA,eff. Thus, it is clear that polydispersity introduces conformational asymmetry even in near-symmetric systems and leads to the entropic effects in the thin films, which were discussed above. It is to be noted that, in ref. 9 and 10 effects of polydispersity on the shifts in the disorder–order and order–order transition boundaries in the bulk were found to be similar to those expected from an increase in the Kuhn segment length of the polydisperse block resulting from an increase in its PDI. However, no formal derivation for such a behavior was given.

An increase in the chain length polydispersity, which increases the conformational entropy, also manifests in an increase in domain spacing in the bulk (i.e., without any substrates), which has been verified by experiments9,14 and theory.2,3,6–8,10,11 Domain spacing (D) of a lamella formed by the polydisperse A–B di-block copolymers in the bulk can be determined by minimizing the free energy obtained by adding the conformational entropy (eqn (1)) to the interfacial energy11 of a planar interface in the strong stretching limit. Minimizing the free energy with respect to R, the domain spacing (= R at the minimum) is given by

 
D = D0[fASA + (1 − fA)]−1/3 (4)
where D0 = 2[8χABNn/3π4]1/6N1/2nl. Noting that SA = 1 for PDIA = 1, DD0 becomes the domain spacing adopted by a melt of monodisperse A-B di-block copolymers. In writing eqn (4), we have ignored any permanent conformational asymmetry of the two blocks i.e., lA = lB = l. As fA < 1, SA < 1, and it is clear that from eqn (4) that D > D0. In other words, the domain spacing of the lamellar morphology increases with an increase in PDIA due to decrease in SA (cf. eqn (2)). Numerical estimates of the changes in domain spacing in the strong stretching limit resulting from eqn (4) are shown in Fig. 4(a). Although these numerical estimates are relevant for the strong stretching limit in the bulk, which corresponds to χABNn → ∞, an increase in the domain spacing with an increase in PDIA is also predicted by calculations focusing on the weak segregation limit (see Fig. S4(a) in the ESI). Microphase separation in the bulk and thin films can be significantly different due to the fact that confinement effects play an important role in the latter. In order to contrast the behaviors of polydisperse di-block copolymers in the bulk and in thin films, we have shown volume fraction profiles of A monomers obtained from the SCFT calculations for L = 12Rg in the weak segregation limit (χABNn = 10) for different values of PDIA in Fig. 4(b). Numerical results for volume fraction profiles show that sharper interfaces are formed with an increase in PDIA without any significant changes in the domain spacing. Furthermore, we have found that the polymer–substrate interaction effects are also responsible for order in films even when χABNn < χAB,sNn, χAB,sNn being the stability limit of the disordered phase in the polydisperse di-block copolymer melts in the bulk. For the calculations of χAB,sNn, see Fig. S4(b) in the ESI. Some representative examples of this behavior are presented in the next section. It is to be noted that the surface-induced ordering for χABNn < χAB,sNn is similar to the one observed by Menelle et al.43 for monodisperse di-block copolymers and explained using theoretical work by Fredrickson.29 Furthermore, formation of sharper interfaces with an increase in PDIA for a fixed χABNn results from an increase in the segregation strength (i.e., (χABχAB,s)〈Nn) due to a decrease in χAB,sNn (cf. Fig. S4(b) in the ESI).

Conformational entropy also has an important role in dictating the number of strata that can be packed in a film of known thickness. Turner30 showed that for monodisperse diblock copolymers in the strong segregation limit, the ratio of film thickness (L) to the domain spacing of the lamellae in the absence of substrates (D) is one of the key parameters that dictates the number of layers that can be packed in a given film. One of the predictions of the theory is an increase in the number of strata with an increase in L/D in discrete (quantized) steps. Hence, with an increase in the PDI, the number of strata that are present in a film of fixed thickness should decrease due to increase in D (cf. Fig. 4(a)) and quantization30 of L/D. Note that while Turner's theory is strictly valid in the strong stretching limit (χABN → ∞), our numerical computations are done in the weak and intermediate segregation limit (i.e., χABN < 15) due to their relevance for experimental data presented in the next section. Despite these differences in the segregation strengths, we see qualitative agreement between Turner's theory and the SCFT results in Fig. 5, where we compare volume fraction profiles of monodisperse and polydisperse di-block copolymers in thin films. It can be seen that the thin film of thickness L = 10Rg has three peaks in the volume fraction profile for the monodisperse case, whereas the volume fraction profile for a PDIA = 1.36 has only two peaks. This behavior is in agreement with the prediction of decrease in the number of strata that are formed in a film of fixed thickness as the PDI increases. However, for L = 5Rg, the volume fraction profiles are significantly different even in qualitative features due to the entropic effects discussed above. Furthermore, work by Turner30 and Fasolka et al.32,33 show that the transition boundaries between surface-parallel and surface-perpendicular lamellar morphology in the case of symmetric and asymmetric monomer–substrate interactions, respectively. In particular, it was shown32,33 that entropic effects stabilize the surface-perpendicular lamellar morphology in ultrathin films (defined by L < D) for non-selective substrates. For comparison with the experiments on thin films of PGMA-PVDMA-d6, we have considered asymmetric monomer–substrate interactions so that only surface-parallel lamellar morphologies are observed in our SCFT simulations, which is in qualitative agreement with Fig. 2 of work by Fasolka et al.32 dealing with ultrathin films containing monodisperse lamellar forming di-block copolymers.

The effects of polydispersity on structure and segregation behavior determined by SCFT can be both verified by NR measurements and used to help interpret the measured reflectivity profiles. In the next section, we compare results of the SCFT modeling of the thin films with those from NR experiments on PGMA-PVDMA-d6 block copolymers.

Comparison with experiments

Our numerical results show that polydispersity can work in concert with interaction energies to profoundly impact microphase segregation of thin films (cf. Fig. 3). In particular, for ultra-thin films, qualitatively different volume fraction profiles are predicted in the entropy and energy dominated regimes as shown in Fig. 3. In what follows, we use precisely designed di-block copolymers and neutron scattering to verify predictions from theory. In particular, to compare microphase segregation in thin films and in thicker (bulk-like) films, we use NR and SANS, respectively.

We synthesized di-block copolymers containing a polydisperse PGMA block and a narrowly dispersed PVDMA-d6 block using reversible addition chain-transfer (RAFT) polymerization (see Experimental section).36 Molecular characteristics of these polymers are presented in Fig. 1.

The di-block copolymer was synthesized by chain extension of a PGMA macro-chain transfer agent (PGMA macroCTA), which had a PDI of 1.36. While this means that the PDI of the PGMA blocks in the di-block copolymers is 1.36, chain extension leading to the PGMA142-PVDMA148 diblock copolymer, which contains, on average 142 repeat units of GMA and 148 repeat units of VDMA-d6, creates a diblock copolymer with a PDI of 1.19. Assuming that PVDMA-d6 is monodisperse and polydispersity of the PGMA blocks follows the Schulz–Zimm distribution (eqn (3)), the PDI of the chain is given by8

 
image file: c5ra00974j-t5.tif(5)
where PDIPGMA = (v + 1)/v, 〈NPGMA〉 is the number average of repeats in the PGMA block and NPVDMA-d6 is the number of repeats in the PVDMA-d6 block. Here, we have used the approximation that GMA and VDMA-d6 monomers have equal molecular weights. This approximation is reasonable, as the monomer masses of GMA and VDMA-d6 are 142 and 139, respectively. For PDIPGMA = 1.36 (i.e., v = 2.777) as per Table 1 and taking 〈NPGMA〉 = NPVDMA-d6, eqn (5) gives PDIPGMA-PVDMA-d6 = 1.09. This analysis shows that the PVDMA block is not strictly monodisperse but has a narrow polydispersity. In our theoretical analysis, we assume that the PVDMA-d6 is monodisperse and PGMA has a PDI of 1.36. While after the fact we found no significant effect due to polydispersity in the PVDMA-d6 block, in the future we plan to extend the SCFT treatment to include di-block copolymers having polydispersity in both blocks.

Table 1 Compositional and molecular weight characteristicsa
Sample Mol % of PVDMA Mnb (kg mol−1) PDIb
a Determined by 1H NMR.b Obtained from SEC-MALLS.
PGMA MacroCTA 20.2 1.36
PGMA142-PVDMA148 50% 40.8 1.19


In order to determine the morphology of the PGMA-PVDMA-d6 in the bulk (i.e., in the absence of substrates), we used SANS and TEM. As shown in Fig. 6, TEM reveals that bulk morphology is lamellar, in agreement with the SCFT predictions.10,12 SANS intensity and fit for the first peak are shown in Fig. 6. Based on the location of the peak, the domain spacing of the lamellar morphology is estimated to be 25.8 nm. It is to be noted that long range order is not observed in the bulk, as evident from the TEM image and from the absence of higher order peaks in SANS. This may be due to low values of χPGMA-PVDMA-d6Nn as determined by our NR measurements shown below.


image file: c5ra00974j-f6.tif
Fig. 6 SANS intensity (a) and TEM image (b) for PGMA-PVDMA-d6 di-block copolymer melts show that the di-block copolymer adopts a lamellar morphology in the bulk.

In order to study microphase segregation in thin films, we have done NR experiments on three films of different thicknesses, which span strongly confined to weakly confined regimes. Results of these experiments and the best fits obtained for model SLD profiles are presented in Fig. 7. The procedure for modeling the NR profiles involved first making an initial estimate of the film thickness from the spacing between the fringes, and then augmenting the model with predictions from SCFT. Specifically, the SCFT simulations with the hyperbolic tangent masking functions (as discussed in the previous section) were used to determine the number of strata present in the thin film and their thicknesses. These simulations were run to mimic PGMA-PVDMA-d6 systems with PDIPGMA = 1.36 and different values of χ parameters characterizing monomer–monomer and monomer–substrate interactions. The SCFT predictions were used to construct a multi-layer model, and the Parratt's formalism38 was used to construct a fit – a prediction of the specular reflectivity – of the measured reflectivity data. In other words, we have used predictions of the SCFT as a starting guess to construct the multi-layer models, which makes it easier to find the best fit, which are shown in Fig. 7. It is worth emphasizing that the fits produced from the model resulting from SCFT results as an initial guess yielded the lowest values of image file: c5ra00974j-t6.tif being the number of observations, used for characterizing goodness of the fits (labeled as “Best model” in Fig. 7).


image file: c5ra00974j-f7.tif
Fig. 7 Comparison of the calculations of neutron reflectivity (NR) based on the models shown in (b) with the experiments done on three films of PGMA-PVDMA-d6 di-block copolymers is shown in (a). Parratt's multilayer formalism38 is used to compute the neutron reflectivity. Total thickness of each film (excluding oxide layer on the silicon substrate) is shown in (a) and the curves are shifted vertically for comparison purposes. Fits labeled “Best model” have the lowest values of parameter for estimation of goodness of fits and “WSL model” are based on analytical calculations in the weak segregation limit.

For a physical interpretation of the NR profiles, we have constructed the volume fraction profiles of PGMA and PVDMA repeat units (Fig. 8) leading to the SLD profiles representing the “Best model” shown in Fig. 7(b). In transforming the SLD profiles into volume fraction profiles, we preserved mass balance based on the stoichiometry (composition) of the di-block copolymer, which was known based on characterizations presented in Table 1 (the details of these transformations are provided in the ESI). Reference mass density ρ0, which is a measure of chain packing, is extracted from these transformations for the three films and the values are presented in Fig. 8(d).


image file: c5ra00974j-f8.tif
Fig. 8 Volume fraction profiles of different components obtained from the modeling of neutron reflectivity profiles for the three films of PGMA-PVDMA-d6 di-block copolymers. (a)–(c) Correspond to film thickness of 412.0 Å, 286.1 Å and 123.0 Å, respectively. Calculated reflectivity for these volume fraction profiles are shown as “Best model” in Fig. 7. (d) Shows the reference mass density extracted from transformation of SLD profiles into the volume fraction profiles preserving mass balance based on composition of the PGMA-PVDMA-d6 copolymers. Also, the estimated χPGMA-PVDMA-d6Nn based on the modeling of neutron reflectivity profiles using analytical theory in the weak segregation limit are presented in (d).

The SCFT provides description of volume fraction profiles at equilibrium in the thin films. However, it is not clear whether the multi-layer models corresponding to the best fits represent equilibrium or non-equilibrium structures due to the presence of kinetic effects in thin films. In order to distinguish between the two, we ran another round of SCFT simulations using refined masking functions and total film thicknesses extracted from the best fits presented in Fig. 7 and 8. Details of extracting the masking functions are presented in the ESI (Fig. S2). We have varied five χ parameters characterizing monomer–monomer, monomer–substrate and monomer–air interactions in the SCFT to change the volume fraction profiles inside the film. In this way, the internal structure of the thin films is allowed to vary with a more accurate description of the diffuse nature of the substrates. Due to the fact that each SCFT calculation is computationally intensive, it is not practical to vary the five χ parameters in an arbitrary fashion. It turns out that the polydisperse di-block films studied in this work lie in the weak and intermediate segregation limit (cf. Fig. 8). We have estimated the χ parameters using an analytical theory in the weak segregation limit (WSL).29 The theory is a straightforward generalization from the case of monodisperse copolymers to polydisperse and a brief description is presented in the ESI. χ parameters were extracted by fitting volume fraction profiles near each substrate using the theory with the assumption that each substrate is behaving independent of the presence of the other. The fits and extracted parameters are presented in Fig. S3 and Table S3 in the ESI. The SLD and NR profiles obtained using these theoretical fits are shown in Fig. 7, and an excellent agreement between the reflectivity profiles computed using the WSL theory and those obtained from NR measurements is found.

In addition, two useful insights are obtained by comparing the models constructed based on the WSL theory (cf. Fig. S3 in the ESI) and the “Best model”. First, disordered regions in the volume fraction profiles (appearing as flat regions) can not be modeled by the WSL theory. For example, a flat volume fraction profile is found in the middle of the film with L = 412 Å. The WSL theory and the SCFT (shown below) cannot reproduce this flat region of the profile, which represents spatial disorder near the middle and ordered regions near the substrates. This highlights the fact that either these regions have misaligned lamellae or these are regions having non-equilibrium structures. As the specular reflectivity laterally averages over the film area exposed to the incident neutron beam, regions with misaligned lamellar morphology may also appear as flat regions. Assuming these flat regions to be meta-stable non-equilibrium structures, we expect them to disappear and relax to the lowest equilibrium state (microphase segregated domains) with optimized annealing conditions, as per predictions of the SCFT presented in Fig. 9. Second, the assumption of the two substrates behaving independent of each other is only valid for the thickest film studied in this work; the assumption breaks down for the other two thinner films. This is evident from the values of χPGMA-PVDMA-d6Nn estimated from the fits, which characterize the segregation strength in each of the three films (see Table S1 in the ESI). Average values of the estimated χPGMA-PVDMA-d6Nn are presented in Fig. 8(d) and it is found that χPGMA-PVDMA-d6Nn increases with a decrease in the film thickness. This is in qualitative agreement with the fact that χPGMA-PVDMA-d6 ∼ 1/ρ0 and ρ0 (determined using NR) decreases as the film thickness decreases. However, it is noted that these values are significantly smaller than those estimated based on the SANS measurements of a bulk sample. This finding emphasizes the differences in microphase separation for the bulk and thin films, which is in qualitative agreement with the SCFT predictions discussed in the previous section.


image file: c5ra00974j-f9.tif
Fig. 9 Comparisons of volume fraction profiles obtained from modeling of NR profiles (cf. Fig. 8) and the “refined” simulations based on the SCFT for the films of thicknesses 412.0 Å, 286.1 Å and 123.0 Å are shown in (a), (b) and (c), respectively. Subscript “PG-PV-d6” means PGMA-PVDMA-d6. Reflectivity profiles for the “Best model”, which correspond to volume fraction profiles shown in blue above, are presented in Fig. 7. χsPGMA = χaPVDMA-d6 = 0.001, χaPGMA = χsPVDMA-d6 = 0.11 are used for the profiles shown in (a) and (b). χsPGMA = −0.35, χaPVDMA-d6 = 0.25, χaPGMA = χsPVDMA-d6 = 0.11 are used for the profiles shown in (c). Subscripts a and s corresponds to air and silicon substrate, respectively.

In order to go beyond the assumption of each substrate behaving independent of each other in the WSL theory and a more rigorous comparison with the experiments, we have varied the χ parameters around the estimated value from the analytical theory in the “refined” SCFT simulations. In Fig. 9, results from these SCFT simulations are compared with the volume fraction profiles corresponding to the “Best model” presented in Fig. 8. From Fig. 9, it is clear that the SCFT captures qualitative features, and quantitative agreement with the experiments can be achieved by varying χPGMA-PVDMA-d6, χjPGMA and χjPVDMA-d6 parameters. However, as already mentioned, the disordered regions in the films (which can be seen in Fig. 9(a) and (b)) cannot be described by the SCFT simulations. In addition, for the thinnest film, the SCFT captures the feature that the PGMA blocks, which is the polydisperse component, populate both the silicon and air substrate. This is in agreement with the predictions of the SCFT presented in Fig. 3. Comparison of volume fraction profiles presented in Fig. 3 and 9(c) reveals that the PGMA-PVDMA-d6 system studied in this work lies in the energy-dominated regime. Furthermore, we have also found that monomer–substrate interactions play a very important role in the thinnest film, as they affect the depletion zone. For example, χsPGMA = −0.35 has to be used to match the volume fraction profile of PGMA near the silicon substrate, but this negative value is not required to reproduce the depletion zones in the two thicker films. The negative value of χsPGMA indicates that there are attractive interactions between the GMA monomers and silicon substrate, which is expected from the reactive nature of GMA and silenol groups on silicon. Similarly, highly asymmetric values of χjPVDMA-d6, j = a, s with higher magnitude have to be used to reproduce the volume fraction profiles in the thinnest films. Highly asymmetric values of χjPVDMA-d6, j = a, s also explain the presence of only surface-parallel lamellar (i.e., absence of surface-perpendicular lamellar) morphology observed in NR measurements, in agreement with previous work on ultra-thin films of monodisperse di-block copolymers.32,33 All of these highlight the importance of monomer–substrate interactions in affecting volume fraction in the ultra-thin roles, as one may expect.

The SCFT provides a physics-based platform for interpreting neutron reflectivity data. In the absence of such a physics-based tool, interpretation of neutron reflectivity data relies on phenomenological inferences and fitting protocols. Thus, not only does the comparison of the SCFT-predicted density profiles with neutron reflectivity serve to validate the SCFT model, but it also provides a platform for interpreting neutron reflectivity data in an unambiguous manner.

Conclusions

Coordinated theoretical and experimental studies are used to develop a fundamental understanding of microphase separation in thin films of lamellar-forming polydisperse di-block copolymers (a polydisperse PGMA block linked to a narrowly dispersed PVDMA-d6 block). Theoretical investigations reveal that

(a) film thickness has important effects on microphase separation. Our field theoretic study reveals that entropic effects dominate systems having film thicknesses less than 5–6Rg. Furthermore, in agreement with previous bulk studies,9,10,14 it is shown that an increase in PDI of the polydisperse block induces conformational asymmetry, resulting in the polydisperse block having larger effective Kuhn segment length in comparison to the monodisperse block. This conformational asymmetry effect tends to drive the polydisperse block to the middle of the films;

(b) in agreement with earlier studies in the bulk,2,3,9–11,14 an increase in PDI of the polydisperse block (here PGMA) leads to an increase in lamellar domain spacing in the strong segregation limit as well as in the weak segregation limit. Strong stretching theory, which is valid in the strong segregation limit, reveals that this is a direct outcome of a lower entropic penalty for stretching the polydisperse block with increasing PDI. The increase in the domain spacing manifests in the shift of transition boundary for the number of packed lamellar domains towards thicker films with an increase in PDI; and

(c) for very thin films of thicknesses L < 5–6Rg, entropic effects resulting from polydispersity induced conformational asymmetry compete against monomer–substrate interactions.

Our neutron reflectivity experiments and modeling of the reflectivity profiles using the theory reveals that

(a) the SCFT provides a quantitative description of the density profiles and is a useful tool for modeling neutron reflectivity profiles;

(b) microphase separation in thin films and bulk is significantly different. In particular, Fig. 3 and 8(c) show the effects of polydispersity on the structure of ultrathin films (L < 5–6Rg) and demonstrate that the polydisperse block tends to populate middle of the film despite favorable interactions with one of the substrates. In the absence of the substrate, an increase in polydispersity will lead to stabilization of curved morphologies due to the induced conformational asymmetry.14 The behaviors shown in Fig. 3 and 8(c) are unique to the thin film geometry. Furthermore, Fig. 4(a) shows that an increase in PDI leads to an increase in domain spacing in the bulk. However, the increase in PDI leads to enhanced microphase segregation in a film without any significant changes in the domain spacing (cf. Fig. 4(b)). This result has direct implications on constructing models for interpreting the neutron reflectivity data. In addition, Fig. 8(d) shows that average mass density decreases with decrease in film thickness, which directly manifests in the segregation strength and volume fraction profiles. Again, this behavior is unique to the thin films and results from packing frustrations; and

(c) for the thinnest film considered in this work, the polydisperse block (PGMA) lies near the silicon substrate and air interface, which shows that the PGMA–substrate interaction energy dominates over the entropy effects resulting from induced conformational asymmetry. Also, due to the dominance of asymmetric monomer–substrate interaction energy effects, only surface-parallel lamellar morphology is observed in our experiments.

As an outlook, we believe that prediction of neutron reflectivity profiles using the SCFT provides a facile and robust route for model verification and can be easily generalized to other polymeric systems near interfaces. The SCFT provides a platform for interpreting neutron reflectivity data in an unambiguous manner.

Conflict of interest

The authors declare no competing financial interest.

Acknowledgements

This research was conducted in part at the Center for Nanophase Materials Sciences (CNMS), which is sponsored at Oak Ridge National Laboratory (ORNL) by the Scientific User Facilities Division, Office of Basic Energy Sciences, U.S. Department of Energy. SMKII acknowledges support from the National Science Foundation (Award no. 1133320). This work was supported by Laboratory Directed Research and Development (LDRD) at ORNL. Research conducted at ORNL's Spallation Neutron Source was sponsored by the Scientific User Facilities Division, Office of Basic Energy Sciences, US Department of Energy. The computations were performed using the resources of the CNMS and Oak Ridge Leadership Computing Facility at ORNL, which is supported by the Office of Science of the U.S. Department of Energy under Contract no. DE-AC05-00OR22725.

References

  1. P. Flory, Principles of Polymer Chemistry, Oxford University Press, Ithaca, 1953 Search PubMed.
  2. L. Leibler and H. Benoit, Polymer, 1981, 22, 195–201 CrossRef CAS.
  3. K. Hong and J. Noolandi, Polym. Commun., 1984, 25, 265–268 CAS.
  4. T. Hashimoto, T. Tanaka and H. Hasegawa, Macromolecules, 1985, 18, 1864–1868 CrossRef CAS.
  5. S. T. Milner, T. A. Witten and M. E. Cates, Macromolecules, 1989, 22, 853–861 CrossRef CAS.
  6. C. Burger, W. Ruland and A. N. Semenov, Macromolecules, 1990, 23, 3339–3346 CrossRef CAS.
  7. G. H. Fredrickson and S. W. Sides, Macromolecules, 2003, 36, 5415–5423 CrossRef CAS.
  8. S. W. Sides and G. H. Fredrickson, J. Chem. Phys., 2004, 121, 4974–4986 CrossRef CAS PubMed.
  9. N. A. Lynd and M. A. Hillmyer, Macromolecules, 2005, 38, 8803–8810 CrossRef CAS.
  10. D. M. Cooke and A. C. Shi, Macromolecules, 2006, 39, 6661–6671 CrossRef CAS.
  11. M. W. Matsen, Eur. Phys. J. E: Soft Matter Biol. Phys., 2006, 21, 199–207 CrossRef CAS PubMed.
  12. M. W. Matsen, Phys. Rev. Lett., 2007, 99, 148304 CrossRef CAS.
  13. N. A. Lynd and M. A. Hillmyer, Macromolecules, 2007, 40, 8050–8055 CrossRef CAS.
  14. N. A. Lynd, A. J. Meuler and M. A. Hillmyer, Prog. Polym. Sci., 2008, 33, 875–893 CrossRef CAS PubMed.
  15. W. Sriprom, M. James, S. Perrier and N. Chiara, Macromolecules, 2009, 42, 3138–3146 CrossRef CAS.
  16. T. M. Beardsley and M. W. Matsen, Eur. Phys. J. E: Soft Matter Biol. Phys., 2010, 32, 255–264 CrossRef CAS PubMed.
  17. J. M. Widin, A. K. Schmitt, K. Im, A. L. Schmitt and M. K. Mahanthappa, Macromolecules, 2010, 43, 7913–7915 CrossRef CAS.
  18. T. M. Beardsley and M. W. Matsen, Macromolecules, 2011, 44, 6209–6219 CrossRef CAS.
  19. J. M. Widin, A. K. Schmitt, A. L. Schmitt, K. Im and M. K. Mahanthappa, J. Am. Chem. Soc., 2012, 134, 3834–3844 CrossRef CAS PubMed.
  20. A. L. Schmitt, M. H. Repollet-Pedrosa and M. K. Mahanthappa, ACS Macro Lett., 2012, 1, 300–304 CrossRef CAS.
  21. A. L. Schmitt and M. K. Mahanthappa, Soft Matter, 2012, 8, 2294–2303 RSC.
  22. J. M. Widin, M. Kim, A. K. Schmitt, E. Han, P. Gopalan and M. K. Mahanthappa, Macromolecules, 2013, 46, 4472–4480 CrossRef CAS.
  23. Y. Li, H. J. Qian, Z. Y. Lu and A. C. Shi, J. Chem. Phys., 2013, 139, 096101 CrossRef PubMed.
  24. M. W. Matsen, Eur. Phys. J. E: Soft Matter Biol. Phys., 2013, 36, 36–44 CrossRef PubMed.
  25. Y. Li, H. J. Qian and Z. Y. Lu, Polymer, 2013, 54, 3716–3722 CrossRef CAS PubMed.
  26. M. Doi and S. F. Edwards, The Theory of Polymer Dynamics, Clarendon Press, Oxford, 1986 Search PubMed.
  27. G. H. Fredrickson, V. Ganesan and F. Drolet, Macromolecules, 2002, 35, 16–39 CrossRef CAS.
  28. G. Fredrickson, The Equilibrium Theory of Inhomogeneous Polymers, Clarendon Press, Oxford, 2006 Search PubMed.
  29. G. H. Fredrickson, Macromolecules, 1987, 20, 2535–2542 CrossRef CAS.
  30. M. S. Turner, Phys. Rev. Lett., 1992, 69, 1788–1791 CrossRef CAS.
  31. P. Mansky, Y. Liu, E. Huang, T. Russell and C. Hawker, Science, 1997, 275, 1458–1460 CrossRef CAS.
  32. M. Fasolka, P. Banerjee, A. Mays, G. Pickett and A. Balazs, Macromolecules, 2000, 33, 5702–5712 CrossRef CAS.
  33. H. Kim, S. Park and W. Hinsberg, Chem. Rev., 2010, 110, 146–177 CrossRef CAS PubMed.
  34. C. M. Bates, M. J. Maher, D. Janes, C. J. Ellison and C. G. Wilson, Macromolecules, 2013, 47, 2–12 CrossRef.
  35. E. Soto-Cantu, B. Lokitz, J. P. Hinestrosa, C. Deodhar, J. Messman, J. F. Ankner and S. M. Kilbey, Langmuir, 2011, 27, 5986–5996 CrossRef CAS PubMed.
  36. B. S. Lokitz, J. F. Wei, J. P. Hinestrosa, I. Ivanov, J. F. Browning, J. F. Ankner, S. M. Kilbey and J. M. Messman, Macromolecules, 2012, 45, 6438–6449 CrossRef CAS.
  37. R. R. Hansen, J. P. Hinestrosa, K. R. Shubert, J. L. Morrell-Falvey, D. A. Pelletier, J. Messman, S. M. Kilbey, B. Lokitz and S. T. Retterer, Biomacromolecules, 2013, 14, 3742–3748 CrossRef CAS PubMed.
  38. L. G. Parratt, Phys. Rev., 1954, 95, 359–369 CrossRef.
  39. S. K. Sinha, E. B. Sirota, S. Garoff and H. B. Stanley, Phys. Rev. B: Condens. Matter Mater. Phys., 1988, 38, 2297–2311 CrossRef.
  40. T. P. Russell, A. Karim, A. Mansour and G. P. Felcher, Macromolecules, 1988, 21, 1890–1893 CrossRef CAS.
  41. S. H. Anastasiadis, T. P. Russell, S. K. Satija and C. F. Majkrzak, Phys. Rev. Lett., 1989, 62, 1852–1855 CrossRef CAS.
  42. S. H. Anastasiadis, T. P. Russell, S. K. Satija and C. F. Majkrzak, J. Chem. Phys., 1990, 92, 5677–5691 CrossRef CAS PubMed.
  43. A. Menelle, T. P. Russell, S. H. Anastasiadis, S. K. Satija and C. F. Majkrzak, Phys. Rev. Lett., 1992, 68, 67–70 CrossRef CAS.
  44. X. L. Zhou and S. H. Chen, Phys. Rep., 1995, 257, 223–348 CrossRef CAS.
  45. J. W. Mays, R. Kumar, S. W. Sides, M. Goswami, B. G. Sumpter, K. L. Hong, X. D. Wu, T. P. Russell, S. P. Gido, A. Avgeropoulos, T. Tsoukatos, N. Hadjichristidis and F. L. Beyer, Polymer, 2012, 53, 5155–5162 CrossRef CAS PubMed.
  46. R. Kumar, S. W. Sides, M. Goswami, B. G. Sumpter, K. L. Hong, X. D. Wu, T. P. Russell, S. P. Gido, K. Misichronis, S. Rangou, A. Avgeropoulos, T. Tsoukatos, N. Hadjichristidis, F. L. Beyer and J. W. Mays, Langmuir, 2013, 29, 1995–2006 CrossRef CAS PubMed.
  47. J. K. Zhao, C. Y. Gao and D. Liu, J. Appl. Crystallogr., 2010, 43, 1068–1077 CrossRef CAS.
  48. Mantid (2013), Manipulation and Analysis Toolkit for Instrument Data, Mantid Project, 2013,  DOI:10.5286/software/mantid.
  49. G. H. Fredrickson and J. P. Donley, J. Chem. Phys., 1992, 97, 8941–8946 CrossRef CAS PubMed.

Footnote

Electronic supplementary information (ESI) available: Details of SCFT and the algorithm used to solve non-linear equations. Relevant details about the extraction of masking functions from NR profiles and analytical WSL theory. See DOI: 10.1039/c5ra00974j

This journal is © The Royal Society of Chemistry 2015