
Pure carbon nanodots for excellent photocatalytic hydrogen generation†
Pengju Yangab,
Jianghong Zhao*a,
Jian Wangab,
Huijuan Cuiab,
Li Lia and
Zhenping Zhu*a
aState Key Laboratory of Coal Conversion, Institute of Coal Chemistry, Chinese Academy of Sciences, Taiyuan, 030001, P. R. China. E-mail: zjh_sx@sxicc.ac.cn; zpzhu@sxicc.ac.cn
bUniversity of Chinese Academy of Sciences, Beijing, 100039, P. R. China
First published on 17th February 2015
Abstract
Pure carbon nanodots (CNDs) without any modification and co-catalyst can drive photocatalytic hydrogen generation. The hydrogen generation rate of CNDs reaches 3615.3 μmol g−1 h−1 when methanol was used as the sacrificial donor, which is 34.8 times higher than that of commercial Degussa P25 photocatalyst under the same conditions. Moreover, the CNDs show good stability; the hydrogen generation rate has negligible change even after four cycles of testing.
Over the past decades, light-driven H2 production has attracted increasing attention because of its capability to harvest solar energy and convert it into chemical energy. To date, a number of photocatalysts, including Ti-based, Ta-based, Zr-based, Nb-based, Ge-based, Ga-based, S-based and Z-scheme photocatalysts, have been developed.1 However, only a few photocatalysts show high photocatalytic activity and stability.1,2 Generally, co-catalysts such as noble metal Pt, are often needed to improve photocatalytic performance.3 However, the high cost and low storage of the noble metal limit its practical application. Therefore, developing cheap but efficient photocatalysts is still urgent.
In recent years, carbon nanodots (CNDs) have attracted much interest because of their non-toxic, stable, abundant, and inexpensive nature.4,5 CNDs have exhibited potential application in sensing, optoelectronic, and energy conversion. Specifically, CNDs as photocatalyst have also been explored.6–8 Hu reported that CNDs have high photocatalytic activity and decomposes methylene blue under visible light irradation.9,10 Sun and his coworkers have observed that surface-functionalized CNDs, with Au or Pt, can be employed as photocatalyst for CO2 reduction and hydrogen production.11,12 Very recently, Teng has found that nitrogen-doped graphene oxide quantum dots achieved overall water splitting in acid aqueous solution (pH = 3) under visible light irradation.13
Although some progress has been achieved, the study of CNDs photocatalyst is still in its infant stage. In addition, the modification of noble metals on CNDs and the acidic environment of water-splitting reaction limit its practical application and also influence the basic understand of CNDs intrinsic photocatalytic properties. To our knowledge, no research reports that pure CNDs without any modification can drive water-splitting reaction. Here, CNDs were prepared via the ultrasonic-hydrothermal process, and their intrinsic photocatalytic activity was studied. Results show that the pure CNDs show high hydrogen production in pure water under UV light irradiation, even without any modification and co-catalyst. The hydrogen evolution rate of CNDs is up to 423.7 μmol g−1 h−1 in pure water. The hydrogen evolution rate of CNDs was further improved to 3615.3 μmol g−1 h−1 when methanol was used as the sacrificial reagent, which is 34.8 times higher than that of commercial Degussa P25 photocatalyst at same condition. Moreover, the CNDs photocatalyst show good stability.
The transmission electron microscopy (TEM) images of the CNDs, as shown in Fig. 1a, which shows that the CNDs are spherical particles with diameters distributed in the range of 1.5 nm to 5 nm. The average diameter was about 3.4 nm, which was obtained through a statistical analysis of 200 nanoparticles (shown in the inset of Fig. 1a). High-resolution TEM (HRTEM) image (Fig. 1b) shows that their lattice spacing is 0.21 nm, which corresponds to the (0 to 110) facet of graphite.14 In addition, it is clearly seen that there exists partial amorphous structure on the edge of CNDs. HRTEM image indicates that the co-existence of sp2 and sp3 hybridized carbon in the CNDs.
 | ||
| Fig. 1 (a) TEM (inset is the size distribution of the CNDs) and (b) HRTEM images of the CNDs. | ||
Raman spectrum of the CNDs (Fig. 2a) shows that the D, G bands of the CNDs are all visible. The G and D bands are attributed to the in-plane vibrations of sp2 carbon atoms and disordered amorphous carbon atoms, respectively.15 The relative intensity of the G to D band (ID/IG) in CNDs was used to characterize the level of disorder in graphitic carbons, and the calculated relative intensity for the prepared CNDs was 0.47, which is smaller than previous literature.16,17 These results confirmed the well-crystallized sp2 core and the partial amorphous edge nature of CNDs, which was consistent with the HRTEM characterizations. A typical UV-visible absorption spectrum of CNDs is shown in Fig. 2b. Its common feature is the spectral line that has two main absorption regions. The adsorption region from 200 nm to 270 nm is attributed to the π–π* transitions of aromatic sp2 domains in CNDs, whereas the shoulder peak above 270 nm is due to the n–π* transitions of C![[double bond, length as m-dash]](https://www.rsc.org/images/entities/char_e001.gif) O in the sp3 hybrid regions.18 The photoluminescence (PL) emission spectra of CNDs are shown in Fig. S1.† The main PL emission peaks were located at about 450 nm, and the intensity of PL emission depended on the excitation wavelengths, which was similar to previous reports.19–21 The PL quantum yield of CNDs (excitation at 320 nm) using Rhodamine B as a reference is 2.42%, comparable with those of the reported luminescent CNDs.22,23
O in the sp3 hybrid regions.18 The photoluminescence (PL) emission spectra of CNDs are shown in Fig. S1.† The main PL emission peaks were located at about 450 nm, and the intensity of PL emission depended on the excitation wavelengths, which was similar to previous reports.19–21 The PL quantum yield of CNDs (excitation at 320 nm) using Rhodamine B as a reference is 2.42%, comparable with those of the reported luminescent CNDs.22,23
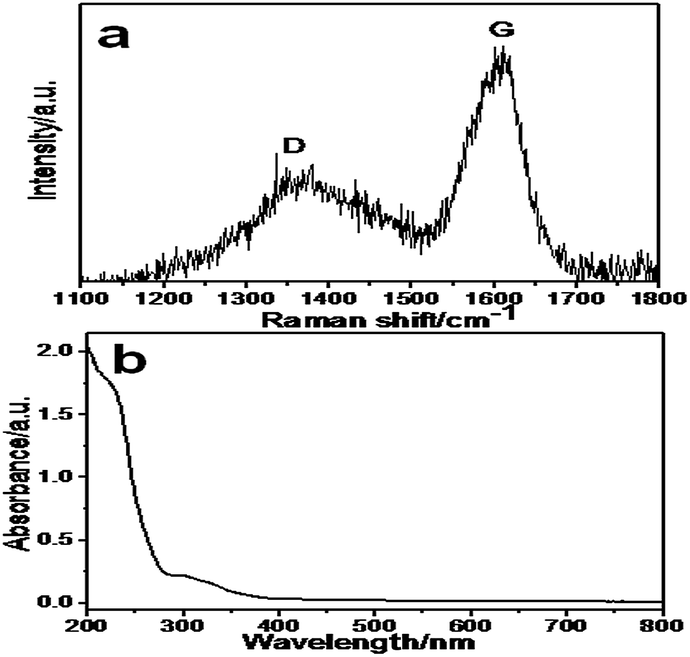 | ||
| Fig. 2 (a) Raman and (b) UV-vis adsorption spectrum of the CNDs. | ||
The structure and component of the CNDs were characterized by X-ray photoelectron spectroscopy (XPS) and Fourier transform infrared spectroscopy (FTIR). Two dominant peaks at 284.8 eV and 532.2 eV of the XPS survey spectrum depicted in Fig. S2,† were attributed to C1s, and O1s, suggesting the existence of carbon and oxygen elements.24 The C1s XPS peak can be deconvoluted into five Gaussian components centered at 284.5, 285.5, 286.6, 287.2 and 288.6 eV (Fig. 3a), which can be assigned to CC, C–C/C–H, C–OH, C–O–C and CO species, respectively.25 The high-resolution O1s spectrum (Fig. S3†) reveals the presence of three peaks corresponding to CO groups (531 eV), C–OH and/or C–O–C groups (532.2 eV) and carboxyl groups (533.8 eV).24,26 The FTIR spectra can be used to determine the functional groups present on the surfaces of CNDs. As shown in Fig. 3b, the peak at 1638 cm−1 is attributed to CC vibration, and the peak at 1720 cm−1 is attributed to CO vibration. A broad absorption peak associated with OH vibration is observed within 3000 cm−1 to 3600 cm−1, and the peaks within 1000 cm−1 to 300 cm−1 are attributed to the C–OH stretching and O–H bending vibrations.27 The XPS and FTIR results indicate that the CNDs contain a lot of oxygen-containing groups, which help CNDs to be well dispersed in water.
 | ||
| Fig. 3 (a) C1s XPS and (b) FTIR spectrum of the CNDs. | ||
Photocatalytic water-splitting reactions were performed in pure water without any other sacrificial agent (Fig. 4a). It is clear to see that the amount of hydrogen (red line) increased with reaction duration time. Gas chromatography (GC) is a useful analytical tool to investigate H2 production. Fig. S4† gives the gas chromatography spectrum of gaseous product, which confirms H2 evolution. The hydrogen production rate of the CNDs reached 423.7 μmol g−1 h−1 in pure water. To further improve the hydrogen evolution ability, methanol was employed as the holes sacrificial donor. The rate of hydrogen evolution (black line) significantly increased, reaching 3615.3 μmol g−1 h−1. Photocatalytic water-splitting reactions were also studied without CNDs or light irradiation at same condition. Data show that no hydrogen was detected, which indicates that hydrogen comes from photocatalytic process. The stability of the CNDs was also tested (Fig. 4b). The hydrogen evolution rate had negligible changes even after four cycles of testing, confirming good photo-stability. The photocatalytic water-splitting reaction was also carried out under visible light irradiation, but hydrogen was not detected, which is different from previous reports.11,13 From the UV-vis adsorption spectrum of CNDs, the intensity in visible light region is weak, which is likely responsible for the obtained results. For the carbon nanomaterials, it is also widely approved that the size of carbon-based materials can determine their energy gap.28 Some theoretical calculations and experiments have proven that the energy gap of small sp2 cluster came from the quantum-sized graphite fragment.28–31 As the size of the cluster decreases, the gap increases gradually.30 In the present work, HRTEM image shows that CNDs contain small sp2 clusters. Therefore, it would be rational to speculate that the photocatalytic activity of CNDs comes from quantum size effect. Linear potential scans were conducted to determine and analyze the conduction band (CB) of CNDs.32 Fig. S5† shows that the CB of CNDs is −0.906 eV (versus NHE), which satisfies the thermodynamic potentials for hydrogen evolution, consistent with experimental results. We plotted the square and square root of the absorption energy against the photon energy to determine the energies of the direct and indirect gaps, respectively.33 It is clearly seen that the energy gap (Eg) value of CNDs is 4.88 eV for direct transition, whereas the Eg value of CNDs is 2.97 eV for indirect transition (Fig. S6 and S7†). However, indirect bandgap transition is inconsistent with experimental results, which suggest the CNDs is direct bandgap transition. Therefore the valance band (VB) value is 3.974 eV (4.88 − 0.906 = 3.974 eV). In addition, we also investigated the photocurrent generation of CNDs (Fig. S8†) at different bias voltages. The CNDs are indeed able to generate significant photocurrents under UV irradiation, consistent with photocatalytic results. At same time, the photocatalytic performance of commercial Degussa P25 without noble metal modification was also studied at same condition (Fig. S9†). Results show that the hydrogen generation rate of commercial Degussa P25 without co-catalyst is 16.25 μmol g−1 h−1 in pure water. When methanol was added as the holes sacrificial donor, the hydrogen generation rate only reached 103.7 μmol g−1 h−1. It is clearly seen that the hydrogen generation rate of CNDs surpasses that of P25 by more 34.8 times in methanol aqueous solution. We also prepared CNDs/P25 composite photocatalyst by simple physical adsorption. Result shows that the hydrogen evolution rate of CNDs/P25 is up to 242.72 μmol g−1 h−1 in methanol aqueous solution (Fig. S9†). Compared with CNDs, the activity of CNDs/P25 is relatively low, which may was attributed to low adsorption amount. When Pt cocatalyst was loaded on CNDs, the photocatalytic activity was further improved. The hydrogen evolution rate of Pt/CNDs reaches 14.2 mmol g−1 h−1, whereas the hydrogen evolution rate of Pt/P25 is 7.46 mmol g−1 h−1 in methanol aqueous solution (Fig. S10†). Fig. S11† shows the UV-visible adsorption spectrum of P25. The adsorption edge is about 400 nm, consistent with other reports.34 Previous studies confirmed that the CB and VB positions of P25 are about −0.19 eV and 2.81 eV, respectively.34 It is clear to see that the CB position of CNDs is more negative than that of P25, suggesting high reduction ability of CNDs.35 The VB position of CNDs is relatively positive, which indicates strong oxidation potential. Therefore, the excellent photocatalytic activity of CNDs may be due to big band gap, strong reduction and oxidation potential.35 It is widely accepted that the lower the PL intensity of photocatalysts, indicates that the lower the recombination rate of photo-induced electron–hole pairs, and the higher the photocatalytic activity.36 In our study, the PL quantum yield of CNDs is very low (2.42%), which suggests photo-generated electrons in CNDs mostly participated in the channel of photocatalysis. Therefore, the CNDs show high photocatalytic activity.
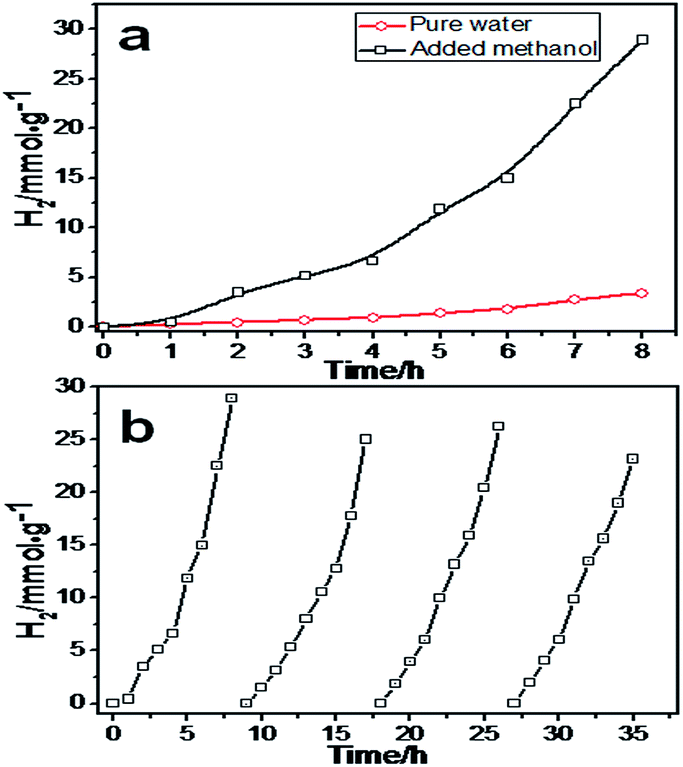 | ||
| Fig. 4 (a) Photocatalytic hydrogen evolution of the CNDs in pure water and in methanol aqueous solution (20 vol%), (b) stability of photocatalytic hydrogen evolution of the CNDs. | ||
Conclusions
In summary, the photocatalytic activity of pure CNDs was studied. The results show that pure CNDs alone achieve water splitting and have good stability. The hydrogen generation rate of pure CNDs highly reaches 3615.3 μmol g−1 h−1. Despite its preliminary character, this study can clearly indicate that pure CNDs without co-catalyst and any modification can as an excellent photocatalyst to drive hydrogen generation. This finding provides that sustainable pure carbon materials can be as versatile materials used in the modern field of renewable energy.Acknowledgements
We acknowledge the financial support from Nature Science Foundation of China (no. 21173250), Knowledge Innovation Project of Chinese Academy of Sciences (no. KGCX2-EW-311), Youth Innovation Foundation of Institute of Coal Chemistry, and Chinese Academy of Sciences (2011SQNRC19).Notes and references
- J. Xing, W. Q. Fang, H. J. Zhao and H. G. Yang, Chem.–Asian J., 2012, 7, 642 CrossRef CAS PubMed.
- Y. Ma, X. Wang, Y. Jia, X. Chen, H. Han and C. Li, Chem. Rev., 2014, 114, 9987 CrossRef CAS PubMed.
- J. Yang, D. Wang, H. Han and C. Li, Acc. Chem. Res., 2013, 46, 1900 CrossRef CAS PubMed.
- S. N. Baker and G. A. Baker, Angew. Chem., Int. Ed., 2010, 49, 6726 CrossRef CAS PubMed.
- Q. Liang, W. Ma, Y. Shi, Z. Li and X. Yang, Carbon, 2013, 60, 421 CrossRef CAS PubMed.
- S. Zhu, S. Tang, J. Zhang and B. Yang, Chem. Commun., 2012, 48, 4527 RSC.
- Z. Zhang, J. Zhang, N. Chen and L. Qu, Energy Environ. Sci., 2012, 5, 8869 CAS.
- P. G. Luo, S. Sahu, S.-T. Yang, S. K. Sonkar, J. Wang, H. Wang, G. E. LeCroy, L. Cao and Y.-P. Sun, J. Mater. Chem. B, 2013, 1, 2116 RSC.
- S. Hu, R. Tian, L. Wu, Q. Zhao, J. Yang, J. Liu and S. Cao, Chem.–Asian J., 2013, 8, 1035 CrossRef CAS PubMed.
- S. Hu, R. Tian, Y. Dong, J. Yang, J. Liu and Q. Chang, Nanoscale, 2013, 5, 11665 RSC.
- L. Cao, S. Sahu, P. Anilkumar, C. E. Bunker, J. Xu, K. A. S. Fernando, P. Wang, E. A. Guliants, K. N. Tackett II and Y.-P. Sun, J. Am. Chem. Soc., 2011, 133, 4754 CrossRef CAS PubMed.
- S. Sahu, Y. M. Liu, P. Wang, C. E. Bunker, K. A. S. Fernando, W. K. Lewis, E. A. Guliants, F. Yang, J. P. Wang and Y. P. Sun, Langmuir, 2014, 30, 8631 CrossRef CAS PubMed.
- T.-F. Yeh, C.-Y. Teng, S.-J. Chen and H. Teng, Adv. Mater., 2014, 26, 3297 CrossRef CAS PubMed.
- D. Y. Pan, L. Guo, J. C. Zhang, C. Xi, Q. Xue, H. Huang, J. H. Li, Z. W. Zhang, W. J. Yu, Z. W. Chen, Z. Li and M. H. Wu, J. Mater. Chem., 2012, 22, 3314 RSC.
- A. C. Ferrari and D. M. Basko, Nat. Nanotechnol., 2013, 8, 235 CrossRef CAS PubMed.
- D. Pan, L. Guo, J. Zhang, C. Xi, Q. Xue, H. Huang, J. Li, Z. Zhang, W. Yu, Z. Chen, Z. Li and M. Wu, J. Mater. Chem., 2012, 22, 3314 RSC.
- Y. Shin, J. Lee, J. Yang, J. Park, K. Lee, S. Kim, Y. Park and H. Lee, Small, 2014, 10, 866 CrossRef CAS.
- D. Kozawa, Y. Miyauchi, S. Mouri and K. Matsuda, J. Phys. Chem. Lett., 2013, 4, 2035 CrossRef CAS.
- H. Zhu, X. Wang, Y. Li, Z. Wang, F. Yang and X. Yang, Chem. Commun., 2009, 5118, 10.1039/b907612c.
- H. Peng and J. Travas-Sejdic, Chem. Mater., 2009, 21, 5563 CrossRef CAS.
- W. Kwon and S.-W. Rhee, Chem. Commun., 2012, 48, 5256 RSC.
- H. P. Liu, T. Ye and C. D. Mao, Angew. Chem., Int. Ed., 2007, 46, 6473 CrossRef CAS PubMed.
- C. Zhu, J. Zhai and S. Dong, Chem. Commun., 2012, 48, 9367 RSC.
- J. Ryu, Y.-W. Suh, D. J. Suh and D. J. Ahn, Carbon, 2010, 48, 1990 CrossRef CAS PubMed.
- L. Tang, R. Ji, X. Cao, J. Lin, H. Jiang, X. Li, K. S. Teng, C. M. Luk, S. Zeng, J. Hao and S. P. Lau, ACS Nano, 2012, 6, 5102 CrossRef CAS PubMed.
- K. Laszlo, E. Tombacz and K. Josepovits, Carbon, 2001, 39, 1217 CrossRef CAS.
- X. M. Sun and Y. D. Li, Angew. Chem., Int. Ed., 2004, 43, 597 CrossRef PubMed.
- R. Q. Zhang, E. Bertran and S. T. Lee, Diamond Relat. Mater., 1998, 7, 1663 CrossRef CAS.
- M. Lonfat, B. Marsen and K. Sattler, Chem. Phys. Lett., 1999, 313, 539 CrossRef CAS.
- H. Li, X. He, Z. Kang, H. Huang, Y. Liu, J. Liu, S. Lian, C. H. A. Tsang, X. Yang and S.-T. Lee, Angew. Chem., Int. Ed., 2010, 49, 4430 CrossRef CAS PubMed.
- D. M. Jang, Y. Myung, H. S. Im, Y. S. Seo, Y. J. Cho, C. W. Lee, J. Park, A.-Y. Jee and M. Lee, Chem. Commun., 2012, 48, 696 RSC.
- T.-F. Yeh, F.-F. Chan, C.-T. Hsieh and H. Teng, J. Phys. Chem. C, 2011, 115, 22587 CAS.
- L. Chen, Q. Zhang, R. Huang, S.-F. Yin, S.-L. Luo and C.-T. Au, Dalton Trans., 2012, 41, 9513 RSC.
- F. Dong, Y. Sun and M. Fu, Int. J. Photoenergy, 2012 DOI:10.1155/2012/569716.
- M. Ni, M. K. H. Leung, D. Y. C. Leung and K. Sumathy, Renewable Sustainable Energy Rev., 2007, 11, 401 CrossRef CAS PubMed.
- L. Q. Jing, Y. C. Qu, B. Q. Wang, S. D. Li, B. J. Jiang, L. B. Yang, W. Fu, H. G. Fu and J. Z. Sun, Sol. Energy Mater. Sol. Cells, 2006, 90, 1773 CrossRef CAS PubMed.
Footnote |
| † Electronic supplementary information (ESI) available. See DOI: 10.1039/c5ra01924a |
| This journal is © The Royal Society of Chemistry 2015 |