Improved antifouling property of PVDF membranes by incorporating an amphiphilic block-like copolymer for oil/water emulsion separation
Yuan
Liu
ab,
Yanlei
Su
ab,
Yafei
Li
ab,
Xueting
Zhao
ab and
Zhongyi
Jiang
*ab
aKey Laboratory for Green Chemical Technology, School of Chemical Engineering and Technology, Tianjin University, Tianjin 300072, China. E-mail: zhyjiang@tju.edu.cn; Fax: +86-22-27406646; Tel: +86-22-27406646
bCollaborative Innovation Center of Chemical Science and Engineering (Tianjin), Tianjin University, Tianjin 300072, China
First published on 12th February 2015
Abstract
An amphiphilic block-like copolymer bearing hydrophobic poly(butyl methacrylate) (PBMA), hydrophilic poly(poly(ethylene glycol) methyl ether methacrylate) (PEGMA) and low surface energy poly(hexafluorobutyl methacrylate) (PHFBM) segments was synthesized by free radical polymerization. The copolymer was then used as an additive to fabricate antifouling polyvinylidene difluoride (PVDF) membranes by the non-solvent induced phase separation (NIPS) method. During the membrane preparation process, the low surface energy PHFBM segments were dragged to the membrane surfaces by the surface segregated hydrophilic PEGMA segments. The presence of the PHFBM segments on the membrane surfaces significantly enhanced the antifouling property of the PVDF membranes during oil/water emulsion filtration. The total flux decline (Rt) was drastically decreased to 10.6% and the flux recovery ratio (FRR) was 99.4%. In addition, the influences of different operating conditions (including agitating speed, operating pressure and oil concentration) on the antifouling property were extensively investigated. The fluxes were nearly completely recovered after simple hydraulic cleaning even under a low agitating speed, high operating pressure and high oil concentration.
1. Introduction
The large amount of oily wastewater originated from many industries, such as petrochemical, metallurgical, pharmaceutical and food processing, is considered as one of the most serious pollutant sources due to its severe and damaging effects on health and the environment.1–4 The conventional equipment and techniques including oil skimmer, centrifugal coalescer and floatation can effectively remove free oil from oily wastewater, but are inefficient in the treatment of oil/water emulsions (the size of an emulsion droplet is less than 20 µm).1,2 Membrane technology has proved to be an effective separation method to handle oil/water emulsions with the advantages of high separation efficiency, low energy cost, and less chemical addition.5 However, membrane fouling induced by the deposition and adsorption of oil foulants, which can lead to a severe flux decline and an increase of operating costs, limits its practical applications.6 Therefore, developing strategies for membrane fouling control is essential to broaden the application of membrane technology in oil/water emulsion treatment.Generally speaking, the fabrication of antifouling membranes and the exploitation of optimal operating conditions are two popular approaches to enhance the membrane separation performance.7–10 Many efforts have been devoted to prepare antifouling membranes by coating, grafting, surface segregation and other methods.11 Among these methods, surface segregation, as an in situ and three-dimensional modification, can generate more efficacious antifouling polymer brushes on the membrane surface.12 Surface segregation is classified as free and forced surface segregation: (1) free surface segregation is used to construct hydrophilic membrane surfaces by blending an amphiphilic copolymer consisting of hydrophilic and hydrophobic segments into the membrane casting solutions.13,14 The enrichment of hydrophilic segments on the membrane surface can effectively enhance their fouling-resistant property against bio-foulants and natural organic matter (NOM), but can not perfectly prevent the formation of oil-fouling layers due to the continuous coalescence, spreading and migration of oil droplets during filtration;15,16 (2) forced surface segregation is aimed at introducing low surface energy segments on the hydrophilic membrane surfaces which can reduce the interaction between oil foulants and membrane surfaces to facilitate the removal of foulants under moderate shear force.4,17,18 The low surface energy segments are grafted at the ends of the hydrophilic segments of the amphiphilic copolymers, which are dragged toward the membrane surfaces accompanied by the free migration of the hydrophilic segments toward the polymer/water interface. Thus, the amphiphilic surfaces with a mixed structure of hydrophilic and low surface energy microdomains are obtained, exhibiting both fouling-resistant and fouling-release properties. In addition, operating conditions, such as pressure, agitating speed, concentration, pH, ionic strength etc., have been proven to considerably affect membrane fouling.8,9 To date, few research works have been concerned with the influences of operating conditions on the antifouling property of amphiphilic membrane surfaces.
In this study, novel antifouling membranes for oil/water emulsion separation were fabricated by blending polyvinylidene difluoride (PVDF) with the amphiphilic block-like copolymer PBMA–PEGMA–PHFBM via a non-solvent induced phase separation (NIPS) method. The enrichment of hydrophilic PEGMA segments due to free surface segregation and low surface energy PHFBM segments due to forced surface segregation was achieved on the membrane surfaces in one step and confirmed by X-ray photoelectron spectroscopy (XPS). The hydrophilicity, oleophobicity and surface free energy were evaluated by contact angle measurements. The systematic experiments under different operating conditions (agitating speed, operating pressure and oil concentration) were carried out to study the influences on the antifouling properties of the amphiphilic membrane surfaces. Under appropriate operating conditions, the prepared amphiphilic PVDF membranes exhibited excellent antifouling property during oil/water emulsion separation.
2. Experimental section
2.1. Materials
PVDF (FR-904, Mn = 380![[thin space (1/6-em)]](https://www.rsc.org/images/entities/char_2009.gif) 000) was purchased from Shanghai 3F New Material Co. Ltd. (China) and dried at 110 °C for 12 h prior to use. Poly(ethylene glycol) methyl ether methacrylate (PEGMA, Mn = 475) and sodium dodecylsulfate (SDS) were purchased from Sigma-Aldrich Co. (USA). Hexafluorobutyl methacrylate (HFBM) provided by XEOGIA Fluorine-Silicon Chemical Co. Ltd. (China) was washed with 5 wt% NaOH solution, dried with CaH2, and then vacuum-distilled before polymerization. High-speed vacuum pump oil (GS-1) with a density of 807 kg m−3 and an average viscosity of 100 Pa s at room temperature was supplied by Beijing Sifang Special Oil Company (China). Other chemical reagents consisting of butyl methacrylate (BMA), poly(ethylene glycol) (PEG) (Mw = 2000), azobisisbutyronitrile (AIBN) and N-methyl-2-pyrrolidone (NMP) were received from Kewei Chemical Reagent Co. (China) and used without further purification. Reverse osmosis water was used throughout the experiments. The oil/water emulsion was obtained by mixing high-speed vacuum pump oil (GS-1), surfactant (SDS) and water.
000) was purchased from Shanghai 3F New Material Co. Ltd. (China) and dried at 110 °C for 12 h prior to use. Poly(ethylene glycol) methyl ether methacrylate (PEGMA, Mn = 475) and sodium dodecylsulfate (SDS) were purchased from Sigma-Aldrich Co. (USA). Hexafluorobutyl methacrylate (HFBM) provided by XEOGIA Fluorine-Silicon Chemical Co. Ltd. (China) was washed with 5 wt% NaOH solution, dried with CaH2, and then vacuum-distilled before polymerization. High-speed vacuum pump oil (GS-1) with a density of 807 kg m−3 and an average viscosity of 100 Pa s at room temperature was supplied by Beijing Sifang Special Oil Company (China). Other chemical reagents consisting of butyl methacrylate (BMA), poly(ethylene glycol) (PEG) (Mw = 2000), azobisisbutyronitrile (AIBN) and N-methyl-2-pyrrolidone (NMP) were received from Kewei Chemical Reagent Co. (China) and used without further purification. Reverse osmosis water was used throughout the experiments. The oil/water emulsion was obtained by mixing high-speed vacuum pump oil (GS-1), surfactant (SDS) and water.
2.2. Preparation of the amphiphilic block-like copolymer
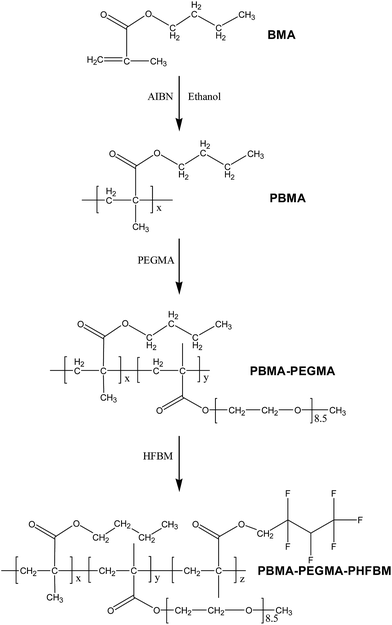
The amphiphilic block-like copolymer (PBMA–PEGMA–PHFBM) with hydrophobic poly(butyl methacrylate) (PBMA) as the backbone, and hydrophilic poly(poly(ethylene glycol) methyl ether methacrylate) (PEGMA) and low surface energy poly(hexafluorobutyl methacrylate) (PHFBM) as the side chains was synthesized through free radical polymerization. To acquire a block-like structure, BMA, PEGMA and HFBM monomers were sequentially placed into a round bottom flask equipped with a stirrer, a reflux condenser, and a nitrogen inlet. The detailed synthesis route for the amphiphilic block-like copolymer is illustrated in Scheme 1. Firstly, the monomer BMA (0.02 mol) was dissolved in 100 mL ethanol. After the elimination of oxygen by continuously bubbling nitrogen gas, the initiator of AIBN (0.001 mol) was added into the flask. The mixture was reacted for about 2 h and then the second monomer PEGMA (0.01 mol) was added into the flask. After reacting for about another 2 h, the third monomer HFBM (0.01 mol) was added into the mixture. Subsequently, the grafting polymerization lasted for about 6 h. The obtained copolymer solution was precipitated in petroleum ether. For further purification, the product was re-dissolved in ethanol and re-precipitated in petroleum ether three times. Finally, the desired copolymer was dried to a constant weight (50 °C for 24–48 h) in a vacuum oven. For comparison, the amphiphilic block-like copolymer PBMA–PEGMA was synthesized according to the above-mentioned procedure.The structures of the as-synthesized block-like copolymers were evaluated by Fourier transform infrared (FTIR) spectroscopy (Nicolet 560, Nicolet Co., USA) using the KBr pellet method with air as the background. The chemical compositions were determined by a 500 MHz 1H NMR (INVOA-500) instrument using deuterated chloroform as the solvent and tetramethylsilane as the internal standard. The number average molecular weights and molecular weight distributions were estimated by gel permeation chromatography (Agilent, Agilent Co., USA) based on a polystyrene standard substance.
2.3. Fabrication of the membranes
All the membranes were fabricated by the NIPS method. The membrane casting solutions were prepared by dissolving PVDF (12 wt%) and the synthesized copolymers (7.2 wt%) in NMP. The casting solutions were stirred for 4 h at 60 °C and left for another 4 h without stirring to ensure the complete release of bubbles. After cooling to room temperature, the solutions were cast on the surfaces of glass plates with a thickness of 240 µm using a steel knife. Subsequently, the glass plates were immersed in a coagulation bath of water. After peeling off from the glass plates, the membranes were rinsed thoroughly with water to remove the residual solvents. Then, the as-prepared membranes were kept in water prior to utilization and denoted as PVDF/PBMA–PEGMA and PVDF/PBMA–PEGMA–PHFBM. The control PVDF/PEG2000 membrane was prepared according to the above procedure.2.4. Membrane characterization
The cross-section and top surface morphologies of the fabricated membranes were observed by scanning electron microscopy (SEM) and field emission scanning electron microscopy (FESEM) with a Philips XL30E scanning microscope and a field emission scanning electron microscope (Nanosem 430), respectively. The membrane samples were fractured in liquid nitrogen and coated with gold before the SEM observation.The membrane porosity was investigated using the dry–wet weight method. The wet weight of the membrane was measured after wiping away the excess water. The dry weight of the membrane was measured after drying in a freezing dryer. The porosity of the membrane was calculated as follows:
 | (1) |
The membrane mean pore size rm (nm) was determined by the Guerout–Elford–Ferry equation:
 | (2) |
The surface compositions of the membranes were evaluated using an X-ray photoelectron spectroscope, which was equipped with Mg Kα at 1486.6 eV. The take-off angle of the photoelectron was set at 90°. Survey spectra of the membranes were collected over a range of 0–1100 eV.
The static contact angles of the membranes were evaluated using a contact angle goniometer (JC2000C Contact Angle Meter, Powereach Co., Shanghai, China). To minimize the experimental error, six measurements were performed on different locations of the membrane surfaces and an average value was calculated. Two polar liquids (water and glycerol) and one apolar liquid (diiodomethane) were used as the test liquids. The surface free energy (γ) was calculated using the three-liquid Lifshitz–van der Waals acid–base model and the equations are presented below:
 | (3) |
 | (4) |
2.5. Filtration experiments and antifouling property evaluations
A dead-end stirred cell filtration apparatus connected to a nitrogen gas cylinder and a solution reservoir was designed to perform the filtration experiments on oil/water emulsions. The volume capacity of the filtration cell (Model 8200, Millipore Co., USA) was 200 mL and the effective membrane area was fixed at 28.7 cm2. The operating pressure in the system was maintained by nitrogen gas. The membrane sample was fixed on the filtration cell, and then the reservoir and cell were filled with reverse osmosis water. Each membrane was pre-pressured under 0.10 MPa to obtain a steady flux. Then the operating pressure was set to certain values (0.03, 0.05, 0.10 and 0.15 MPa). The pure water flux Jw1 (L m−2 h−1) was calculated according to the following equation: | (5) |
 | (6) |
The filtration experiments were carried out at certain agitating speeds (0, 100, 200 and 300 rpm). At the agitating speeds of 100, 200 and 300 rpm, the Reynolds number (Re) was about 2.9 × 10⁴, 5.8 × 10⁴ and 8.7 × 10⁴, meaning that turbulent flow occurred. The corresponding average agitation shear rates (g) were calculated by the empirical equation assuming that the feed solution was a Newtonian fluid19 and the calculated values were about 15.4, 43.7, and 80.2 s−1, respectively.
After filtration of the oil/water emulsion, the membranes were cleaned with reverse osmosis water for 30 min under magnetic stirring, then the pure water flux Jw2 (L m−2 h−1) of the cleaned membranes was measured again. To assess the antifouling property of the membranes, several ratios including the flux recovery ratio (FRR), total flux decline ratio (Rt), reversible flux decline ratio (Rr) and irreversible flux decline ratio (Rir) were defined and calculated according to the following expressions:
 | (7) |
 | (8) |
 | (9) |
 | (10) |
Obviously, Rt was the sum of Rr and Rir. A high value of FRR and a low value of Rt indicated a better antifouling property of the membranes.
3. Results and discussion
3.1. Characterization of the amphiphilic block-like copolymers
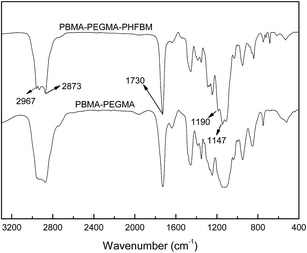
The amphiphilic block-like copolymers were prepared by free radical polymerization using AIBN as initiator in ethanol solution. The FTIR spectra of the PBMA–PEGMA and PBMA–PEGMA–PHFBM copolymers are shown in Fig. 1. The peaks at about 2873 and 2967 cm−1 were attributed to the C–H bond in both the PBMA–PEGMA and PBMA–PEGMA–PHFBM copolymers. The peak at 1730 cm−1 belonged to the C![[double bond, length as m-dash]](https://www.rsc.org/images/entities/char_e001.gif) O stretching vibration in both the PBMA–PEGMA and PBMA–PEGMA–PHFBM copolymers. New peaks were observed at about 1190 and 1147 cm−1 in the FTIR spectrum of the PBMA–PEGMA–PHFBM copolymer, which were related to the CFx stretching mode of the HFBM segments.
O stretching vibration in both the PBMA–PEGMA and PBMA–PEGMA–PHFBM copolymers. New peaks were observed at about 1190 and 1147 cm−1 in the FTIR spectrum of the PBMA–PEGMA–PHFBM copolymer, which were related to the CFx stretching mode of the HFBM segments.
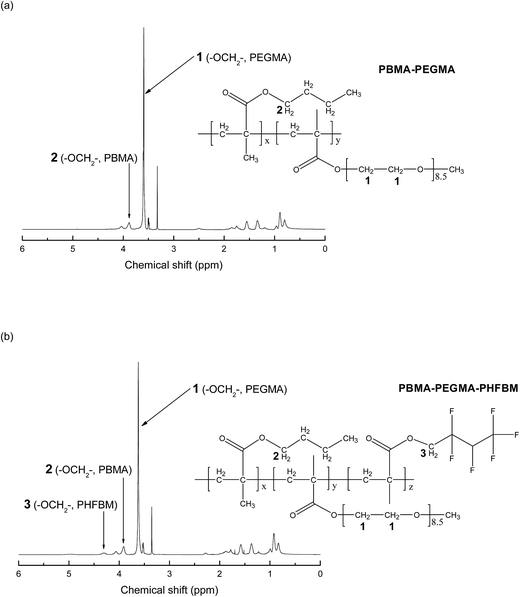
The detailed chemical compositions of the block-like copolymers were further determined using 1H NMR. Fig. 2 shows the 1H NMR spectra of the PBMA–PEGMA and PBMA–PEGMA–PHFBM copolymers. The peak appearance of the chemical shift at 3.65 ppm was assigned to –OCH2– groups in the PEGMA segments. The peak observed at 3.94 ppm belonged to –OCH2– groups in the PBMA segments. The characteristic peak at 4.36 ppm was attributed to –OCH2– groups in the PHFBM blocks. The ratio of each segment in the block-like copolymers was determined by evaluating the peak intensities at 3.65, 3.94 and 4.36 ppm, respectively. The mole fractions of BMA and PEGMA in the PBMA–PEGMA copolymer were calculated as 68.9 and 31.1% from the 1H NMR data (Fig. 2(a)), respectively. The mole fractions of PBMA, PEGMA and PHFBM in the PBMA–PEGMA–PHFBM copolymer were calculated as 56.9, 23.6 and 19.5% from the 1H NMR data (Fig. 2(b)), respectively. The as-synthesized copolymers were consistent with the original targets.
The number average molecular weights for the PBMA–PEGMA and PBMA–PEGMA–PHFBM copolymers were 12![[thin space (1/6-em)]](https://www.rsc.org/images/entities/char_2009.gif) 134 and 23
134 and 23![[thin space (1/6-em)]](https://www.rsc.org/images/entities/char_2009.gif) 085 Da, and the molecular weight distributions were 1.42 and 1.60, respectively. All the results indicated that the amphiphilic block-like copolymers were successfully synthesized by free radical polymerization. The obtained amphiphilic block-like copolymers were then utilized as additives to fabricate the modified membranes.
085 Da, and the molecular weight distributions were 1.42 and 1.60, respectively. All the results indicated that the amphiphilic block-like copolymers were successfully synthesized by free radical polymerization. The obtained amphiphilic block-like copolymers were then utilized as additives to fabricate the modified membranes.
3.2. Characterization of the membranes
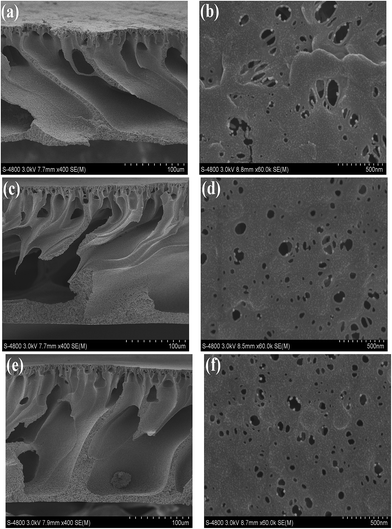
PVDF membranes were prepared by the NIPS method using different additives. Fig. 3 presents the cross-section and top surface morphologies of the control (PVDF/PEG2000) and modified (PVDF/PBMA–PEGMA and PVDF/PBMA–PEGMA–PHFBM) membranes. All the membranes had a typical asymmetric structure with a dense skin layer, a porous sublayer and fully developed macropores at the bottom, endowing the membranes with efficient permeability/selectivity and excellent mechanical strength. There existed no pronounced morphological variation between the control membrane and the modified membranes, indicating that the PBMA–PEGMA and PBMA–PEGMA–HFBM block-like copolymers had little effect on the PVDF membrane-forming property. In comparison with the control membrane, the top surface morphologies of the modified membranes showed a narrower pore size distribution (ranging from about 20 to 150 nm).The near-surface compositions of the PVDF/PBMA–PEGMA and PVDF/PBMA–PEGMA–PHFBM membranes were confirmed by XPS analysis. Three characteristic XPS signals for carbon (284.5 eV), oxygen (530.7 eV) and fluorine (686.5 eV) were observed in the wide-scan XPS spectra of the two membranes and the surface elemental compositions are presented in Table 1. To obtain a more detailed surface composition, XPS peaks for O 1s and C 1s core level spectra were resolved into several peaks representing different chemical environments using a sum of Lorentzian Gaussian functions. Fig. 4(a) and (b) show the peak deconvolutions of the O 1s and C 1s characteristic regions of the XPS spectra of the PVDF/PBMA–PEGMA–PHFBM membrane. The O 1s core level spectrum was resolved into three peaks at the binding energies of 532.2, 532.8 and 533.7 eV for the C![[double bond, length as m-dash]](https://www.rsc.org/images/entities/char_e001.gif) O, C–O–C and O–C
O, C–O–C and O–C![[double bond, length as m-dash]](https://www.rsc.org/images/entities/char_e001.gif) O groups, respectively. Since the PEGMA segments were the only source of the C–O–C group, the surface PEGMA coverage ΦPEGMA was directly calculated from the C–O–C area percentage of the resolved XPS results by the following equation:
O groups, respectively. Since the PEGMA segments were the only source of the C–O–C group, the surface PEGMA coverage ΦPEGMA was directly calculated from the C–O–C area percentage of the resolved XPS results by the following equation:
 | (11) |
![[double bond, length as m-dash]](https://www.rsc.org/images/entities/char_e001.gif) O, AC–O–C, and AO–C
O, AC–O–C, and AO–C![[double bond, length as m-dash]](https://www.rsc.org/images/entities/char_e001.gif) O are the areas of the fitted C
O are the areas of the fitted C![[double bond, length as m-dash]](https://www.rsc.org/images/entities/char_e001.gif) O, C–O–C and O–C
O, C–O–C and O–C![[double bond, length as m-dash]](https://www.rsc.org/images/entities/char_e001.gif) O peaks, respectively. The factor 0.2615 is the theoretical atom ratio of C–O–C in each PEGMA repeat unit. In addition, the C 1s core level spectrum was resolved into five peaks at the binding energies of 284.9, 286.3, 288.9, 290.6 and 293.5 eV for the C–C, C–O, C
O peaks, respectively. The factor 0.2615 is the theoretical atom ratio of C–O–C in each PEGMA repeat unit. In addition, the C 1s core level spectrum was resolved into five peaks at the binding energies of 284.9, 286.3, 288.9, 290.6 and 293.5 eV for the C–C, C–O, C![[double bond, length as m-dash]](https://www.rsc.org/images/entities/char_e001.gif) O/C–F, CF2 and CF3 species, respectively. Since the PHFBM segments were the only source of CF3 species, the surface PHFBM coverage ΦPHFBM was directly calculated from the CF3 area percentage of the resolved XPS results by the following equation:
O/C–F, CF2 and CF3 species, respectively. Since the PHFBM segments were the only source of CF3 species, the surface PHFBM coverage ΦPHFBM was directly calculated from the CF3 area percentage of the resolved XPS results by the following equation: | (12) |
![[double bond, length as m-dash]](https://www.rsc.org/images/entities/char_e001.gif) O, AC–O and AC–C are the areas of the fitted CF3, CF2, C–F/C
O, AC–O and AC–C are the areas of the fitted CF3, CF2, C–F/C![[double bond, length as m-dash]](https://www.rsc.org/images/entities/char_e001.gif) O, C–O and C–C peaks, respectively. The factor 0.0625 is the theoretical atom ratio of CF3 in each HFBM repeat unit.
O, C–O and C–C peaks, respectively. The factor 0.0625 is the theoretical atom ratio of CF3 in each HFBM repeat unit.
| Membrane | ε (%) | r m (nm) | CAw (°) | CAo (°) | γ s (mJ m−2) | γ ds (mJ m−2) | γ ps (mJ m−2) |
|---|---|---|---|---|---|---|---|
| PVDF/PEG2000 | 60.4 | 41.1 | 83.7 ± 2.6 | 39.9 ± 3.1 | 49.4 | 40.9 | 8.5 |
| PVDF/PBMA–PEGMA | 66.2 | 39.4 | 74.1 ± 1.9 | 28.3 ± 2.9 | 60.8 | 47.8 | 13 |
| PVDF/PBMA–PEGMA–PHFBM | 64.2 | 38.5 | 96.1 ± 3.2 | 56.9 ± 2.2 | 29.1 | 28.5 | 0.6 |
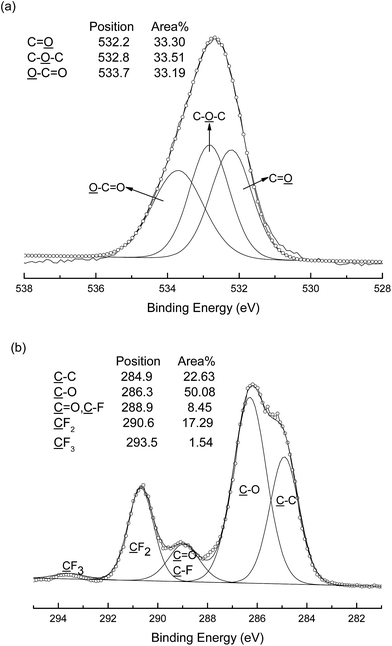 | ||
| Fig. 4 Resolved XPS O 1s (a) and C 1s (b) core level spectra results of the PVDF/PBMA–PEGMA–PHFBM membrane. | ||
As shown in Table 1, the ΦPEGMA and ΦPHFBM values determined by XPS analysis were higher than the theoretical values according to the composition of the casting solutions. The pronounced enrichment of the hydrophilic PEGMA segments and low surface energy PHFBM segments on the membrane surfaces were explained by free and forced surface segregation.10,13,17 The hydrogen bonding interactions between water and PEGMA led to an enthalpic preference for the hydrophilic PEGMA segments to spontaneously migrate on the membrane surfaces.13 Meanwhile, the free surface segregated hydrophilic PEGMA segments could drag the low surface energy PHFBM segments on the membrane surfaces.10,17 Thus, the amphiphilic membrane surfaces with a mixed structure of hydrophilic PEGMA and low surface energy PHFBM microdomains were obtained in one step.
The hydrophilicity and oleophobicity of the as-prepared membrane surfaces were characterized by water (CAw) and oil (CAo) contact angle measurements and the results are presented in Table 2. In comparison with the control PVDF/PEG2000 membrane, the water contact angle of the PVDF/PBMA–PEGMA membrane was decreased from 83.7 ± 2.6° to 74.1 ± 1.9°, which was attributed to the free surface segregation of the hydrophilic PEGMA segments on the membrane surface. The water contact angle of the PVDF/PBMA–PEGMA–PHFBM membrane was significantly increased to 96.1 ± 3.2°, which could be interpreted as a result of the hydrophobic nature of the PHFBM segments on the membrane surface due to forced surface segregation. In addition, the PVDF/PEG2000, PVDF/PBMA–PEGMA and PVDF/PBMA–PEGMA–PHFBM membranes had oil contact angles of 39.9 ± 3.1°, 28.3 ± 2.9° and 56.9 ± 2.2°, respectively. The highest oil contact angle was observed for the PVDF/PBMA–PEGMA–PHFBM membrane, and was attributed to the enrichment of the oleophobic PHFBM segments on the membrane surfaces.
| Membrane | Surface elemental (%) | Surface coveragea (%) | |||||
|---|---|---|---|---|---|---|---|
| C | O | F | Φ PEGMA | Φ thePEGMA | Φ PHFBM | Φ thePHFBM | |
| a The theoretical values of surface coverage were calculated from the actual content of each segment in the casting solutions. | |||||||
| PVDF/PBMA–PEGMA | 60.86 | 12.17 | 26.97 | 19.20 | 12.30 | 0 | 0 |
| PVDF/PBMA–PEGMA–PHFBM | 54.62 | 10.71 | 34.67 | 13.72 | 9.35 | 13.46 | 7.21 |
The membrane surface free energies (γs) along with the dispersive (γds) and polar (γps) interaction parameters are also shown in Table 2. The surface free energy (γs) of the PVDF/PBMA–PEGMA membrane with surface segregated hydrophilic PEGMA segments on the membrane surface was 60.8 mJ m−2. In comparison, the surface free energy (γs) of the PVDF/PBMA–PEGMA–PHFBM membrane was decreased to 29.1 mJ m−2, which was due to the forced surface segregation of the low surface energy PHFBM on the membrane surfaces. The surface free energy of a solid surface was an index of the intermolecular or interfacial attractive forces.18,20,21 The low surface free energy property of the PVDF/PBMA–PEGMA–PHFBM membrane would be anticipated to minimize the adhesion propensity and facilitate the removal of foulants from the membrane surfaces.
3.3. Membrane permeation and antifouling property
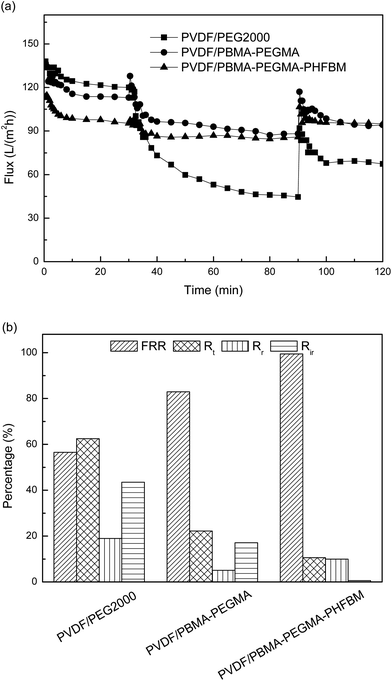
Fig. 5 presents the time-dependent flux variations of the control PVDF/PEG2000 membrane, and the modified PVDF/PBMA–PEGMA and PVDF/PBMA–PEGMA–PHFBM membranes during the oil/water emulsion filtration, and the corresponding FRR, Rt, Rr, and Rir values. All the membranes exhibited good oil rejection. For the control membrane, the water flux during the oil/water emulsion filtration was dramatically decreased compared with the initial pure water flux. The corresponding Rt value was as high as about 62.5% (Rr about 19.0%, Rir about 43.5%) and the FRR value was only 56.5%. For the hydrophilic PVDF/PBMA–PEGMA membrane, the Rt value was decreased to 22.2% (Rr about 5.1%, Rir about 17.1%) and the FRR value was increased to 82.9%. The improved antifouling property of the PVDF/PBMA–PEGMA membrane was attributed to the hydration layer formed by the spontaneous migration of the hydrophilic fouling-resistant PEGMA segments on the membrane surfaces. As shown in Scheme 2(a), the hydration layer constituted a protective screen to minimize the chance for oil droplets to have contact with the membrane surfaces. However, there were still some oil droplets on the membrane surfaces, which were difficult to wash away. After introducing both the hydrophilic fouling-resistant PEGMA segments and the fouling-release low surface energy PHFBM segments on the membrane surfaces in one step, the antifouling property was further elevated. The PVDF/PBMA–PEGMA–PHFBM membrane exhibited only a 10.6% total flux decline (Rr about 10.0%, Rir about 0.6%) and 99.4% flux recovery. Scheme 2(b) is presented for the better understanding of the fouling-resistance and fouling-release mechanism of the PVDF/PBMA–PEGMA–PHFBM membrane. Besides the hydrophilic protective screen, the low surface energy fouling-release segments on the membrane surfaces played a role in reducing the interactions between the oil foulants and the surfaces, and, as evidence, the moderate shear force could sweep the oil droplets from the surfaces. The membrane surfaces constructed with both hydrophilic and low surface energy blocks had a better antifouling property than that with only hydrophilic segments.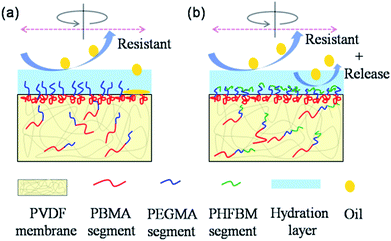 | ||
| Scheme 2 Tentative illustrations of the fouling-resistance and fouling-release mechanism of the (a) PVDF/PBMA–PEGMA and (b) PVDF/PBMA–PEGMA–PHFBM membranes. | ||
3.4. Antifouling property under different operating conditions
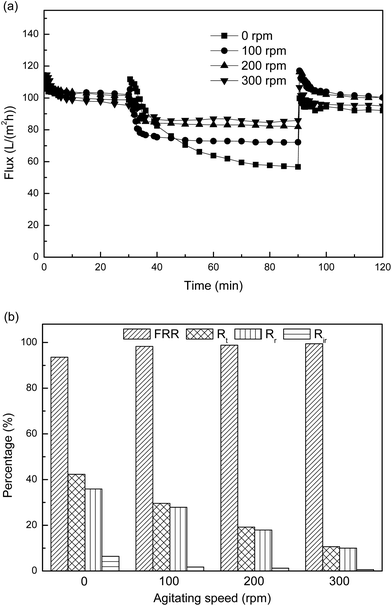
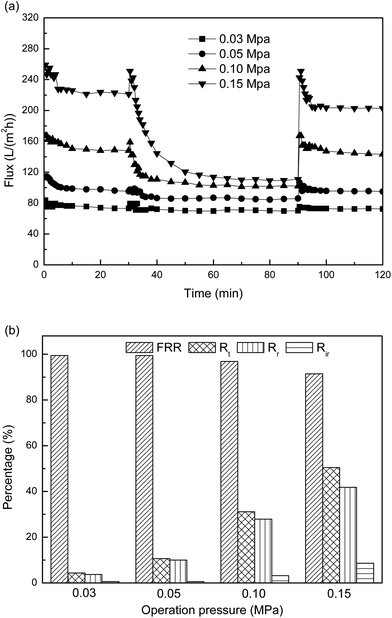
To further explore the antifouling property, filtrations of the oil/water emulsion by the PVDF/PBMA–PEGMA–PHFBM membrane were carried out under different near-surface agitating speeds, operating pressures and oil concentrations, respectively. Fig. 6 shows the time-dependent flux variations of the PVDF/PBMA–PEGMA–PHFBM membrane under different near-surface agitating speeds during the oil/water emulsion filtration and the corresponding FRR, Rt, Rr, Rir values. When the near-surface agitating speed was 0, 100, 200 and 300 rpm, the Rt value was 42.3, 29.6, 19.2 and 10.6%, respectively. The total flux decline was effectively suppressed under the high near-surface agitating speed, which can be interpreted by the fact that the high near-surface agitating speed could reduce the concentration polarization and sweep the oil droplets away from the amphiphilic membrane surfaces during the oil/water emulsion filtration.22 The FRR values were 93.5, 98.3, 98.8 and 99.4% at the near-surface agitating speeds of 0, 100, 200 and 300 rpm, respectively, indicating that the membrane fouling could be solved by simple hydraulic cleaning after the oil/water emulsion filtration.The time-dependent fluxes of the PVDF/PBMA–PEGMA–PHFBM membrane at different operating pressures were carried out during the oil/water emulsion filtration. As shown in Fig. 7(a), the steady-state fluxes for the initial water were increased with an increase of the operating pressure. Fig. 7(b) shows the corresponding FRR, Rt, Rr, Rir values of the PVDF/PBMA–PEGMA–PHFBM membrane at four different operating pressures. It is observed that the total flux decline was increased with an increase of the operating pressure. When the operating pressure was 0.03 and 0.05 MPa, Rt was about 4.3 and 10.6%, indicating a moderate flux decline. At the higher pressures (0.10 and 0.15 MPa), severe total flux decline was observed (Rt was about 31.1 and 50.4%). A similar trend had been reported previously by Tang and Wang, that the higher initial flux under a higher operating pressure led to severe membrane fouling due to the increased permeation resistance and the concentration polarization.23,24 The FRR values at the operating pressures of 0.03, 0.05, 0.10 and 0.15 MPa were 99.4, 99.4, 96.8, and 91.4%, respectively. The decreased FRR values can be explained as the fouling layer became more compact and more difficult to wash away with an increase of the operating pressure.25 However, it should be noted that the amphiphilic membrane still exhibited relatively good flux recovery even under a high operating pressure.
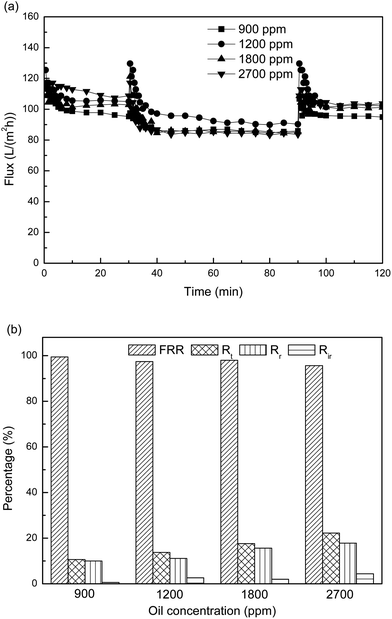
Oil concentrations from 900 to 2700 ppm were utilized during the oil/water emulsion filtrations in order to investigate the wide-spectrum fouling for the PVDF/PBMA–PEGMA–PHFBM membrane. Fig. 8 shows the time-dependent flux variations under different oil concentrations and the corresponding FRR, Rt, Rr, Rir values. The Rt values increased from 10.6% to 22.2% with an increase of oil concentration. Higher oil concentration tended to increase the aggregation of oil droplets and form a thicker oil layer on the membrane surfaces, increasing the water transport resistance and concentration polarization.26 All the FRR values were higher than 95%, indicating that the PVDF/PBMA–PEGMA–PHFBM membrane preserved excellent antifouling property even at a high oil concentration.
3.5. Long-term antifouling experiment
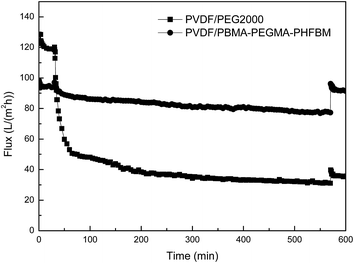
The excellent antifouling property of the PVDF/PBMA–PEGMA–PHFBM membrane for long-term applications was also an important issue for the efficient treatment of oil/water emulsions. Nine hour filtrations of an oil/water emulsion by the PVDF/PEG2000 and PVDF/PBMA–PEGMA–PHFBM membranes were carried out and the results are presented in Fig. 9. For the control PVDF/PEG2000 membrane, the flux of the oil/water emulsion decreased dramatically with Rt about 73.8% after nine hours of filtration. In comparison, the PVDF/PBMA–PEGMA–PHFBM membrane exhibited a slower flux decline (Rt about 17.4%) after nine hours of filtration. The FRR for the control membrane was only 12.3%, indicating that large amounts of oil droplets adsorbed and deposited on the membrane surfaces. The FRR value of the PVDF/PBMA–PEGMA–PHFBM membrane remained at the higher level of 97.6%, indicating that most of the oil droplets on the membrane surfaces could be removed by simple hydraulic cleaning.4. Conclusions
Antifouling membranes were prepared by blending the amphiphilic block-like copolymer PBMA–PEGMA–PHFBM with PVDF by the NIPS method. Amphiphilic membrane surfaces bearing fouling-resistant and fouling-release polymer segments were constructed in one step by free and forced surface segregation, which rendered the membranes with low total flux decline (Rt about 10.6%) and high flux recovery (FRR about 99.4%). Additionally, the effects of the operating conditions, such as agitating speed, operating pressure and oil concentration on the antifouling properties of the amphiphilic membranes were studied. The high flux recovery ratio under different operating conditions indicated that the deposited and adsorbed oil droplets could be washed away by simple hydraulic cleaning. The amphiphilic membranes possessed an excellent long-term antifouling property, which ensured a long lifespan without obvious flux decline in long-term oil/water emulsion separation.Nomenclature
| ΔP | Operating pressure (MPa) |
| V | Volume of permeated water (L) |
| Δt | Operating time (h) |
| J w1 | Pure water flux (L m−2 h−1) |
| J w2 | Pure water flux of cleaned membranes (L m−2 h−1) |
| J p | Oil/water emulsion flux (L m−2 h−1) |
| R | Rejection ratio (%) |
| C p | Concentration of permeate solution |
| C f | Concentration of feed solution |
| FRR | Flux recovery ratio (%) |
| R t | Total flux decline ratio (%) |
| R r | Reversible flux decline ratio (%) |
| R ir | Irreversible flux decline ratio (%) |
| PVDF | Polyvinylidene fluoride |
| NMP | N-Methyl-2-pyrrolidone |
| PEG | Poly(ethylene glycol) |
| BMA | Butyl methacrylate |
| AIBN | Azobisisbutyronitrile |
| PEGMA | Poly(ethylene glycol) methyl ether methacrylate |
| HFBM | Hexafluorobutyl methacrylate |
| SDS | Sodium dodecylsulfate |
| NIPS | Non-solvent induced phase separation |
Acknowledgements
This research was financially supported by the National Science Fund for Distinguished Young Scholars (no. 21125627), and the Tianjin Natural Science Foundation (no. 13JCYBJC20500, 14JCZDJC37400).References
- B. Chakrabarty, A. K. Ghoshal and M. K. Purkait, J. Membr. Sci., 2008, 325, 427–437 CrossRef CAS PubMed.
- M. Cheryan and N. Rajagopalan, J. Membr. Sci., 1998, 151, 13–28 CrossRef CAS.
- Z. Xue, Y. Cao, N. Liu, L. Feng and L. Jiang, J. Mater. Chem. A, 2014, 2, 2445–2460 CAS.
- X. Zhu, W. Tu, K.-H. Wee and R. Bai, J. Membr. Sci., 2014, 466, 36–44 CrossRef CAS PubMed.
- R. Jamshidi Gohari, E. Halakoo, W. J. Lau, M. A. Kassim, T. Matsuura and A. F. Ismail, RSC Adv., 2014, 4, 17587–17596 RSC.
- Y. Zhu, F. Zhang, D. Wang, X. F. Pei, W. Zhang and J. Jin, J. Mater. Chem. A, 2013, 1, 5758–5765 CAS.
- J. Mansouri, S. Harrisson and V. Chen, J. Mater. Chem., 2010, 20, 4567–4586 RSC.
- M. Hesampour, A. Krzyzaniak and M. Nyström, J. Membr. Sci., 2008, 325, 199–208 CrossRef CAS PubMed.
- A. Seidel and M. Elimelech, J. Membr. Sci., 2002, 203, 245–255 CrossRef CAS.
- X. Zhao, Y. Su, Y. Li, R. Zhang, J. Zhao and Z. Jiang, J. Membr. Sci., 2014, 450, 111–123 CrossRef CAS PubMed.
- D.-G. Kim, H. Kang, S. Han, H. J. Kim and J.-C. Lee, RSC Adv., 2013, 3, 18071–18081 RSC.
- M. A. Shannon, P. W. Bohn, M. Elimelech, J. G. Georgiadis, B. J. Marinas and A. M. Mayes, Nature, 2008, 452, 301–310 CrossRef CAS PubMed.
- A. Asatekin, S. Kang, M. Elimelech and A. M. Mayes, J. Membr. Sci., 2007, 298, 136–146 CrossRef CAS PubMed.
- J. Peng, Y. Su, Q. Shi, W. Chen and Z. Jiang, Bioresour. Technol., 2011, 102, 2289–2295 CrossRef CAS PubMed.
- Y.-S. Choi, H. Kang, D.-G. Kim, S.-H. Cha and J.-C. Lee, ACS Appl. Mater. Interfaces, 2014, 6, 21297–21307 CAS.
- D. M. Dresselhuis, G. A. van Aken, E. H. A. de Hoog and M. A. Cohen Stuart, Soft Matter, 2008, 4, 1079–1085 RSC.
- W. Chen, Y. Su, J. Peng, Y. Dong, X. Zhao and Z. Jiang, Adv. Funct. Mater., 2011, 21, 191–198 CrossRef CAS.
- C. M. Magin, S. P. Cooper and A. B. Brennan, Mater. Today, 2010, 13, 36–44 CrossRef CAS.
- J. A. Sánchez Pérez, E. M. Rodríguez Porcel, J. L. Casas López, J. M. Fernández Sevilla and Y. Chisti, Chem. Eng. J., 2006, 124, 1–5 CrossRef PubMed.
- S. Krishnan, C. J. Weinman and C. K. Ober, J. Mater. Chem., 2008, 18, 3405–3413 RSC.
- N. Subhi, A. R. D. Verliefde, V. Chen and P. Le-Clech, J. Membr. Sci., 2012, 403–404, 32–40 CrossRef CAS PubMed.
- R. Bian, K. Yamamoto and Y. Watanabe, Desalination, 2000, 131, 225–236 CrossRef CAS.
- C. Y. Tang, Y.-N. Kwon and J. O. Leckie, J. Membr. Sci., 2007, 290, 86–94 CrossRef CAS PubMed.
- Y.-N. Wang and C. Y. Tang, J. Membr. Sci., 2011, 376, 275–282 CrossRef CAS PubMed.
- S. Hong and M. Elimelech, J. Membr. Sci., 1997, 132, 159–181 CrossRef CAS.
- P. H. H. Duong and T.-S. Chung, J. Membr. Sci., 2014, 452, 117–126 CrossRef CAS PubMed.
| This journal is © The Royal Society of Chemistry 2015 |

