Reduced graphene oxide paper based nanocomposite materials for flexible supercapacitors

Tanmoy Rath*ab and Patit Paban Kundub
aCentral Institute of Plastics Engineering and Technology (CIPET), Bhubaneswar-751024, India. E-mail: tanmayrath@gmail.com; Tel: +91-674-2743462
bDepartment of Polymer Science & Technology, University of Calcutta, West Bengal-700073, India

Received 22nd January 2015 , Accepted 6th March 2015

First published on 9th March 2015


Abstract

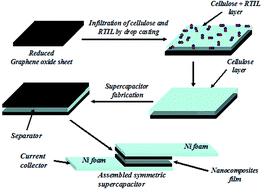
In this article, a light-weight and highly flexible supercapacitor based on cellulose fibers and reduced graphene oxide (rGO) nanocomposites electrode is designed and assembled. The reduced graphene oxide (rGO) paper was prepared from natural graphite by a modified Hummer's method, with hydroiodic acid (HI) as a reducing agent. The as-prepared rGO, which was characterized by Raman spectroscopy, XRD, TEM and SEM, was assembled into the supercapacitor. XRD and Raman spectroscopy results confirm the oxidation of graphite and reduction of graphite oxide (GO) to reduced graphene oxide (rGO) sheets. The double-layer capacitive behavior of the supercapacitor is studied by cyclic voltammetry techniques in aqueous (6 M KOH) and non aqueous room temperature ionic liquid (RTIL) electrolytes, respectively. The ionic liquid enables a larger operating voltage range of 0.0–2 V compared to 0.0–1 V in aqueous medium. The specific capacitance of the supercapacitor has been determined to be 255 F g−1 at a scan rate of 10 mV s−1 in an aqueous medium. In an non aqueous medium, the graphene based supercapacitor exhibits specific capacitance values of 78 F g−1 at a scan rate of 10 mV s−1. The supercapacitor devices exhibit excellent long cycle life, with only a 10% decrease in specific capacitance after 5000 cycles.


Introduction

There is currently a strong demand for the development of flexible, light-weight and environmentally friendly energy storage devices, based on supercapacitors, to meet the power needs of modern gadgets.1–3 Over the past few decades, supercapacitors have attracted a considerable amount of attention due to their superior properties in terms of longer cycle life, high energy density, very fast charge/discharge rate, high cyclic stability compared to conventional batteries and capacitors.4,5 The mechanism of storage of electrochemical energy generally proceeds in two different ways, (a) through the electrical double layer capacitor, where the electric double layer is formed by the physical separation of opposite charges at the electrode electrolyte interface, and (b) by some electron charge-transfer redox reactions, typically called a pseudocapacitor.6,7 Though the energy densities of pseudocapacitance based devices are greater than EDLCs, but recycle lifetime (charge–discharge cycle) are limited in pseuocapacitance due to the phase changes within the electrode.8,9 Therefore, supercapacitors are widely used in different applications, such as memory back-up systems, consumer electronics, electric vehicles and industrial power and energy management. All these above electronic applications require cheap, light-weight and flexible storage devices.10 However, in the development of a light weight and flexible supercapacitor device, the selection of the materials (electrodes, spacer, and electrolyte) is one of the most important parameter. The key factors determining the performances of electrochemical capacitors are specific surface area, porosity, properties of electrolyte; these properties are crucial in achieving high power and energy density. In electric double layer capacitors (EDLCs), the sizes of cation and anion of the electrolyte are significant factors in the adsorption of the ions into the pores of the carbon based electrodes. EDLCs store the electric charge directly across the double layer of the electrode,6 since the carbon form has a porous structure allowing the electrolyte ions to pass through and develop a double layer at exposed surface in electrolyte.

In the most recent, some works have been carried out for development of flexible, thin and light energy storage devices. Xing-bin Yan et al. fabricated a flexible electrochemical device using cotton cloth as the substrate and graphene oxide (GO) suspension, followed by annealing at 300 °C in argon atmosphere. The resulting electrode achieved a capacitance value of 81.7 F g−1 in aqueous electrolyte.11 Hu et al. reported a high area specific capacitance of 2.8 F cm−2 at a scan rate of 0.05 mV s−1 (ref. 12) for MnO2/CNT hybrid structure, where MnO2 nanoflowers were electrodeposited onto CNT enabled conductive textile fibers. A light-weight and flexible fabric supercapacitor electrode have been prepared by Jost et al. using a printmaking technique by permeating porous carbon materials into woven cotton and polyester fabrics. A high area capacitance value of 0.43 F cm−2 at 0.25 A g−1 was achieved by the electrode.13 Yuan et al. build a flexible solid-state supercapacitor based on a CNPs/MnO2 nanorod hybrid structure, which showed good electrochemical performance with an energy density of 4.8 W h kg−1 at a power density of 14 kW kg−1.14

CSR Vusa et al. developed reduced graphene oxide from graphene oxide by using naturally available anti-oxidants carotenoids materials and the resulting reduced graphene oxide is used for futuristic biological applications.15 Hui Wang et al. reported a strategy for successive exfoliation and reduction of graphite oxide with the use of pyridine as the intercalating agent and the obtained graphene exhibits a good performance in capacitive deionization.16 A supercapacitor based on reduced graphene oxide (RGO) electrodes and ionic liquid as the electrolyte was developed by J.P.C Trigueiro, et al. and the resulting supercapacitor showed an electrochemical stability of 3 V and provided a capacitance of 71.5 F g−1 at room temperature.17 Juan Yang et al. prepared graphene films (G films) by direct vacuum filtration of a highly dispersed graphene suspension (G suspension) on filter paper, which is used as electrodes for supercapacitor and the obtained G film exhibits a high capacitance of 117.9 F g−1 at a high scan rate of 1000 mV s−1.18 Graphene/mesoporous carbon (GE/MC) composites have been prepared via a direct triblock-copolymer-templating method and used as capacitive deionization (CDI) electrodes for supercapacitor.19 Zhuangjun Fan et al. developed a three-dimensional carbon nanotube/graphene sandwich structures with CNT pillars grown in between the graphene layers by chemical vapor deposition and the resulting electrode exhibits excellent electrochemical performance.20 Hui Wang et al. fabricated Graphene-coated hollow mesoporous carbon spheres (GHMCSs) electrode by a simple template-directed method using phenolic polymer coated polystyrene spheres as templates. The resulting graphene-based composites structure exhibits enhanced electrochemical performance with high specific capacitance, low inner resistance and long cycling lifetime.21 CVD generated mesoporous hollow carbon spheres as supercapacitors have been developed by Xuecheng Chen et al. and The hollow carbon spheres have exhibited relatively high graphitization degree and high specific surface area of 770 m2 g−1.22

Herein, we describe a simple method for the preparation of a flexible nanocomposite electrode. We have selected graphene as electrode and cellulose as electrochemical separator for the development of supercapacitor device. Graphene is an assembly of 2D honeycomb type arrangement of sp2 hybridized C atoms with the highest conductivity and highest specific surface area (2600 m2 g−1) amongst the carbonaceous materials.23 The very high in-plane conductivity and surface area makes it an attractive material for use in double layer supercapacitors.24 The 3D hierarchical structure of cellulose fiber is very interesting for an energy storage system that involves liquid electrolytes, since the interconnected porosity allows fast access of ionic species to the electrode surfaces. The major challenge in fabricating nanocomposites supercapacitor by using cellulose fiber as it is insoluble in most common solvent. In order to resolve that problem we have used room-temperature ionic liquid(RTIL) [1-allyl-3 methylimidazolium chloride ([amIm][Cl])],25 which dissolves up to 25% (wt/wt) of unmodified cellulose by using microwave irradiation26 and providing intimate contact between the electrode and cellulose fibers.

In this paper, reduced graphene oxide (rGO) has been produced from graphite by the modified Hummers method followed by chemical reduction. The objective of the research work is the development of flexible nanocomposites electrode and investigation electrochemical performance of the electrode.

Experimental

Materials

Natural flake graphite was purchased from Sigma Aldrich (USA). Sulfuric acid, hydrochloric acid, ethanol, hydrogen peroxide and potassium hydroxide (KOH) were purchased from MERCK, India Ltd. Potassium permanganate (KMnO4) (oxidizing agent) and Hydroiodic acid (HI) (reducing agent) have been purchased from Sigma Aldrich (USA). Room-temperature ionic liquid (RTIL) [1-allyl-3 methylimidazolium chloride ([amIm][Cl])] was obtained from the Sigma Aldrich (USA). All chemicals were of analytical grade and were used without further purification for experiments. Ultra-pure water (18 MΩ cm) was used throughout the experiments.

Preparation of graphene oxide

In this work, oxidation of graphite and reduction of graphene oxide has been done through the procedures reported by Gaoquan Shi.27 Herein, we prepared mildly oxidized graphene oxide (MOGO) through limited oxidation of graphite powder which is based on modified Hummers method.28 The as prepared MOGO showed both excellent dispersibility in water (1 mg mL−1) and high graphitic crystallinity. Chemical reduction of MOGO was carried out by hydroiodic (HI) acid using the following procedure. Briefly, GO paper was prepared by vacuum filtration of GO dispersion through a membrane filter. Then the GO paper was immersed into HI acid (55%) for reduction and the reaction system was kept at 100 °C for 1 h. The obtained reduced graphene oxide (rGO) paper was washed with ethanol and acetone to remove extra acid and dried at room temperature. This reduced graphene oxide (rGO) paper possesses free standing nature (Fig. 1) and high electrical conductivity. The diameter of the reduced graphene oxide paper is 4.7 cm. The electrical conductivity of HI reduced graphene oxide (rGO) paper was measured to be 424 Scm−1. The significantly improved electrical property of rGO is attributed to its low degree of oxidation and low-defect structure.
image file: c5ra00563a-f1.tif
Fig. 1 Digital photograph of free-standing r-GO paper.

Morphology and structural characterization

The surface morphology and microstructure of the rGO sheets were investigated by field-emission scanning electron microscope (JEOL JSM-7600F, USA) and transmission electron microscope (JEOL JEM 2100 HR, USA). The cross-section morphology of the rGO paper was investigated using the FESEM. Raman spectra were recorded in the range of 800–2000 cm−1 in a Nanofinder 30 confocal Raman microscope (MODEL 2018 RM (Make Spectra Physics, USA) using an Ar–Kr laser beam having a wavelength of 488 nm with a CCD detector. Measurement of electrical conductivities of the samples was performed using a standardized “four-point probe” [Keithley 2000 (Keithley Instruments Inc., USA)] setup in order to eliminate contact resistance, and each sample pellet was cut into rectangular shape and measured three times to get the average value. The resistivity of the pressed samples is measured using the following equation:
image file: c5ra00563a-t1.tif
where ρ is the resistivity, t is the thickness of the sample and R is the resistance.

Fabrication of supercapacitor and electrochemical measurements

Supercapacitors were prepared by stacking reduced graphene oxide (rGO) electrodes, a separator and contacts together, see Fig. 3. In this work, we combined cellulose fibers and rGO paper, which fit the characteristics of insulating separator and electrode and provide inherent flexibility to the system. Cellulose fibers (40 mg) was placed in a glass vial and RTIL (1.5 g) was added as a liquid at 70 °C (i.e. above the melting point). The vial was then loosely capped, placed in microwave oven, and heated with 5–6 s pulse at full power. During pulses, the vial was removed and vortexed, to afford a 4% (wt/wt) cellulose fibers in RTIL. The resulting solution was drop coated on the preheated (∼80 °C) rGO paper which was placed on Si wafer and was kept for 5 min to facilitate infiltration. After infiltration, the substrate was kept on dry ice until it solidified (≫15 min). The resulting nanocomposite film was washed extensively with ethanol, to extract all of the RTIL. The nanocomposite film was then dried in vacuum oven. The nanocomposite film was peeled from the Si substrate, and this film was directly used in the fabrication of supercapacitors. The as-made nanocomposites film possesses good flexibility (shown in Fig. 2).
image file: c5ra00563a-f2.tif
Fig. 2 Photograph of flexible nanocomposite film.

image file: c5ra00563a-f3.tif
Fig. 3 A schematic diagram of the structure of an assembled symmetric supercapacitor.

A symmetric supercapacitor was assembled as follows. First, two pieces of rGO-cellulose fibers nanocomposite films (where cellulose fibers itself acts as a separator) with the same area were attached to nickel foam with a nickel wire on each of them. The nanocomposite films were used as electrodes and the nickel foam was used as the current collectors. Then the nanocomposites film are stacked together to form a “sandwich” structure, which acts as supercapacitor. The “sandwich”-like slice was dipped in non aqueous RTIL or aqueous 6 M KOH electrolyte and the slice was sealed by laminating it with plastic foil quickly and then left at room temperature for a few more hours before starting electrochemical tests. A compact stacking is necessary to ensure a stable connection between all components.

The electrochemical characterization of the supercapacitors, were investigated with the help of cyclic voltammetry (CV), galvanostatic charge/discharge analysis in non aqueous (RTIL) and aqueous (6 M KOH) electrolyte. All the tests were performed in an electrochemical working station (Gamry-600) at room temperature. The CV tests were measured with the potential window from 0 V to 1.0 V for 6 M KOH electrolyte and 0 V to 2 V for RTIL electrolyte at scan rates varying from 10 mV s−1 to 100 mV s−1. Galvanostatic charge/discharge tests were measured at the current density of 0.5 and 1.0 A g−1 for 6 M KOH electrolyte and 0.1 and 0.5 A g−1 for RTIL electrolyte. Specific capacitance (C) of the materials was calculated from galvanostatic charge/discharge curve using the following equation:29

image file: c5ra00563a-t2.tif
here, I is the constant discharging current (A g−1); dt in s is the discharge time; dv is the potential window during the discharge process (V); and total mass of the two electrode materials (g) is denoted by m.

Results and discussion

TEM, XRD and Raman spectroscopy, were used to characterize the morphology and microstructure of as-made GO and rGO sheets. Fig. 4a shows typical TEM image of the rGO nanosheets, which demonstrates that the rGO sheets are efficiently exfoliated to form thin nanosheets with typical wrinkled structure.30 The wrinkles observed are probably caused by the presence of oxygen-containing functional groups and the resultant defects during the preparation of rGO.31 It also reveals from Fig. 4a that the prepared rGO are transparent and maintain substantial stability under the high energy electron beam. A selected-area electron diffraction (SAED) pattern of the rGO is shown in the inset of Fig. 4a. The diffraction dots corroborate the highly crystalline nature of rGO and a more regular carbon framework.32,33 A high resolutions TEM image of rGO has been shown in Fig. 4b. The image demonstrates that rGO is composed of a few layers and further corroborated with the cross sectional FESEM image as shown in Fig. 4c.
image file: c5ra00563a-f4.tif
Fig. 4 (a) TEM image of the rGO (SAED pattern of rGO has been shown in inset), and (b) HRTEM image of rGO, (c) cross-sectional SEM image of rGO.

XRD diffractions of prepared rGO, as well as of the starting bulk graphite and GO powders are depicted in Fig. 5. In XRD pattern, a clear diffraction peak (d002) is observed for the graphite at 2θ = 26.4° and after oxidation, this characteristic graphite peak disappeared and replaced by a well defined peak at 2θ = 11.35°, which was corresponding to the (001) diffraction peak of GO. Not only that, but the interlayer spacing (d-spacing) of GO (0.774 nm), which is larger than that of the d-spacing (0.34 nm) of natural graphite. This large interlayer distance of GO sheets could be attributed to the presence of oxygen containing functional groups on both sites of the graphene sheet.34 On the other hand, rGO shows the board peak at 2θ = 21.06° which is close to the 002 reflection peak of native graphite (2θ = 26.4°). The broadening and shift of the characteristic diffraction peak of rGO, compare to graphite peak was due to the presence of short-range order graphene sheets in stacked stacks. It has also been found that, the interlayer spacing of rGO (0.39 nm) is slightly larger than that of graphite (0.34 nm), this is attributed that the small amount of residual oxygen-containing functional groups are present in the rGO structure.35


image file: c5ra00563a-f5.tif
Fig. 5 XRD patterns of natural graphite, GO and rGO sheets.

Raman spectroscopy is very much useful to characterize the electronic structure of carbon materials and has been proved to be an essential tool to characterize graphene. As shown in Fig. 6, the Raman spectrum of GO has been found to significantly change after the reduction. The D vibration band of GO is located at 1345 cm−1 and at 1349 cm−1 for rGO, which is obtained from a breathing mode of k-point photons of A1g symmetry.36 The G peak at around 1585 cm−1 for GO and at 1575 cm−1 for rGO is due to the first order scattering of the E2g phonon of sp2 C atoms.28 After the reduction of GO, the intensity ratio of the D band to the G band (ID/IG) was increased significantly, which indicates the introduction of sp3 defects after functionalization and formation of new (or more) graphitic domains.37,38 From the graph, it is also found that the intensity of D band of rGO is higher compare to GO, suggested the presence of more isolated graphene domain in the rGO structure.


image file: c5ra00563a-f6.tif
Fig. 6 Raman spectra of GO and rGO sheets.

Electrical conductivity of the reduced products is another important criterion to evaluate how the π conjugated system has been restored in this structure. The in-plane electrical conductivities of GO sheets and rGO nanosheets are evaluated at room temperature based on the four probe method, as shown in Table 1. The measured electrical conductivity of GO and rGO show a significant change. After chemical oxidation, the prepared GO exhibited a lower electrical conductivity of 0.00157 S cm−1. It is reported that the GO conducts electricity poorly, as it lacks an extended π-conjugated orbital system.39 The electrical conductivity of the rGO is found to be higher than that of GO, which indicates that π conjugation is restored in rGO by the deoxygenation and dehydration process.

Table 1 Electrical conductivity of (GO) and (rGO) sheets
Samples Conductivity (S cm−1)
Graphene oxide (GO) 0.00157
Reduced graphene oxide (rGO) (after reduction by HI) 424


To assess the electrochemical performance of the rGO-cellulose fibers based nanocomposites, a symmetric two electrode cell geometry was prepared using non aqueous (RTIL) as electrolyte and to compare the performance of the electrode aqueous (6 M KOH) electrolyte was also used. The cyclic voltammetry (CV) measurements were carried out from 0–2 V for ionic liquid and 0–1.0 V for aqueous electrolyte at various scan rates from 10–100 mV s−1. Fig. 7(a) and (b) shows the CV curves of the symmetric supercapacitor in aqueous (6 M KOH) and non aqueous (RTIL) electrolyte. From the graph, it is clearly seen that a rectangular shaped curve is observed for all scan rates, which is indicative of double layer capacitive behavior for graphene-based supercapacitors.40 Although the presence of oxygen-containing functional groups on the surface of the rGO sheets would bring a small amount of pseudocapacitance but absence of redox peaks indicates that the devices are primarily nonfaradic. The specific capacitance measured from the rectangular CV curves was 255 and 78 F g−1 at a scanning rate of 10 mV s−1 in 6 M KOH and RTIL electrolytes, respectively. The specific capacitance of the device in the 6 M KOH solution is higher compared with RTIL, because the dielectric constant and ionic mobility of the RTIL are lower.41 To obtain a more detailed information on the capacitance performance of the as-prepared supercapacitor for both electrolyte, the CV curves with various scan rates were studied. The variations in the specific capacitance of supercapacitor as a function of scan rate are shown in Fig. 8(a) and (b). It can be seen that the specific capacitance decreases with the increase of the scan rate from 10 to 100 mV s−1. This is attributed that at high scan rate the inner active site of the electrode are not accessible for ion insertion due to fast potential changes.42 However, the specific capacitance value with respect to scan rate of the device in the ionic liquid electrolyte is lower compared with aqueous electrolyte. It means that, at high scan rate, the ion diffusion of ionic liquid electrolyte into the interior electrodes surface is more difficult than that of aqueous electrolyte due to its high viscosity.


image file: c5ra00563a-f7.tif
Fig. 7 (a) C–V plots of the supercapacitor at various scan rates in aqueous electrolytes (6 M KOH), and (b) in RTIL electrolytes.

image file: c5ra00563a-f8.tif
Fig. 8 (a) Plots of specific capacitances as a function of scan rates in aqueous (6 M KOH) electrolyte, (b) in RTIL electrolyte.

To evaluate the charge storage capacity, the galvanostatic charge/discharge analysis of the assembled supercapacitor has been performed at the current densities of 0.5 and 1.0 A g−1 in aqueous electrolyte and is shown in Fig. 9(a). It can be seen that all charge–discharge curves with respect to the time dependence of potential are linear and symmetrical at various current densities, which is another typical characteristic of an ideal capacitor.43 The average energy density (E) (W h kg−1) and the power density (P) (W kg−1) of the nanocomposite were calculated from the following expressions.44

image file: c5ra00563a-t3.tif
where C, ΔV and t represent the specific capacitance (F g−1), the potential window (V), and discharge time (s), respectively. The Ragone plot of the assembled supercapacitor is shown in Fig. 12a. The energy density and power density were calculated to be 6.28 W h kg−1 and 1.32 kW kg−1 respectively, at 0.5 A g−1 in 6 M KOH electrolyte at room temperature, which indicates that the assembled supercapacitor has a much better power performance than the reported nickel metal hydride battery (0.25–1 kW kg−1).45


image file: c5ra00563a-f9.tif
Fig. 9 (a) Charge/discharge plot of the supercapacitor at a constant current density of 0.1 A g−1, using aquous (6 M KOH) electrolyte. (b) Plot of specific capacitance vs. cycle number, measured at 100 mV s−1 in aqueous (6 M KOH) electrolyte.

Fig. 9(b) shows the specific capacitance of the assembled supercapacitor as a function of cycle number. The supercapacitor has been subjected to 5000 cycles at a scan rate of 100 mV s−1. It can be observed that the supercapacitor demonstrate reasonable cyclic stability by retaining 90% of specific capacitance after 5000 cycles. Therefore, after several cycles, retrieval of specific capacitance indicates high electrochemical cyclic stability of the supercapacitor. The high stability of our supercapacitors suggests that these energy storage devices are suitable for fast charging applications.

We have also performed the galvanostatic charge/discharge analysis of the assembled supercapacitor in ionic liquid electrolyte. Fig. 10(a) describes the galvanostatic charge/discharge performance at the current densities of 0.1 and 0.5 A g−1 and shows a nearly linear shape. The galvanostatic discharge at a current density of 0.1 A g−1 resulted in a specific capacitance of 20.1 F g−1 based on the total weight of the electrode materials. It is well known that the specific capacitance of each electrode (single electrode) is four times the total cell specific capacitance.45 Therefore, the specific capacitance for each electrode of our cell is 80.4 F g−1 at the density of 0.1 A g−1 in RTIL electrolyte. This value is lower compared with some reported results.46,47 The lower values of capacitance might be due to high viscosity of the electrolyte resulting in the larger charge transfer resistance. The energy density is calculated using the above equation. It is found that the energy density of the supercapacitor is 11.2 W h kg−1 in RTIL electrolyte (Fig. 12b). The cycle rate performance of the specific capacitance with respect to charge–discharge cycles has also been done in ionic liquid electrolyte. Fig. 10(b) displays the specific capacitance of the assembled supercapacitor as a function of cycle number at a scan rate of 100 mV s−1 in RTIL electrolyte. After 5000 cycles, 90% of its capacitance was still retained, indicating that the supercapacitor has good cycle stability.


image file: c5ra00563a-f10.tif
Fig. 10 (a) Charge/discharge plot of the supercapacitor at a constant current density of 0.1 A g−1, using RTIL electrolyte. (b) Plot of specific capacitance vs. cycle number, measured at 100 mV s−1 in RTIL electrolyte.

Fig. 11(a) and (b) represents the EIS of the graphene electrodes in terms of the Nyquist plot for aqueous (6 M KOH) and non aqueous (RTIL) electrolyte, respectively. As shown in figures, the Nyquist plot of graphene based supercapacitor exhibits a semicircle in the high frequency region followed by an inclined line in the low frequency region. The straight line at low frequency of the Nyquist plots is the Warburg resistance, indicates a nearly ideal capacitor response. The Warburg resistance is generated by the interruptions in the sample uniformity during diffusion process i.e. during the semi-infinite diffusion of ions into the porous structure. The larger the Warburg resistance indicates greater variations in ion diffusion path lengths and increases obstruction of ion movement.48 In case of aqueous electrolyte, the equivalent series resistance (ESR) value obtained from the x-intercept of the Nyquist plot is 7.03 Ω. On the other hand, the equivalent series resistance value for ionic liquid electrolyte is 80 Ω, which is much higher than that of 6 M KOH solution. The increase in ESR value may be due to the high viscosity of ionic liquid resulting in the relatively lower conductivity.


image file: c5ra00563a-f11.tif
Fig. 11 Electrochemical impedance spectra of graphene based supercapacitor, in (a) aqueous (6 M KOH) electrolyte and in (b) RTIL electrolyte.

image file: c5ra00563a-f12.tif
Fig. 12 (a) Ragone plot of power density vs. energy density of the assembled supercapacitor in 6 M KOH electrolyte, (b) Ragone plot of power density vs. energy density of the assembled supercapacitor in RTIL electrolyte.

Conclusion

In this work, hydroiodic acid (HI) has been used to synthesize reduced graphene oxide (rGO) paper, which acts as electrode for flexible supercapacitor. The structural features of the rGO are described in XRD and Raman spectroscopic analysis. The resulting rGO exhibits higher electrical conductivity (424 S cm−1) than the original GO paper. The electrochemical performance of the double layer supercapacitor has been carried out in both aqueous (6 M KOH) and non aqueous (RTIL) electrolyte. The device exhibited good electrochemical performance with the maximum specific capacitance values of 255 and 78 F g−1 at a scan rate of 10 mV s−1 in the aqueous and ionic liquid electrolytes, respectively. Moreover, supercapacitor retains almost 90% of specific capacitance after 5000 cycles, corroborating the improved electrochemical cyclic stability of the supercapacitor. The reasonable high values of Specific capacitance with high energy density and power density and as well as good cycle stability of the reduced graphene oxide (rGO) based nanocomposites certify its efficiency as supercapacitor electrode material.

Acknowledgements

The authors would like to thank the DST, New Delhi, India for financial support. The authors are also thankful to University of Calcutta for providing the instrumental facilities.

References

  1. W. Sugimoto, K. Yokoshima, K. Ohuchi, Y. Murakami and Y. Takasu, J. Electrochem. Soc., 2006, 153, A255–A260 CrossRef CAS PubMed.
  2. K. T. Nam, D. W. Kim, P. J. Yoo, C. Y. Chiang, N. Meethong, P. T. Hammond, Y. M. Chiang and A. M. Belcher, Science, 2006, 312, 885–888 CrossRef CAS PubMed.
  3. B. E. Conway, Electrochemical Capacitors: Scientific Fundamentals and Technological Applications, Kluwer, Dordrecht, The Netherlands, 1999 Search PubMed.
  4. G. An, P. Yu, M. Xiao, Z. Liu, Z. Miao, K. Ding and L. Mao, Nanotechnology, 2008, 19, 275709 CrossRef PubMed.
  5. D. W. Liu, Q. F. Zhang, P. Xiao, B. B. Garcia, Q. Guo, R. Champion and G. Z. Cao, Chem. Mater., 2008, 20, 1376–1380 CrossRef CAS.
  6. P. Simon and Y. Gogotsi, Nat. Mater., 2008, 7, 845–854 CrossRef CAS PubMed.
  7. E. R. Pinero, V. Khomenko, E. Frackowiak and F. Beguin, J. Electrochem. Soc., 2005, 152, 229–235 CrossRef PubMed.
  8. R. Kotz and M. Carlen, Electrochim. Acta, 2000, 45, 2483–2498 CrossRef CAS.
  9. A. Burke, J. Power Sources, 2000, 91, 37–50 CrossRef CAS.
  10. L. B. Hu, M. Pasta, F. L. Mantia, L. F. Cui, S. Jeong, H. D. Deshazer, J. W. Choi, S. M. Han and Y. Cui, Nano Lett., 2010, 10, 708–714 CrossRef CAS PubMed.
  11. L. Wen-Wen, Y. Xing-Bin, L. Jun-Wei, P. Chao and X. Qun-Ji, J. Mater. Chem., 2012, 22, 17245 RSC.
  12. L. B. Hu, W. Chen, X. Xie, N. Liu, Y. Yang, H. Wu, Y. Yao, M. Pasta, H. N. Alshareef and Y. Cui, ACS Nano, 2011, 5, 8904–8913 CrossRef CAS PubMed.
  13. K. Jost, C. R. Perez, J. K. McDonough, V. Presser, M. Heon, G. Dion and Y. Gogotsi, Energy Environ. Sci., 2011, 4, 5060–5067 CAS.
  14. L. Yuan, X. H. Lu, X. Xiao, T. Zhai, J. Dai, F. Zhang, B. Hu, X. Wang, L. Gong, J. Chen, C. Hu, Y. Tong, J. Zhou and Z. L. Wang, ACS Nano, 2012, 24, 656–661 CrossRef PubMed.
  15. C. S. R. Vusa, S. Berchmans and S. Alwarappan, RSC Adv., 2014, 4, 22470–22475 RSC.
  16. H. Wang, D. Zhang, T. Yan, X. Wen, L. Shi and J. Zhang, J. Mater. Chem., 2012, 22, 23745–23748 RSC.
  17. J. P. C. Trigueiro, R. L. Lavall and G. G. Silva, J. Power Sources, 2014, 256, 264–273 CrossRef CAS PubMed.
  18. J. Yang and L. Zou, Electrochim. Acta, 2014, 130, 791–799 CrossRef CAS PubMed.
  19. D. Zhang, X. Wen, L. Shi, T. Yan and J. Zhang, Nanoscale, 2012, 4, 5440–5446 RSC.
  20. Z. Fan, J. Yan, L. Zhi, Q. Zhang, T. Wei, J. Feng, M. Zhang, W. Qian and F. Wei, Adv. Mater., 2010, 22, 3723–3728 CrossRef CAS PubMed.
  21. H. Wang, L. Shi, T. Yan, J. Zhang, Q. Zhong and D. Zhang, J. Mater. Chem. A, 2014, 2, 4739–4750 CAS.
  22. X. Chen, K. Kierzek, K. Cendrowski, I. Pelech, X. Zhao, J. Feng, R. J. Kalenczuk, T. Tang and E. Mijowska, Colloids Surf., A, 2012, 396, 246–250 CrossRef CAS PubMed.
  23. C. S. Yong and T. S. Edward, Nano Lett., 2008, 8, 1679 CrossRef PubMed.
  24. Y. K. Tae, W. L. Hyun, S. Meryl, R. D. Daniel, W. B. Christopher, S. R. Rodney and S. S. Kwang, ACS Nano, 2011, 5, 436 CrossRef PubMed.
  25. T. Welton, Chem. Rev., 1999, 99, 2071–2083 CrossRef CAS PubMed.
  26. R. P. Swatloski, S. K. Spear, J. D. Holbrey and R. D. Rogers, J. Am. Chem. Soc., 2002, 124, 4974–4975 CrossRef CAS PubMed.
  27. Y. Xu, K. Sheng, C. Li and G. Shi, J. Mater. Chem., 2011, 21, 7376 RSC.
  28. W. S. Hummers and R. E. Offeman, J. Am. Chem. Soc., 1958, 80, 1339 CrossRef CAS.
  29. L. Z. Fan and J. Maier, Electrochem. Commun., 2006, 8, 937–940 CrossRef CAS PubMed.
  30. Z.-S. Wu, W. C. Ren, L. B. Gao, J. P. Zhao, Z. P. Chen, B. L. Liu, D. M. Tang, B. Yu, C. B. Jiang and H.-M. Cheng, ACS Nano, 2009, 3, 411–417 CrossRef CAS PubMed.
  31. S. Korkut, J. D. Roy-Mayhew, D. M. Dabbs, D. L. Milius and I. A. Aksay, ACS Nano, 2011, 5, 5214–5222 CrossRef CAS PubMed.
  32. X. L. Li, G. Y. Zhang, X. D. Bai, X. M. Sun, X. R. Wang, E. Wang and H. J. Dai, Nat. Nanotechnol., 2008, 3, 538 CrossRef CAS PubMed.
  33. D. C. Marcano, D. V. Kosynkin, J. M. Berlin, A. Sinitskii, Z. Z. Sun, A. Slesarev, L. B. Alemany, W. Lu and J. M. Tour, ACS Nano, 2010, 4, 4806 CrossRef CAS PubMed.
  34. X. Tong, H. Wang, G. Wang, L. Wan, Z. Ren and J. Bai, J. Solid State Chem., 2011, 184, 982 CrossRef CAS PubMed.
  35. W. Gao, L. B. Alemany, L. Ci and P. M. Ajayan, Nat. Chem., 2009, 1, 403 CrossRef CAS PubMed.
  36. A. C. Ferrari and J. Robertson, Phys. Rev. B: Condens. Matter Mater. Phys., 2000, 61, 14095–14107 CrossRef CAS.
  37. Y. Guo, X. Sun, Y. Liu, W. Wang, H. Qiu and J. Gao, Carbon, 2012, 50, 2513–2523 CrossRef CAS PubMed.
  38. O. Akhavan and E. Ghaderia, Carbon, 2012, 50, 1853–1860 CrossRef CAS PubMed.
  39. R. Pasricha, S. Gupta and A. K. Srivastava, Small, 2009, 5, 2253 CrossRef CAS PubMed.
  40. M. D. Stoller, S. Park, Y. Zhu, J. An and R. S. Ruoff, Nano Lett., 2008, 8, 3498–3502 CrossRef CAS PubMed.
  41. B. E. Conway and W. G. Pell, J. Solid State Electrochem., 2003, 7, 637–644 CrossRef CAS PubMed.
  42. D. P. Dubal and R. Holze, Energy, 2013, 51, 407–412 CrossRef CAS PubMed.
  43. J. Yan, T. Wei, B. Shao, F. Q. Ma, Z. J. Fan, M. L. Zhang, C. Zheng, Y. C. Shang, W. Z. Qian and F. Wei, Carbon, 2010, 48, 1731–1737 CrossRef CAS PubMed.
  44. J. Yan, T. Wei, B. Shao, Z. Fan, W. Qian, M. Zhang and F. Wei, Carbon, 2010, 48, 487–493 CrossRef CAS PubMed.
  45. Q. Cheng, J. Tang, J. Ma, H. Zhang, N. Shinya and L.-C. Qin, Phys. Chem. Chem. Phys., 2011, 13, 17615–17624 RSC.
  46. Y. Chen, X. Zhang, D. C. Zhang, P. Yu and Y. W. Ma, Carbon, 2011, 49, 573–580 CrossRef CAS PubMed.
  47. C. P. Fu, Y. F. Kuang, Z. Y. Huang, X. Y. Wang, F. J. Yin, H. Chen and H. H. Zhou, J. Solid State Electrochem., 2011, 15, 2581–2585 CrossRef CAS.
  48. D. C. Zhang, X. Zhang, Y. Chen, P. Yu, C. H. Wang and Y. W. Ma, J. Power Sources, 2011, 196, 5990–5996 CrossRef CAS PubMed.

This journal is © The Royal Society of Chemistry 2015
Click here to see how this site uses Cookies. View our privacy policy here.