Zn interstitials and O vacancies responsible for n-type ZnO: what do the emission spectra reveal?†
K. Bandopadhyay* and
J. Mitra*
School of Physics, Indian Institute of Science Education and Research Thiruvananthapuram, CET Campus, Thiruvananthapuram 695016, Kerala, India. E-mail: kbandopadhyay@iisertvm.ac.in; j.mitra@iisertvm.ac.in
First published on 26th February 2015
Abstract
Zinc interstitials and their complexes with oxygen vacancies, harbouring a lone pair of electrons, have been discussed as suspects for an n-type character and the ensuing conductivity of nominally undoped ZnO. ZnO nanorods, with different Zn concentrations, have been studied using photoluminescence and photoluminescence excitation spectroscopy to evidence the presence of defect states, their correlation with excess Zn and their viability as donors. It is shown that each sample may emit intense violet-blue, green-orange and red emissions, as decided by the excitation energy and presence of excess Zn. Intensity variation of these individual emissions vis-à-vis their excitation energies, in the range 4.0–2.7 eV, indicates the presence of defect states not only within the band gap but crucially within the conduction band itself, but only in a Zn rich environment. The study provides the experimental signature of the theoretical predictions of the latter states and demonstrates why Zn interstitials may be responsible for the n-type doping and conductivity of ZnO. The origin of the emissions, their interdependence and tunability are further discussed.
1. Introduction
Its wide direct band gap (3.4 eV) and high exciton binding energy has made ZnO1 a promising candidate for varied optoelectronic applications,2,3 primary among which is its utility as a transparent but conducting medium.4,5 While most forms of undoped ZnO, at room temperature (RT), show n-type character, p-type ZnO is rarely prepared, intentionally or otherwise.1,6 The debate as to the origin of this n-type character and the associated donor states has mostly centred around two doubly occupied contenders; the oxygen vacancy (VO) states and interstitial Zn (IZn) related defect states. Understanding this origin is vital, not only for tailoring ZnO for varied applications but also to gain a basic insight into the physics of doping ZnO – even in preparing its p-type counterpart. Based on existing literature we can summarize the current understanding about the likely origin of the n-type nature of ZnO as follows. Complexes of the deep level VO and the shallower IZn states, formed by their hybridization, may be responsible for the formation of effective donor states, rather than the isolated IZn and VO defect states themselves.7–9 However, even these hybridized states may be effective donors only if they energetically lie either close to the conduction band (CB) minima, with ionization energies comparable to RT,10–13 or within the CB itself.7,14 This study investigates the role of excess Zn in forming the IZn related donor states in ZnO, as evidenced through photoluminescence (PL) and photoluminescence excitation (PLE) studies on ZnO nanorods with differential IZn density.Exciton recombination is the primary channel of PL in ZnO, where the exciton binding energy is larger than the thermal energy. Electrons excited into the CB from the valence band (VB) undergo relaxation to the conduction band minimum (CBM), which, if followed by radiative e–h recombination results in the detected PL. The momentum and energy relaxation path to the CBM is thus strongly correlated to the band structure of the system. The typical PL spectrum of ZnO shows the characteristic near-band-edge (NBE) emission in the UV, along with green-orange emission in the visible range, indicating the presence of defect states lying within the band gap.15–23 The IZn related states lying below the CBM10,14 have been shown to give rise to violet-blue emissions16 that are seldom detected in the PL spectra of ZnO, except in Zn rich conditions and for excitation energies close to, or just less than, the band-gap energy (Eg). The green-orange emissions have been attributed to transitions to and from ionized VO states, i.e.  and
and  states,21,24 which effectively manifest at surfaces, interfaces and grain boundaries.20,25
Here, ZnO nanorods with large surface to volume ratio and varying concentrations of Zn have been investigated to study the IZn related defect states through the emission properties of the nanorods. It is expected that the availability of the surface related VO defects and excess Zn in the system will create an abundance of IZn–VO complexes thus nucleating viable donor states in ZnO, resulting in its n-type character. Evolution of the PL spectra, recorded with varying excitation energy, not only confirm the presence of these IZn related states below the CBM but also provide evidence of IZn related states within the CB itself, corroborating theoretical calculations.7,9
2. Experimental details
ZnO nanorods grown by two different low temperature techniques, (i) electrochemical deposition (ZnO/ITO) and (ii) oxidation of Zn foil (ZnO/Zn), have been investigated here. The ZnO/ITO nanorods were grown on the seeded26 ITO coated glass substrates (Sigma Aldrich, 70–100 Ω sq−1) in a two-step electrochemical deposition method.27 Nanorods were grown in a 25 mM equimolar aqueous solution of zinc nitrate hexahydrate (Sigma Aldrich) and hexamethylene-tetramine (Sigma Aldrich) at 95 °C, using platinum as the counter and reference electrode. The substrate was sequentially biased at −2.73 V and −2.15 V, relative to the reference electrode, for 1 and 10 minutes respectively. After deposition, samples were rinsed in deionized water and dried at RT. ZnO nanorods with excess Zn were prepared by oxidizing a piece of zinc foil (99.99%, Alfa Aesar) immersed in deionized water containing 7% (v/v) formamide (Sigma-Aldrich), at 65 °C for 24 h.28 The as grown ZnO/Zn nanorods were washed in alcohol and deionized water, prior to drying at RT. Morphological characterization and elemental analysis of the nanorods were performed in Nova Nano SEM 450 field-emission scanning electron microscope (SEM) coupled with an Apollo X energy dispersive X-ray analysis (EDAX) system and in 200 kV TECNAI G2-TF-20 transmission electron microscope (TEM). The X-ray diffraction (XRD) data were collected using a powder X-ray diffractometer (Empyrean, PANalytical) with reference radiation of Cu Kα = 1.540 Å at an operating voltage of 45 kV and analyzed using the ICDD PDF4+ database. PL and PLE spectra were recorded for both samples using a spectrofluorometer (Fluorolog 3, Horiba Jobin-Yvon) at RT, without annealing since IZn related defects are highly mobile even at low temperatures.293. Results and discussion
SEM images of c-axis oriented, hexagonal ZnO nanorods grown on ITO and Zn foil are shown in Fig. 1(a) and (b). The ZnO/ITO nanorods are not vertically aligned and have an average diameter and length of 40 nm and 900 nm respectively (Fig. 2(a)). The ZnO/Zn nanorods, shown in Fig. 1(b), are vertically oriented and are typically 4 μm long with diameters below 400 nm (Fig. 2(b)). While the XRD spectrum for ZnO/ITO shows a dominant ZnO (002) peak, that for ZnO/Zn nanorods exhibits multiple peaks attributable to Zn (*ed) along with those from ZnO. The XRD data indicate highly oriented c-axis growth (wurtzite structure) and a high degree of crystallinity in both samples which can also be confirmed from their corresponding high resolution TEM (HRTEM) images (Fig. 2(c) and (d)) and electron diffraction (SAED) patterns (insets of Fig. 2(c)). Importantly, the purity of the samples is confirmed by the absence of impurity related diffraction peaks in the XRD pattern. SAED patterns can be indexed to the wurtzite structure of hexagonal ZnO and indicate that the nanorods grow along the [001] direction. In the HRTEM image (Fig. 2(c) and (d)), the lattice spacing of 0.52 nm also corresponds well to the interplanar distance of the (001) crystal plane of wurtzite ZnO.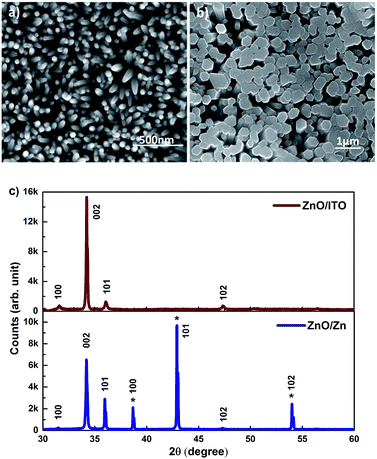 | ||
| Fig. 1 SEM images of (a) ZnO/ITO and (b) ZnO/Zn nanorods (c) XRD patterns of the respective nanorods. | ||
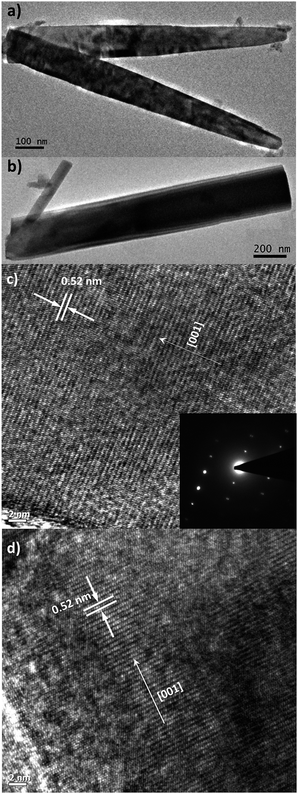 | ||
| Fig. 2 Low-resolution TEM images of (a) ZnO/ITO and (b) ZnO/Zn nanorods. High-resolution TEM images of (c) ZnO/ITO and (d) ZnO/Zn nanorods. Inset shows the SAED pattern of ZnO/ITO nanorods. | ||
Fig. 3(a) shows the EDAX spectra for ZnO/ITO and ZnO/Zn samples, recorded with a beam acceleration voltage (VA) of 15 kV. Along with the characteristic peaks for Zn and O, the former shows In, Sn and Si peaks generated from the ITO coated glass substrate. Further, EDAX spectra were recorded as a function of VA (2–20 kV) to investigate the relative variation of Zn and O with depth of the samples. Table 1 shows the relative concentration of Zn and O, obtained at 5 and 15 kV for each sample. The penetration depth of the electron beam, as a function of energy, may be estimated using the Kanaya–Okayama depth penetration formula.30 For pure ZnO, the estimated penetration depths for VA = 5 and 15 kV are 430 nm and 2.5 μm respectively. Consequently, the EDAX counts recorded with VA = 5 kV originate primarily from the nanorods with negligible contribution from the substrates, for both samples. However, for VA = 15 kV the counts arise primarily from the nanorods for ZnO/Zn but not for ZnO/ITO, where there will be a finite contribution from the substrate as well.
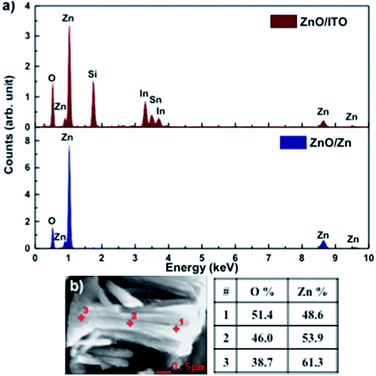 | ||
| Fig. 3 (a) EDAX spectra of ZnO/ITO and ZnO/Zn nanorods. (b) Atomic percentage of Zn and O at 3 points along the length of a ZnO/Zn nanorod, recorded at 5 kV. | ||
| Element | Atomic% (5 keV) | Atomic% (15 keV) | ||
|---|---|---|---|---|
| ZnO/ITO | ZnO/Zn | ZnO/ITO | ZnO/Zn | |
| O | 44.6 | 38.1 | 55.1 | 33.4 |
| Zn | 55.4 | 61.9 | 44.9 | 66.6 |
At 5 kV, both samples show an O deficient and Zn rich composition, though the Zn percentage is significantly higher in ZnO/Zn compared to ZnO/ITO. At 15 kV, the atomic percentage of Zn is further enhanced in the ZnO/Zn the sample – indicating diffusion from the Zn foil. The higher percentage of O observed for ZnO/ITO, at 15 kV, is likely due to contributions from ITO and glass. Fig. 3(b) shows the variation in relative density of Zn and O along the length of a ZnO/Zn nanorod, calculated by recording point EDAX spectra along the length of a horizontally placed nanorod. It bears the clear signature of excess Zn towards the base of the nanorod and further confirms that ZnO/Zn nanorods are stoichiometrically Zn rich compared to the ZnO/ITO sample.
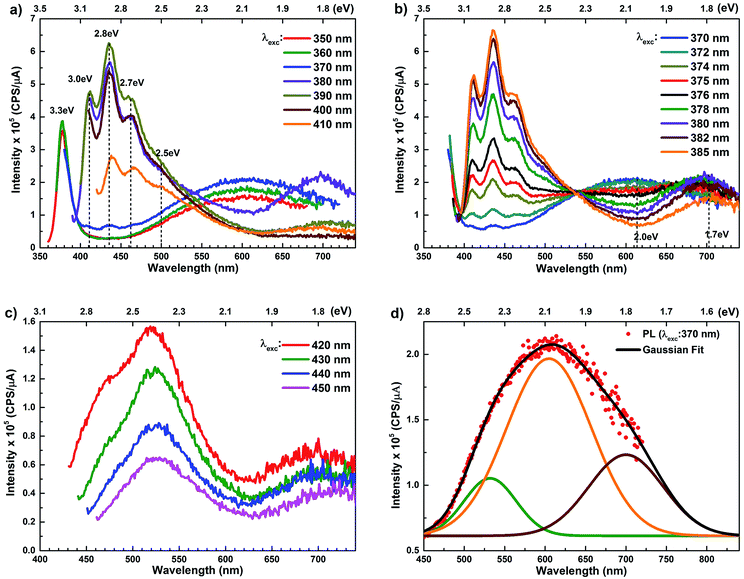
The room temperature PL spectra of ZnO/ITO nanorods, recorded with varying excitation wavelengths (λexc) and energies (Eexc) are shown in Fig. 4(a). For excitation energies larger than Eg (i.e. λexc ≤ 370 nm) the spectra shows a sharp UV peak at 377 nm (3.3 eV) due to the NBE emission and a broad band emission in the visible range, centred at 615 nm (2.01 eV), attributed to transitions to/from defect states within the band-gap.31 The NBE emission at 377 nm yields a band gap of 3.36 eV, including the excitonic correction of 60 meV for the ZnO/ITO sample. As λexc increases beyond 370 nm, the PL spectrum is substantially modified with the appearance of violet-blue emission in the spectral window 410–470 nm (Fig. 4(a) and (b)), with distinct peaks at 411 nm (3.0 eV), 435 nm (2.8 eV) and 461 nm (2.7 eV). Fig. 4(b) shows a detailed evolution of the PL spectra as λexc is systematically increases from 370–385 nm in 2 nm steps. The multi-peaked, violet-blue emission intensity grows as λexc approaches 385 nm, where the intensity maximizes and then steadily decreases for longer wavelengths. This increase in intensity, till 385 nm, is accompanied by a steady decay in the broadband emission at 615 nm and the simultaneous appearance of emission centred around 700 nm. A closer inspection reveals two other important features; firstly the spectral evolution shows a constant emission intensity (∼1.5 × 10⁵ cps μA−1) around 530 nm, irrespective of λexc, in the range 350–430 nm, indicating that the higher energy state is uniformly populated by all excitations in this range. Secondly, the spectrum corresponding to λexc = 375 nm exhibits a remarkably flat emission over the entire visible range (400–700 nm) and would serve as an ideal white light converter of UV excitation (see Fig. S1 in ESI†). For excitations with λexc > 410 nm (Fig. 4(c)), the spectra are dominated by a green emission at 530 nm, which decays with increasing λexc along with the previously evidenced emission in the red (700 nm).
The PL spectra for the Zn rich ZnO/Zn nanorods are shown in Fig. 6(a) for λexc in the range 340–410 nm. For λexc ≥ 350 nm, the NBE peak is essentially unresolved due to the dominant violet-blue emission peaks. For λexc = 340 nm, the spectrum exhibits a shoulder around 375 nm, which on spectral decomposition shows a component at 377 nm (3.3 eV), corresponding to the NBE emission (see Fig. S2 in ESI†). This contrasts with the PL spectra for ZnO/ITO, which are dominated by the NBE emission for super band-gap excitations, with the violet-blue emissions totally absent. For sub-band gap excitations, λexc ≥ 380 nm, the spectra qualitatively follow a trend similar to that observed for ZnO/ITO. The most striking similarity between the spectra obtained from each sample is that the family of violet-blue peaks is centred at the same wavelength, even as it is more intense for the Zn rich ZnO/Zn sample (see Table S1 in ESI†). It is worth noting that the appearance of the violet-blue emissions for a small range of excitation wavelengths, corresponding to energies just below Eg, in a direct band gap semiconductor is indicative of the presence of partially filled electronic states below the CBM.16
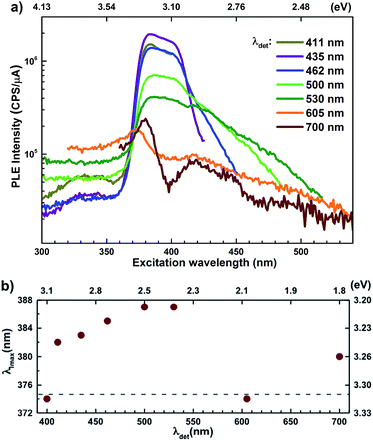
Semi-log plots of PLE spectra for ZnO/ITO are shown in Fig. 5(a) for various detection wavelengths (λdet). For λdet in the range 400–530 nm the spectra are characterized by the presence of a maximum around 382 nm extending into a plateau up to 410 nm. The spectrum for 700 nm shows two distinct peaks at 380 and 420 nm – lying on either side of the plateau evidenced above. The PLE spectra for λdet in the violet-blue range are further characterized by a small but distinct hump around 325 nm (3.75 eV). Fig. 5(b) shows a plot of the excitation wavelength at which the PLE intensity maximizes (λImax) versus the corresponding λdet. It demonstrates that the λImax can be classified into two groups: (i) those lying around 375 nm, thus matching Eg and (ii) those in the range 380–386 nm, thus showing a maximum at sub-Eg energies. While the former group corresponds to NBE and green emission, the latter corresponds to the violet-blue and the red emissions. This grouping is not accidental but points towards a commonality in their respective emission pathway, as discussed later. The PLE spectra for the Zn rich ZnO/Zn nanorods (Fig. 6(b)) stand in sharp contrast to that of ZnO/ITO, amidst several similarities. Overall, the PLE intensity decreases with increasing λexc for all λdet, unlike that of ZnO/ITO. The spectra for λdet = 380, 411 and 435 nm are distinctly characterized by a double peaked structure around 325 nm (3.81 eV), i.e. around the same λexc for which the spectra for ZnO/ITO showed a small hump. The same spectra are further characterized by edges at 382 nm (3.24 eV) and 410 nm (3.0 eV), marked by vertical arrows in the figure. The spectrum for 700 nm again shows a peak at 380 and 420 nm, similar to the observations for ZnO/ITO. Importantly, the spectrum for 700 nm is also characterized by a strong correlation with λexc ∼ 325 nm (see Fig. S3 in ESI†).
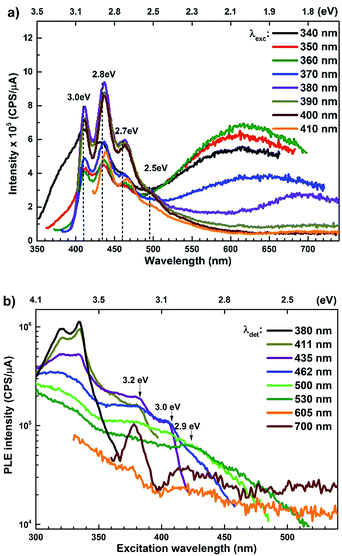 | ||
| Fig. 6 (a) Excitation dependent PL spectra and (b) PLE spectra for different emission wavelengths of ZnO/Zn nanorods. | ||
The presence of the violet-blue emissions in a single PL spectrum from an isolated sample of ZnO may only be indicative of sub-CBM localized states, but will not be conclusive proof of the same.16,18,32 However, a comprehensive analysis of the entire PL and PLE spectra as presented above and their evolution with λexc essentially corroborates the presence of these states below the CBM. Structures in the violet-blue PL emission, specifically the highest and lowest energy peaks between 400–460 nm, prove the presence of multiple localized states between 2.7–3.0 eV, above the VBM. Further, the presence of violet-blue emission for super Eg excitations, only from the Zn rich ZnO/Zn sample, and its absence in ZnO/ITO along with its enhanced intensity in the former, reinforce the understanding that these defect states originate from IZn in ZnO.10,16,23,32,33 Now, theoretical band structure calculations have shown that along with the IZn related defect states below the CBM,14,34 there also exist electronic states due to excess Zn in the energy range 3.6–4.0 eV above the VBM, essentially lying within the CB.9,14 Since IZn states carry a lone pair of electrons their presence within the CB will essentially result in ionizing the defect state  and doping the undoped ZnO. On the other hand, it is also predicted that the probability of existence of isolated IZn in the ZnO lattice and isolated VO defects is very low since their formation enthalpies are prohibitively high: ∼6 eV in the case of the former.9 Interestingly, Kim et al.7 have calculated the formation enthalpy of a complex of VO and doubly ionized
  defect as a function of their mutual separation (d) and shown that the formation enthalpy of the complex is significantly lower. The resulting hybridization between the deep level VO and the shallower IZn states raises the hybridized
  state inside the CB and lowers the hybridized VO
  state further within the band gap. The raising and lowering energies are strong functions of d. The data presented above provides an experimental signature of the existence of these IZn related states
  , within the CB; evidenced as strong PLE peaks around 325 nm (3.8 eV) in the blue-violet spectra (Fig. 6(b)) for the Zn rich ZnO/Zn sample. The weak maximum around 325 nm in ZnO/ITO’s PLE spectra (Fig. 5(a)) for the same λdet may also be of a similar origin. The relative strengths of PLE intensity, around 325 nm, are indicative of the relative abundance of IZn in the respective samples.
Now, as mentioned above, VO and IZn may exist within the ZnO lattice for a range of mutual separations and crucially in various oxidation states. Hence, following Kim et al.’s study, it is expected that each complex will generate pairs of  and
and  states differing slightly in energy from every other complex, originating from different separations. For example, a similar hybridization between doubly occupied IZn states, theoretically calculated to be lying below the CBM14 and VO would give rise to multiple localized
  states just below the CBM, as a function of the separation distance. The
  states will be raised in energy, closer to the CBM, making them viable donors in undoped ZnO. VO is the necessary partner of hybridization and is therefore equally important for the n-type doping of ZnO, not only by lowering the formation enthalpy of the complexes but also through raising the energy of the
  states, close to or within the CB itself.
Present and previous investigations16,31,32 suggest e–h recombination between these  states and the VB as the origin of violet-blue emissions, in the PL spectra. Further, the evolution of the PL spectra (Fig. 4(a) and (b) and 6(a)) for excitation energies just less than Eg shows a progressively intensifying violet-blue emission, which proves that electrons excited close to the CBM are more likely to transit to the
  levels than undergo direct excitonic e–h recombination with the VB holes. This strong coupling between the CBM and the
  states is also evidenced in the PLE spectra of ZnO/ITO for the violet-blue detection wavelengths as a slow rising edge between 370–380 nm. The corresponding spectra for ZnO/Zn (Fig. 6(b)) show a plateau over similar λexc range. Importantly, the PLE intensity for both samples is finite over this energy range, ∼100 meV below the CBM, which is comparable to the energy difference between the CBM and the highest energy
  states. Based on the above discussion, the radiative transitions between the suggested energy states of these ZnO nanorods may be reconstructed as shown in Fig. 7. The VBM is the designated zero of the energy scale and the other energies are as calculated from measurements reported in this study. It is worth mentioning that these
  states are typically localized between 100–600 meV below the CB but the presence of narrow peaks in the violet-blue PL emission suggests that they do not form an extended defect band. They appear to be a collection of localized states retaining their individual identity – which may be a signature of an array of IZn–VO complexes, of varying separation formed within the ZnO lattice.
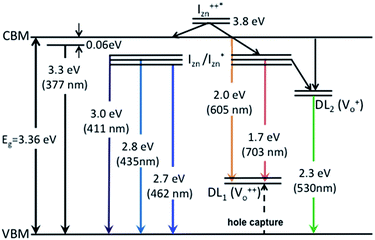 | ||
| Fig. 7 Electron band structure and transitions evidenced in the photoluminescence spectra of ZnO nanorods. | ||
The PL spectra for excitation energies smaller than Eg show a decaying peak at 615 nm (2.0 eV) simultaneously with an intensifying red emission. Interestingly, this broadband emission centred at 615 nm may be spectrally decomposed to yield three Gaussian peaks at 532 nm, 605 nm and 700 nm (Fig. 4(d)). It is noteworthy that these three peaks are evidenced in the entire PL spectra, for all λexc ranging from 280–450 nm, what changes is only their relative intensity as a function of λexc. A similar decomposition is obtained for the corresponding PL spectra for ZnO/Zn. The orange emission (605 nm) has been suggested to emanate from radiative de-excitation from the CBM to deep level states (DL1) attributed to doubly ionized VO states  ,21,24,35 which are nucleated at surfaces or grain boundaries. While the intensity of the PLE spectrum for ZnO/ITO at λdet = 605 nm (Fig. 5) shows a maximum at excitation energies matching Eg (around 374 nm), decaying for longer λexc, the corresponding PLE spectrum for ZnO/Zn shows a monotonic increase in intensity for super band-gap excitation energies (Fig. 6(b)). Both observations conform to the emission pathway suggested above, placing the DL1 states ∼2.0 eV below the CBM.
In contrast, the PLE spectra for both samples at λdet = 700 nm show two peaks at 380 and 420 nm, for sub band-gap excitation energies which favour population of the  states, but not the violet-blue emissions. Indeed the red emission decays rapidly for λexc beyond 420 nm (Fig. 4(c)), inextricably linking it to the IZn states. Importantly, the energy difference between the orange and red emission peaks is directly comparable to the energy difference between the CB minima and the
  defect states, ∼0.3 eV. Based on the above, we conclude that the red emission (700 nm) emanates from radiative de-excitation from the
  states to the same DL1 states that participate in the orange emission. It is worth reiterating that although red emission is favoured for excitation energies smaller than Eg, for ZnO/Zn it is also significant for excitation energies larger than Eg, specifically λexc ∼ 325 nm (ref. 22) (see Fig. S3 in ESI†). Though the green emission, around 530 nm, is observed in the entire PL spectra of both samples, it gains sole prominence for λexc > 420 nm (Fig. 4(c)), where the other emissions are subdued. Vanheusden et al.20 and Ye et al.24 have assigned emissions in this range with recombination of electrons from deep level isolated
  centers or
  complex levels with photo-generated holes. Here, the PL peak position is indicative of deep level defect states (DL2) typically 2.34 eV above the VBM, which are indirectly populated by electron transitions, from the CBM and IZn defect states. This is further corroborated by the PLE spectra for λdet = 510 and 530 nm for the Zn rich ZnO/Zn, which shows high emissions for super band-gap excitations, specifically at λexc ∼ 325 nm (Fig. 6(b)). Notably, Vempati et al.35 have reported detectable photoconductivity in indium doped ZnO thinfilms with a 532 nm illumination, directly addressing the DL2 states.
Direct evidence of surface related donor states have been recently confirmed through spatially resolved scanning tunneling spectroscopy measurements conducted on single crystals of ZnO.25 The detection of doubly ionizable donor states, within the investigated energy range, is consistent with the presence of IZn related states at surfaces. Similarly, spatially resolved photoconductivity studies are underway in our group to investigate the effect of IZn related defect states on the photoconductivity of the samples discussed above, especially in the Zn rich ZnO/Zn nanorods.
4. Conclusions
Highly crystalline ZnO nanorods have been synthesized via two low temperature techniques resulting in the stoichiometrically pure ZnO/ITO and Zn rich ZnO/Zn samples. The nanorods with high surface to volume ratio are naturally expected to harbour VO in the ZnO lattice. The PL spectra are shown to be highly dependent on the excitation energies vis-à-vis the defect states present in the band-gap. Excitations with energies close to or just smaller than the Eg result in strong violet-blue emissions, indicating the presence of localized states within 100 meV below the CBM, in both samples. Importantly, PL and PLE spectra provide signature of IZn related defect states lying within the CB itself, but only in the Zn rich ZnO/Zn sample and not for ZnO/ITO, in agreement with previous theoretical predictions. Since the IZn defect states carry a lone pair of electrons, their presence just below the CB and crucially within the CB will naturally impart an n-type character to the undoped ZnO. The importance of VO in conjunction with IZn in bringing about the n-type conductivity of ZnO has also been discussed in the light of recent theoretical investigations.Acknowledgements
KB and JM would like to acknowledge financial support from IISER Thiruvananthapuram. Financial support from UK India Education and Research Initiative and University Grants Commission, India is gratefully acknowledged.Notes and references
- U. Ozgur, Y. I. Alivov, C. Liu, A. Teke, M. A. Reshchikov, S. Dogan, V. Avrutin, S. J. Cho and H. Morkoc, J. Appl. Phys., 2005, 98, 041301 CrossRef PubMed.
- S. Jeon, S.-E. Ahn, I. Song, C. J. Kim, U. I. Chung, E. Lee, I. Yoo, A. Nathan, S. Lee, J. Robertson and K. Kim, Nat. Mater., 2012, 11, 301–305 CrossRef CAS PubMed.
- D. I. Son, B. W. Kwon, D. H. Park, W.-S. Seo, Y. Yi, B. Angadi, C.-L. Lee and W. K. Choi, Nat. Nanotechnol., 2012, 7, 465–471 CrossRef CAS PubMed.
- K. Bob Jin, K. Jong-Young, C. Soon-Mok and A. Sung Jin, Nanotechnology, 2014, 25, 085701 CrossRef PubMed.
- M. Wang, Y. Yang, P. Lan, K. Zhu, J. Huang, Y. Lu, R. Tan and W. Song, Phys. Status Solidi RRL, 2014, 8, 172–175 CrossRef CAS.
- S. B. Zhang, S. H. Wei and A. Zunger, Phys. Rev. B: Condens. Matter Mater. Phys., 2001, 63, 075205 CrossRef.
- Y.-S. Kim and C. H. Park, Phys. Rev. Lett., 2009, 102, 086403 CrossRef.
- R. Vidya, P. Ravindran, H. Fjellvåg, B. G. Svensson, E. Monakhov, M. Ganchenkova and R. M. Nieminen, Phys. Rev. B: Condens. Matter Mater. Phys., 2011, 83, 045206 CrossRef.
- A. Janotti and C. G. Van de Walle, Phys. Rev. B: Condens. Matter Mater. Phys., 2007, 76, 165202 CrossRef.
- D. C. Look, J. W. Hemsky and J. R. Sizelove, Phys. Rev. Lett., 1999, 82, 2552–2555 CrossRef CAS.
- J. Sann, J. Stehr, A. Hofstaetter, D. M. Hofmann, A. Neumann, M. Lerch, U. Haboeck, A. Hoffmann and C. Thomsen, Phys. Rev. B: Condens. Matter Mater. Phys., 2007, 76, 195203 CrossRef.
- A. R. Hutson, Phys. Rev., 1957, 108, 222–230 CrossRef CAS.
- A. Travlos, N. Boukos and C. Chandrinou, Phys. Status Solidi B, 2012, 249, 560–563 CrossRef CAS.
- P. S. Xu, Y. M. Sun, C. S. Shi, F. Q. Xu and H. B. Pan, Nucl. Instrum. Methods Phys. Res., Sect. B, 2003, 199, 286–290 CrossRef CAS.
- S. Vempati, J. Mitra and P. Dawson, Nanoscale Res. Lett., 2012, 7, 1–10 CrossRef PubMed.
- H. Zeng, G. Duan, Y. Li, S. Yang, X. Xu and W. Cai, Adv. Funct. Mater., 2010, 20, 561–572 CrossRef CAS.
- M. Wang, Y. Zhou, Y. Zhang, E. J. Kim, S. H. Hahn and S. G. Seong, Appl. Phys. Lett., 2012, 100, 101906 CrossRef PubMed.
- Z. Liang, X. Yu, B. Lei, P. Liu and W. Mai, J. Alloys Compd., 2011, 509, 5437–5440 CrossRef CAS PubMed.
- X. Xu, C. Xu, Z. Shi, C. Yang, B. Yu and J. Hu, J. Appl. Phys., 2012, 111, 083521–083526 CrossRef PubMed.
- K. Vanheusden, W. L. Warren, C. H. Seager, D. R. Tallant, J. A. Voigt and B. E. Gnade, J. Appl. Phys., 1996, 79, 7983–7990 CrossRef CAS PubMed.
- A. v. Dijken, E. A. Meulenkamp, D. L. Vanmaekelbergh and A. Meijerink, J. Phys. Chem. B, 2000, 104, 1715–1723 CrossRef.
- A. B. Djurišić, Y. H. Leung, K. H. Tam, Y. F. Hsu, L. Ding, W. K. Ge, Y. C. Zhong, K. S. Wong, W. K. Chan, H. L. Tam, K. W. Cheah, W. M. Kwok and D. L. Phillips, Nanotechnology, 2007, 18, 095702 CrossRef.
- K. H. Tam, C. K. Cheung, Y. H. Leung, A. B. Djurišić, C. C. Ling, C. D. Beling, S. Fung, W. M. Kwok, W. K. Chan, D. L. Phillips, L. Ding and W. K. Ge, J. Phys. Chem. B, 2006, 110, 20865–20871 CrossRef CAS PubMed.
- J. D. Ye, S. L. Gu, F. Qin, S. M. Zhu, S. M. Liu, X. Zhou, W. Liu, L. Q. Hu, R. Zhang, Y. Shi and Y. D. Zheng, Appl. Phys. A: Mater. Sci. Process., 2005, 81, 759–762 CrossRef CAS PubMed.
- H. Zheng, J. Kröger and R. Berndt, Phys. Rev. Lett., 2012, 108, 076801 CrossRef.
- L. E. Greene, M. Law, D. H. Tan, M. Montano, J. Goldberger, G. Somorjai and P. Yang, Nano Lett., 2005, 5, 1231–1236 CrossRef CAS.
- Y.-Y. Lin, C.-W. Chen, W.-C. Yen, W.-F. Su, C.-H. Ku and J.-J. Wu, Appl. Phys. Lett., 2008, 92, 233301–233303 CrossRef PubMed.
- Z. Zhang, H. Yu, X. Shao and M. Han, Chem.–Eur. J., 2005, 11, 3149–3154 CrossRef CAS PubMed.
- P. Erhart and K. Albe, Appl. Phys. Lett., 2006, 88, 201918 CrossRef PubMed.
- K. Kanaya and S. Okayama, J. Phys. D: Appl. Phys., 1972, 5, 43 CAS.
- B. Cao, W. Cai and H. Zeng, Appl. Phys. Lett., 2006, 88, 161101–161103 CrossRef PubMed.
- C. H. Ahn, Y. Y. Kim, D. C. Kim, S. K. Mohanta and H. K. Cho, J. Appl. Phys., 2009, 105, 013502–013505 CrossRef PubMed.
- S. A. M. Lima, F. A. Sigoli, M. Jafelicci Jr and M. R. Davolos, Int. J. Inorg. Mater., 2001, 3, 749–754 CrossRef CAS.
- P. Erhart, K. Albe and A. Klein, Phys. Rev. B: Condens. Matter Mater. Phys., 2006, 73, 205203 CrossRef.
- S. Vempati, S. Chirakkara, J. Mitra, P. Dawson, K. K. Nanda and S. B. Krupanidhi, Appl. Phys. Lett., 2012, 100, 162104 CrossRef PubMed.
Footnote |
| † Electronic supplementary information (ESI) available. See DOI: 10.1039/c5ra00355e |
| This journal is © The Royal Society of Chemistry 2015 |

