Yakub Fama and
Toyoko Imae*ab
aDepartment of Chemical Engineering, National Taiwan University of Science and Technology, 43 Section 4, Keelung Road, Taipei 10607, Taiwan, Republic of China. E-mail: imae@mail.ntust.edu.tw
bGraduate Institute of Applied Science and Technology, National Taiwan University of Science and Technology, 43 Section 4, Keelung Road, Taipei 10607, Taiwan, Republic of China
First published on 21st January 2015
Platinum nanoparticles (PtNPs) protected by dendrimer were incorporated in calcium phosphate particles, and the degradation of a pollutant, formaldehyde (HCHO), in water was investigated by using the resultant composite powders as a catalyst. The reaction was performed with dissolved oxygen from air as an oxidant. The analytical results revealed that high PtNP and HCHO concentrations and a high temperature effectively accelerated the oxidation of HCHO. The results were also kinetically analyzed using the Elovich equation. Additionally, the complete oxidation process of HCHO could be concluded to depend on the adsorption process of HCHO on the catalyst. The present system is a valuable catalyst for use with atmospheric oxygen at atmospheric pressure and at mild temperatures, and more importantly this catalytic system can easily be removed from the reaction solution.
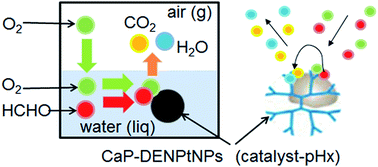
The use of a catalyst is an alternative and promising solution for all the foregoing issues, since catalytic reactions can be carried out under mild operating conditions, by eliminating the use of additives and the subsequent generation of by-products. Nevertheless, there is only a limited number of reports concerning the catalytic oxidative degradation of HCHO in an aqueous solution,13,16,26–29 that is, oxidation using metal compound or composite catalysts at high temperatures (150–200 °C) and in the presence of excess air or O213,26,27 and degradation in an O2-saturated solution or under O3 flow at 25 °C by utilizing a metal oxide catalyst.16,29 However, it should be noted that in these procedures demanding excess or enough oxidizing agents, the low solubility of O2 at atmospheric pressure might reduce the oxidation rate.28
It is necessary for catalysts such as those described above to be recovered/removed from the effluent after the reaction. On the other hand, the catalysts can be created as a system, which can be easily separated from the effluent using a catalyst-supporting matrix; the mass transfer effects in the oxidation of HCHO at a mild temperature (75 °C) have been examined using a Pt catalyst mounted on a porous polymer and under air flow, although the degradation of HCHO was low (41%).28 Therefore, there is a demand for the development of Pt-mounting catalytic systems.
Pt nanoparticles protected by dendrimers (DENPtNPs) have been loaded on carbon nanotubes30,31 and used as a catalyst for the methanol oxidation reaction.32 DENPtNPs have also been embedded in mesoporous particles consisting of calcium phosphate (CaP)33 as an analog of a dendrimer porogen.34 Therefore, CaP plays a role in supporting the Pt catalyst in a novel composite consisting of CaP and DENPtNPs (CaP–DENPtNP composite). The aim of the present study was to investigate the catalytic performance of the CaP–DENPtNP composites. Moreover, other variables, such as the PtNPs content, HCHO concentration, reaction temperature, and preparation pH were examined so as to explore the kinetics of these catalytic systems. The as-prepared catalytic system achieves the effective catalytic decomposition of HCHO in water at a low temperature and under atmospheric pressure.
DENPtNPs were prepared according to the previously reported procedure.31,32 Na2PtCl6 was added to an aqueous DEN solution. After stirring for 3 days, a reducing agent, NaBH4, in a NaOH solution was added and stirred for 1 day. CaP–DENPtNP composite powders were synthesized using the hydrothermal method.33 Typically, an aqueous DENPtNP solution was mixed with an aqueous (NH4)2HPO4 solution and stirred for 3 h. Subsequently, an aqueous Ca(NO3)2 solution was added with vigorous stirring, and the mixed solutions were adjusted to pH 12, 8, and 4. The resultant precipitates were then annealed in an autoclave at 150 °C for 15 h, and the powders were separated by centrifugation, rinsed and dried. These composites are described as catalyst-pHx (x = 12, 8, 4) hereafter. The optimization of the formation of the CaP–DENPtNP composites and their characterization have been investigated by means of transmission electron microscopy, dynamic light scattering, laser Doppler electrophoresis, Fourier transform infrared absorption spectroscopy, energy dispersive X-ray spectroscopy, thermogravimetric analysis, wide-angle X-ray diffraction, small angle X-ray scattering, and surface area analysis.33
The solution (with an initial HCHO concentration of 4.7 ppm) after the reaction (of ESI Scheme S1†) exhibited an absorption band at 412 nm (see Fig. S1†), and this band was hereafter utilized as an indicator band to determine the HCHO concentration. Incidentally, the CA solution had no absorption band in the measured wavelength region, and this solution was hereafter used as a reference solution. When the absorbance at 412 nm was plotted against the HCHO concentration, a linear relationship with an adequate correlation coefficient of 0.996 was obtained between them (see Fig. S2†).
In order to verify the effectiveness of a CaP–DENPtNP catalyst, the catalytic performance was compared to that of the control (without the catalyst) and the CaP (without PtNPs) particle. The results (Fig. 1) showed that while the control and the CaP particle did not exhibit any catalytic activity in the degradation of HCHO, the catalyst-pH8 demonstrated activity. Since the control showed a slight decrease in HCHO weight (by 3.8 wt%) over the 48 h reaction, possibly due to the evaporation of HCHO, this value then needed to be subtracted from all of the other samples. Therefore, the decomposition of HCHO was 3.0 wt% for a CaP particle and 41.8 wt% for catalyst-pH8 after the 48 h reaction. These results suggest that the PtNPs play a key role in oxidative HCHO degradation.
![]() | ||
Fig. 1 Effects of stirring and crushing in a mortar on HCHO decomposition at a catalyst-pH8![]() ![]() ![]() ![]() |
The investigation of the oxidation of HCHO was also performed to study the effects of stirring on the HCHO solution and of crushing the catalyst in a mortar. The results shown in Fig. 1 signified that stirring considerably accelerated the oxidation of HCHO. The decomposition of HCHO over the 48 h reaction under stirring reached 34.1 wt%, while it was only 11.3 wt% without stirring. This is because HCHO and O2 are frequently brought into close proximity on the surface of the catalyst under stirring and the dissolution of oxygen from the air in water is also promoted. However, the speed of stirring and the crushing of the catalyst in a mortar were not influential. Hereafter, catalysts crushed in a mortar were used for the oxidation reaction under stirring at 750 rpm.
Using the optimum amount of catalyst is also of high importance in order to get a highly effective result. For this purpose, the amount of catalyst-pH8 was varied against the concentration of HCHO. The results shown in Fig. 2(A) indicated that increasing the amount of the catalyst gave an increase in HCHO decomposition during the oxidation process. The amounts of HCHO decomposed over the 48 h reaction were 23.5, 45.6 and 51.5 wt% for catalyst-pH8:
HCHO = 0.5
:
1, 2
:
1, and 4
:
1, respectively. This tendency is reasonable, because a larger amount of catalyst provides a greater number of active sites, where the reaction takes place easily, and thus the reaction is faster. However, the tendency is almost saturated above a molar ratio of 2
:
1, as seen in Fig. 2(B).
![]() | ||
Fig. 2 (A) Effect of the catalyst concentration on HCHO decomposition. (B) A plot of HCHO decomposition against the molar ratio of catalyst-pH8![]() ![]() |
The HCHO decomposition experiments in Fig. 3 were performed at 25 °C in an HCHO solution (with an initial concentration of 10 ppm) using catalyst-pHx at a PO43−:
NH2 molar ratio of 1
:
1. Catalyst-pH4 presented the highest catalytic activity (93.7 wt% after 48 h) in the decomposition of HCHO, whereas the activity of catalyst-pH12 (69.4 wt% after 48 h) was lower than that of catalyst-pH4 but unexpectedly higher than that of catalyst-pH8 (45.6 wt% after 48 h). The PtNPs should play a key role as a catalyst in the decomposition of HCHO. Therefore, catalyst-pH4 is able to decompose the most HCHO molecules in the system due to its very high PtNPs content (60.2 wt%).33 However, the trend in increasing HCHO decomposition from catalyst-pH8 to catalyst-pH12 was inconsistent with the trend in PtNPs content. Namely, catalyst-pH8 possessed a higher PtNPs content (17.4 wt%) than catalyst-pH12 (15.2 wt%).33 Consequently, it is obvious that other factors, besides PtNPs content, affect HCHO oxidation. According to a previous report,33 the surface area (105.0 m2 g−1) of catalyst-pH12 is higher than that of catalyst-pH8 (83.4 m2 g−1), which is consistent with the trend in the activity performance for HCHO oxidation. Therefore, the surface area can be another key factor controlling the oxidation reaction, since the most HCHO and O2 can adsorb on catalyst-pH12 but the adsorbed amount decreases from catalyst-pH12 and catalyst-pH8 to catalyst-pH4 (surface area = 62.2 m2 g−1).33 Therefore, the catalytic performance should reflect the competing effects of the PtNPs content and the surface area. Thus the catalytic performance was in the order of catalyst-pH4 > catalyst-pH12 > catalyst-pH8.
![]() | ||
Fig. 3 Effect of the catalyst species on HCHO decomposition using catalyst-pHx for reaction solutions at a PO43−![]() ![]() ![]() ![]() |
In order to confirm the effect of the PtNPs on the degradation of HCHO, the molar ratio between PO43− from the CaP precursors and the NH2 groups from the dendrimers in the DENPtNPs nanoparticles was varied between 0.3:
1 and 3
:
1, for comparison with Fig. 3 at 1
:
1 catayst-pHx. As the concentration of the PO43− precursors decreased, namely, the relative concentration of NH2 groups in DENPtNPs increased, the relative number of PtNPs consequently increased (for example, 5.1, 17.1 and 32.0 wt% in 3
:
1, 1
:
1, and 0.3
:
1, respectively, for catalyst-pH8).33 Therefore, Fig. 3 and 4 indicate that the HCHO decomposition was accelerated as a result of the quantitative increase in PtNPs, although the acceleration was always in the order of catalyst-pH4 > catalyst-pH12 > catalyst-pH8, for the reasons described above. In addition, Table 1 points out that catalyst-pHx achieved 96 wt% decomposition of HCHO under the experimental conditions of a 0.3
:
1 molar ratio, and that such high degradation was achieved at 24, 48 and 8 h by catalysts of x = 12, 8 and 4, respectively.
![]() | ||
Fig. 4 Effect of the PO43−![]() ![]() |
PO43−![]() ![]() |
Co (ppm) | T (°C) | Decomposed HCHO (wt%) at 48 h | Saturation time (h) | ||||
---|---|---|---|---|---|---|---|---|
Catalyst-pH12 | Catalyst-pH8 | Catalyst-pH4 | Catalyst-pH12 | Catalyst-pH8 | Catalyst-pH4 | |||
3![]() ![]() |
10 | 25 | 42.2 | 31.5 | 52.8 | |||
1![]() ![]() |
10 | 25 | 69.9 | 45.6 | 91.8 | |||
0.3![]() ![]() |
10 | 25 | 95.6 | 95.9 | 95.3 | 24 | 48 | 8 |
1![]() ![]() |
100 | 25 | 85.6 | 67.9 | 98.7 | 48 | ||
1![]() ![]() |
1000 | 25 | 97.0 | 89.2 | 99.9 | 48 | 24 | |
1![]() ![]() |
10 | 40 | 85.4 | 65.1 | 97.5 | 16 | ||
1![]() ![]() |
10 | 75 | 96.8 | 95.5 | 98.6 | 16 | 24 | 4 |
The effect of different HCHO concentrations on HCHO oxidation was also studied. Fig. 3 and 5 and Table 1 showed that increasing the HCHO concentration resulted in the fast decomposition of HCHO. It has been reported that an increase in HCHO concentration lowers the surface tension of the reaction liquid, which in turn brings favorable effects in terms of the mass transfer of O2 to the catalyst surface and thus promotes the oxidation reaction.28 In the present case, equally, the decrease in the surface tension in the solution of high HCHO concentration promotes the dissolution of a large amount of O2 gas and causes a large number of O2 molecules to bind with HCHO on the catalyst, allowing the total oxidation process producing CO2 and H2O. Besides, Fig. 3 and 5 also substantiate the effects of the catalysts by showing that the highest decomposition of HCHO was by catalyst-pH4, while catalyst-pH8 exhibited the lowest activity, similar to the effect of the PtNPs described above. Table 1 indicates that the catalytic reaction by catalyst-pH4 achieved 100 wt% decomposition within 24 h at a 1000 ppm HCHO concentration and 99 wt% decomposition after 48 h at a 100 ppm HCHO concentration.
![]() | ||
Fig. 5 Effect of the initial HCHO concentration on HCHO decomposition using catalyst-pHx for reaction solutions at a PO43−![]() ![]() ![]() ![]() |
Since the temperature is also one of the key factors in the chemical reaction, a study of the activity of the system in HCHO degradation was performed at different temperatures. Fig. 3 and 6 and Table 1 point out that the elevated temperature of the system sped up the decomposition of HCHO. This is due to the high frequency of collisions between reactants on the catalyst and the increasing kinetic energy as the temperature rises, resulting in accelerated degradation. Table 1 also shows that catalyst-pH4 decomposed the most HCHO and that catalyst-pH8 decomposed the least, which is consistent with the cases reported above. It should also be noted that the fastest accomplishment of the decomposition reaction at 75 °C was reached after 16, 24, and 4 h by catalyst-pH12, catalyst-pH8 and catalyst-pH4, respectively, while the decomposition at 40 °C was achieved after 16 h by catalyst-pH4 but not even after 48 h by catalyst-pH12 and catalyst-pH8.
![]() | ||
Fig. 6 Effect of the temperature on HCHO decomposition using catalyst-pHx for reaction solutions (with an initial concentration of 10 ppm) at a PO43−![]() ![]() ![]() ![]() |
The detailed mechanism is illustrated in Scheme 1, beginning with the dissolution of O2 gas from the atmosphere into the HCHO solution. Both molecules of dissolved O2 and HCHO in the solution are then adsorbed onto the catalyst active sites of the PtNP surface, where the complete oxidation of HCHO by O2 happens to generate CO2 and H2O. The intermediate product, HCOOH, was neglected in this case, because the consumption rate of HCOOH was very high in comparison with the rate of its formation.29 Although the presence of a stabilizer (methanol) in an aqueous HCHO solution cannot be ignored, it was considered as a refractory species throughout the reaction because of its non-oxidized characteristic.13 The high activation energy of methanol between 395.0 and 478.6 kJ mol−1 in the temperature range of 450–550 °C and at a pressure of 246 bar38 makes it hard for this compound to be oxidized, especially under the mild conditions of the present experiment.
Diffusion: O2 in bulk gas → dissolved O2 in liquid |
Adsorption: HCHO + catalyst → HCHO–catalyst |
Surface reaction: HCHO–catalyst + dissolved O2 → CO2↑ + H2O + catalyst |
In order to form kinetic equations, it is crucial to initially determine the rate-determining step in the above reactions, starting from the diffusion process of O2. The dissolution of a gas into a liquid through a gas–liquid interfacial area (a diffusion process) depends on the stirring of the liquid, and the mass transfer of the dissolved gas to the external surface of the catalyst depends on the size of the catalyst particle.28 Since the variation in the stirring speed did not have any significant effect on the reaction rate (Fig. 1), the diffusion was a very fast process, so it was not taken as the rate-determining step. Therefore, the rate-determining step will be either the surface reaction, where the complete oxidation process takes place, or the adsorption of HCHO onto the active sites of the catalyst. These steps are related to the PtNPs content in the catalysts and the surface area of the catalysts, and these competitive contributions are apparent from the comparison of the oxidation performance by catalysts prepared at different pH values, as described above.
It was first assumed that the surface reaction is the rate-determining step, and quantitative analysis was carried out using the procedure that follows.13 Since the O2 molecule used in this experiment comes from the gas phase atmosphere, the order of the reaction with respect to excess O2 can be assumed to be zero and the complete oxidation of HCHO is analyzed using a first-order reaction equation, as follows:
![]() | (1) |
![]() | (2) |
The experimental results of HCHO concentration versus time were replotted based on eqn (2) and each trend line was subsequently drawn. Although eqn (2) had to be a linear curve coming across the origin (0,0), the accuracies (R2 values) of the plots were rather low (see Fig. S3†). Hence, the first assumption was regarded to be invalid.
Next, the adsorption of HCHO on the surface of the catalyst was considered to be the rate-determining step, and quantitative analysis was carried out based on the procedure that follows.39 The adsorption of HCHO on the catalyst surface was analyzed using an Elovich equation, which is generally expressed as:
![]() | (3) |
![]() | (4) |
To simplify the equation, it was assumed that γβt ≫ 1 and eqn (4) was linearized, resulting in:
![]() | (5) |
The experimental results of the HCHO concentration versus time were replotted based on eqn (5) and each trend line was subsequently drawn (Fig. 7–9). The linearity was approved with high accuracies (R2 values). Then the γ value was calculated as an inverse of the tilt of the resulting lines and the β value was obtained from their intercept, as listed in Table 2.
PO43−![]() ![]() |
Co (ppm) | T (°C) | β (ppm h−1) | γ | ||||
---|---|---|---|---|---|---|---|---|
Catalyst-pH12 | Catalyst-pH8 | Catalyst-pH4 | Catalyst-pH12 | Catalyst-pH8 | Catalyst-pH4 | |||
3![]() ![]() |
10 | 25 | 1.49 | 0.889 | 3.79 | 1.02 | 1.44 | 1.03 |
1![]() ![]() |
10 | 25 | 3.46 | 1.82 | 4.53 | 0.683 | 1.12 | 0.470 |
0.3![]() ![]() |
10 | 25 | 14.3 | 3.79 | 50.8 | 0.532 | 0.433 | 0.527 |
1![]() ![]() |
100 | 25 | 32.8 | 22.6 | 86.1 | 0.0544 | 0.0754 | 0.0499 |
1![]() ![]() |
1000 | 25 | 299 | 198 | 1670 | 0.00425 | 0.00477 | 0.00491 |
1![]() ![]() |
10 | 40 | 69.9 | 1.05 | 13.6 | 0.406 | 0.542 | 0.394 |
1![]() ![]() |
10 | 75 | 421 | 2.83 | 2150 | 0.793 | 0.361 | 0.837 |
Table 2 shows that the β value increased by between 2.5 times and two orders of magnitude in the order of catalyst-pH8 < catalyst-pH12 < catalyst-pH4, reflecting the variation of reaction as seen in Fig. 3–6, whereas the γ value decreased in this order but the decrease was at most 1/2.4. Table 2 also revealed the variation of the β and γ values along with some elevated variables, such as the molar ratio of PO43−:
NH2 (that is, the PtNPs content), initial HCHO concentration, and reaction temperature: the β values increased by more than two orders of magnitude within the present variation of these variables, especially of HCHO concentration and temperature, although the remarkable (two orders of magnitude) decrease in the γ values was obtained by the variation of the initial HCHO concentration.
The trends, described above, in the β and γ values for each variable can be compared with those in previous reports. The Elovich equation has been used to analyze the sorption kinetics of copper(II) as the catalyst onto peat at various concentrations of peat40 and to elucidate the sorption of cadmium ions onto bone char.41 The outcomes related to the Elovich parameters indicated that the increase in concentration of the peat dose40 or cadmium solution41 caused the β value to increase but the γ value to decrease. It has been also reported that a rise in temperature commonly induces the β value to increase and γ value to decrease.42 Although the present results are along the lines of the previous analyses, it should especially be noted that the β value (initial adsorption rate) was most significantly influenced by the catalyst species, initial HCHO concentration and reaction temperature, whereas the γ value (Elovich constant) was most notably affected by the initial HCHO concentration.
The complete oxidation process of HCHO to produce CO2 and H2O in the current research depended on the adsorption process of HCHO onto the active sites of PtNPs, which was successfully described by the Elovich equation with high correlation coefficients. Differences in the reaction rate were remarkably characterized by the catalyst-production pH, with the catalytic activation order of catalyst-pH4 > catalyst-pH12 > catalyst-pH8, which was kinetically substantiated by the trends in the Elovich parameters, namely the increasing β value and decreasing γ value. The reaction rate and the β and γ values were also most strongly influenced by the HCHO concentration and by the reaction temperature.
The key factors in utilizing the CaP–DENPtNP composite as the catalyst in the degradation of HCHO were the surface area and the PtNPs content. In particular, for the composites prepared under acidic conditions, the predominant PtNPs content (60 wt%)33 influenced the catalytic reaction, even though having the lowest surface area of the composites33 may have depressed the reaction. On the other hand, the surface area was advantageous to the composite prepared under alkaline conditions, although its lower PtNPs content34 was the negative factor.
Compared to the previous reports concerning to the catalytic oxidative degradation of HCHO in an aqueous solution (see Table 3), the present investigation proposes an advantageous procedure, where the reaction is operated at atmospheric air pressure and mild temperatures and almost 100% decomposition can be achieved.
Catalyst | Removal (%) | Oxidant | Temperature (°C) | Reaction time (h) | Year | Reference |
---|---|---|---|---|---|---|
Ru/Ce | 96 | 1 MPa (air) | 150 | 1 | 1988 | 26 |
Cu(NO3)2 | 24 | |||||
CuO–ZnO/Al2O3 | 80 | 1.5 MPa (O2) | 200 | 3 | 2003 | 13 |
CeO2, Ag/Ce | 55 | 1.5 MPa (O2) | 200 | 3 | 2003 | 27 |
Co/Ce | 70 | |||||
Mn/Ce | 99 | |||||
Nix(OH)yOz·mH2O | 90 | Continuous flow (air) | 25 | 2.5 | 2002 | 29 |
MgO | 79 | 0.153 g L−1 min−1 (O3) | 25 | 2.5 | 2009 | 16 |
Pt on porous polymer | 41 | 0.24 L min−1 (air) | 75 | 2.5 | 2001 | 28 |
CaP–DENPtNPs | 95 | Atmospheric air | 25 | 8 | Present | |
99 | 75 | 4 |
Footnote |
† Electronic supplementary information (ESI) available. See DOI: 10.1039/c5ra00353a |
This journal is © The Royal Society of Chemistry 2015 |