
 Open Access Article
 This Open Access Article is licensed under a
 Creative Commons Attribution 3.0 Unported Licence
Synthesis and morphological characterization of phenyl-modified macroporous–mesoporous hybrid silica monoliths
Rafael
Meinusch
a,
Kristof
Hormann
b,
Romana
Hakim
ac,
Ulrich
Tallarek
*b and
Bernd M.
Smarsly
*a
aInstitute of Physical Chemistry, Justus-Liebig-Universität Giessen, Heinrich-Buff-Ring 58, 35392 Giessen, Germany. E-mail: bernd.smarsly@phys.chemie.uni-giessen.de; Fax: +49-641-99-34509; Tel: +49-641-99-34590
bDepartment of Chemistry, Philipps-Universität Marburg, Hans-Meerwein-Strasse, 35032 Marburg, Germany. E-mail: tallarek@staff.uni-marburg.de; Fax: +49-6421-28-27065; Tel: +49-6421-28-25727
cThermo Fisher Scientific, Am Kalkberg, 37520 Osterode am Harz, Germany
First published on 6th February 2015
Abstract
Compared with pure silica-based or organic-polymer monoliths, hybrid organic-silica monoliths offer the combined advantages of mechanically strong stationary phases, simpler preparation protocols, resistance to swelling and shrinking in many solvents and better pH stability. Comprehensive data on the systematic characterization of the pore space morphology of hybrid organic-silica monoliths and their connection to pure silica-based monoliths are still scarce in the literature. In this work, we adapted the general sol–gel procedure with phenyltrimethoxysilane and tetramethoxysilane as precursors to prepare phenyl-modified macroporous–mesoporous silica monoliths via spinodal decomposition involving poly(ethylene glycol). Effects of polycondensation temperature and poly(ethylene glycol) amount were investigated with respect to the corresponding macropore space morphology. We characterized the monoliths by thermogravimetric analysis and infrared spectroscopy (phenyl-modification), nitrogen physisorption and scanning electron microscopy (meso- and macropores) as well as confocal laser scanning microscopy for three-dimensional reconstruction of the macropore space morphology. The statistical analysis of a reconstruction by chord length distributions allowed us to assess the monoliths macropore space heterogeneity through a quantitative approach. Relying exclusively on image analysis, we provide an accurate and model-free description of the void space distribution. Complementary macroporosity profiles were recorded to identify macroscopic heterogeneities inside a monolith. Analyzed structural features are connected to key transport properties of the macropore space. Phenyl-modified monoliths from this work were compared with previous pure silica-based and hybrid organic-silica monoliths regarding the bulk homogeneity of the monoliths and the critical wall region in capillary column format. The comparison with a conventional C18-silica monolith demonstrated a selectivity tuning with the phenyl-modified silica monoliths by π–π-interactions between the stationary phase and aromatic analytes. Application of the phenyl-modified monoliths in capillary liquid chromatography reflected the selectivity behaviour of commercial phenyl-modified silica particles, but with the advantage of a higher separation efficiency for the monolithic stationary phase.
1. Introduction
Macroporous–mesoporous silica monoliths with a hierarchical pore space architecture of interskeleton macropores and intraskeleton mesopores have attracted increased attention in the past due to the combination of good mass transport properties (high hydraulic permeability of the macropore space, low diffusional resistance in the mesoporous skeleton) with large surface areas in a continuous stationary-phase support structure that, in addition, is available in a well-defined macroscopic format, e.g., as a bare disc or rod as well as in columns of different dimensions.1–12The more flexible combination of the interskeleton macroporosity with the intraskeleton mesoporosity is a decided advantage of the silica-based monoliths over particulate packings regarding the use as stationary phase in separation science, adsorption technology and catalysis.5,6,13–16 As a common feature, the macropore space of the silica monoliths enables advection-dominated transport by fluid flow, whereas the mesopore space provides the surface area accessible by pore diffusion.
Besides a flexible adjustment of macro- and mesoporosity in the silica monoliths, in general, hybrid organic-silica monoliths have moved into the research focus,17–19 because they combine several advantages over the pure silica-based or the pure organic-polymer monoliths: (i) they allow to introduce in situ a variety of organic functionalities (thus eliminating a post-functionalization), which provide a wide range of specific analyte–surface interactions for separation and catalysis; (ii) they largely retain a high mechanical stability typical for the pure silica-based monoliths, but with a more flexible (less brittle) skeleton that can better withstand the physical stress and deformation during the shrinkage and lead to a more homogeneous macropore space morphology;20–22 and (iii) they show improved solvent and pH stability.
Hybrid organic-silica monoliths have realized a variety of organic functionalities and can be prepared in capillaries by a number of synthetic routes.17–19 In the capillary format hybrid organic-silica monoliths have been mainly applied in high-performance liquid chromatography (HPLC) and electrochromatography,17–24 while their use as support structure in catalysis and for bioreactors is still developing.13–16,25,26 For a targeted optimization of monolith performance we have to know how preparation protocol and mass transport properties are related. We need to establish analytical approaches that will enable material scientists to systematically improve macro- and mesopore space morphologies and identify the morphological features that cause mass-transfer limitations, by changing specific parameters in the monolith synthesis and comparing the resulting morphologies.27
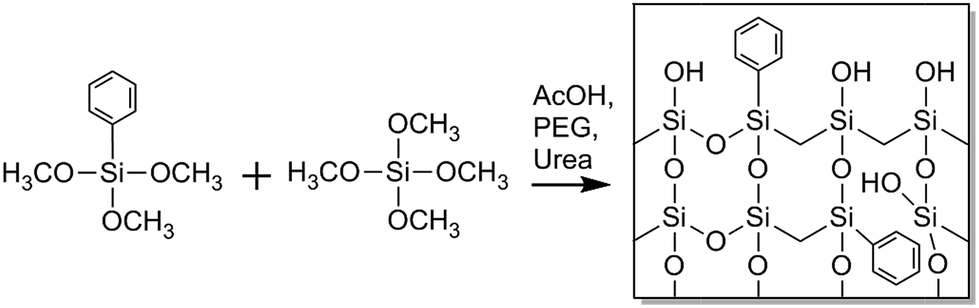
In this article we report on the preparation and morphological characterization of a hybrid organic-silica type monolith featuring a bimodal macro–mesoporosity. For its synthesis we adapted the general sol–gel process with phase separation.3,17 The procedure was implemented to prepare phenyl-modified silica monoliths by use of phenyltrimethoxysilane (PTMS) and tetramethoxysilane (TMOS) as precursors as well as poly(ethylene glycol) (PEG) in a formation sequence via spinodal decomposition.28 During the competition between the sol–gel transition and the simultaneous phase separation induced by PEG (into a hydrogel and a solvent phase), the structure is at some point frozen due to the advancing polycondensation of the silica oligomers, leading to a bimodal macroporous–microporous monolith. By treatment with alkaline solution, mesopores are then introduced into the silica skeleton, providing PTMS–TMOS based macroporous–mesoporous hybrid silica monoliths. Since the phenyl groups are directly attached to silicon in the silane, they do not react in the course of hydrolysis and condensation reactions and are thus distributed throughout the bulk and at the surface of the monolith skeleton, as indicated with Scheme 1. The phenyl group allows for π–π-interactions (in addition to hydrophobic interactions) with analytes, which can be used in HPLC for selectivity tuning that complements traditional reversed-phase materials like C18-modified silica.
 | ||
| Scheme 1 Formation of hybrid organic-silica monoliths modified in their bulk and at the surface by phenyl groups. The bulk phenyl groups provide higher structural flexibility compared to the more brittle pure silica-based materials; surface phenyl groups allow for analyte–surface hydrophobic and π–π-interactions. | ||
The phenyl groups attached to silicon, as in the PTMS precursor, are suitable for this preparation, since they do not decompose at the temperature used to generate the macroporous–mesoporous monolith (330 °C). It allows us to realize the phenyl functionality in the bulk and at the surface of a macroporous–mesoporous structure. This also distinguishes the monoliths in this article from other phenyl-modified hybrid silica monoliths, where a significant amount of microporosity is expected to be present in the final structure.29–31 For liquid-phase adsorption and separation the micropores cause a high diffusional mass-transfer resistance and less hindered diffusion of analytes in mesopores is preferred.
We confirmed the successful permanent integration of the phenyl functionality in the final macroporous–mesoporous hybrid silica monoliths employing thermogravimetric analysis coupled to mass spectrometry (TGA-MS) as well as by infrared spectroscopy (FT-IR). The mesopore size distribution was characterized by nitrogen physisorption and the macropore spaces were visually inspected with scanning electron microscopy (SEM). For the quantitative evaluation of the macropore space morphology, we reconstructed a PTMS–TMOS silica monolith at macropore resolution adapting confocal laser scanning microscopy (CLSM) followed by chord length distribution (CLD) analysis, as described previously for silica-based monoliths prepared from pure TMOS or from TMOS and methyltrimethoxysilane (MTMS).22,32,33 In CLD analysis the solid–void (silica–macropore) border is scanned with chords of variable length and the resulting distribution of the chord lengths indicates the relative frequency with which a certain silica–silica distance occurs in the macropore space of a monolith. This is an abstract but accurate analytical approach to describe void space fluctuations in a material, eliminating the need to define limits for individual pores or their geometric form.
The CLSM-based reconstructed models of the macropore space of a monolith will be useful in the future for simulations of fluid flow and mass transport aimed at a fundamental understanding of the transport properties of hybrid silica monoliths.34,35 But in this work our immediate goal is to identify how the parameters of the applied synthesis protocol affect the morphology of the prepared PTMS–TMOS hybrid silica monoliths compared to the previously analyzed pure TMOS and MTMS–TMOS hybrid silica monoliths. Since it is known that (in acidic media) a small substituent in the trialkoxysilanes, like the methyl group in MTMS, leads to a faster hydrolysis and condensation, whereas sterically more demanding substituents (like the phenyl group in PTMS) retard the reactions with respect to tetraalkoxysilanes,17 we are specifically interested in the CLD-analysis based homogeneity of the macropore space morphology in these PTMS–TMOS monoliths. The intention of chosing between substituents in the trialkoxysilane precursor is to generate different surface functionalities at conserved macropore space homogeneity and associated hydrodynamic and transport properties. Details on the morphology of hybrid silica monoliths and on their relationship to pure silica-based monoliths are still scarce in the literature.
This paper is organized as follows. In Section 2, we describe the adapted synthesis of the PTMS–TMOS hybrid silica monoliths as bare rods and in capillary column format and briefly mention the characterization methods. Only the CLSM approach to the three-dimensional reconstruction of the monoliths macropore space is explained in more detail, since it will help others in applying this insightful analysis to their own samples. In Section 3, we confirm the incorporation of the phenyl groups with TGA-MS and FT-IR, analyze the monoliths macropore space qualitatively by SEM and verify the monoliths intraskeleton mesoporosity through nitrogen physisorption. Consequences of the phenyl-modification for the chromatographic selectivity behaviour of PTMS–TMOS hybrid monoliths is demonstrated by the comparison with commercially available phenyl-modified silica particles and a MTMS–TMOS monolith, which has been C18-modified (classical reversed-phase functionality in HPLC) and cannot interact with aromatic analytes by π–π-interactions. We finally characterize the macropore space morphology of the reconstructed PTMS–TMOS monolith using CLDs and macroporosity profiles. Parameters extracted from the morphological analysis are connected to key transport properties of the monoliths macropore space. Results are compared to pure TMOS and MTMS–TMOS hybrid silica monoliths, which have been previously characterized by the same approach.
2. Experimental section
2.1. Chemicals and materials
TMOS, urea, PEG (Mn = 10![[thin space (1/6-em)]](https://www.rsc.org/images/entities/char_2009.gif) 000), thiourea, octadecyldimethyl-N,N-diethylaminosilane (ODS-DEA) and HPLC-grade ethanol came from Merck Millipore (Darmstadt, Germany), glycerol and HPLC-grade acetonitrile and methanol came from Carl Roth (Karlsruhe, Germany). PTMS, propylbenzene, butylbenzene and anthracene, dimethyl sulfoxide and octadecyltrimethoxysilane, as well as HPLC-grade acetone and toluene were all supplied by Sigma-Aldrich Chemie (Taufkirchen, Germany). Acetic acid was purchased from Fluka (Buchs, Switzerland) and Bodipy 493/503 from Life Technologies (Darmstadt, Germany).
000), thiourea, octadecyldimethyl-N,N-diethylaminosilane (ODS-DEA) and HPLC-grade ethanol came from Merck Millipore (Darmstadt, Germany), glycerol and HPLC-grade acetonitrile and methanol came from Carl Roth (Karlsruhe, Germany). PTMS, propylbenzene, butylbenzene and anthracene, dimethyl sulfoxide and octadecyltrimethoxysilane, as well as HPLC-grade acetone and toluene were all supplied by Sigma-Aldrich Chemie (Taufkirchen, Germany). Acetic acid was purchased from Fluka (Buchs, Switzerland) and Bodipy 493/503 from Life Technologies (Darmstadt, Germany).
A Milli-Q gradient water purification system (Millipore, Bedford, MA) was used to provide water for all experiments. Fused-silica capillaries with 100 μm i.d. and 375 μm o.d. were obtained from Polymicro Technologies (Phoenix, AZ). A 4.6 mm i.d. × 150 mm Inertsil Ph-3 column packed with phenyl-modified silica particles came from GL Sciences (Torrance, CA). The following data are given by the manufacturer for this material: 5 μm mean particle size, 10 nm mean pore size, 450 m2 g−1 surface area, 1.05 ml g−1 pore volume and 9.5% carbon load.
2.2. Synthesis of the monolithic silica materials
| Rod/column | Hybrid [ml] | PEG [g] | Urea [g] |
|---|---|---|---|
| a Gelation temperature: 40 °C. b Gelation temperature: 35 °C. c Gelation temperature: 30 °C. | |||
| TP(10)-0.6-40a | 5.5 | 0.6 | 1.012 |
| TP(10)-0.7-40a | 5.5 | 0.7 | 1.012 |
| TP(10)-1.0-40a | 5.5 | 1.0 | 1.012 |
| TP(10)-1.1-40a | 5.5 | 1.1 | 1.012 |
| TP(10)-1.5-40 a | 5.5 | 1.5 | 1.012 |
| TP(10)-1.5-35b | 5.5 | 1.5 | 1.012 |
| TP(10)-1.5-30c | 5.5 | 1.5 | 1.012 |
2.3. Characterization methods
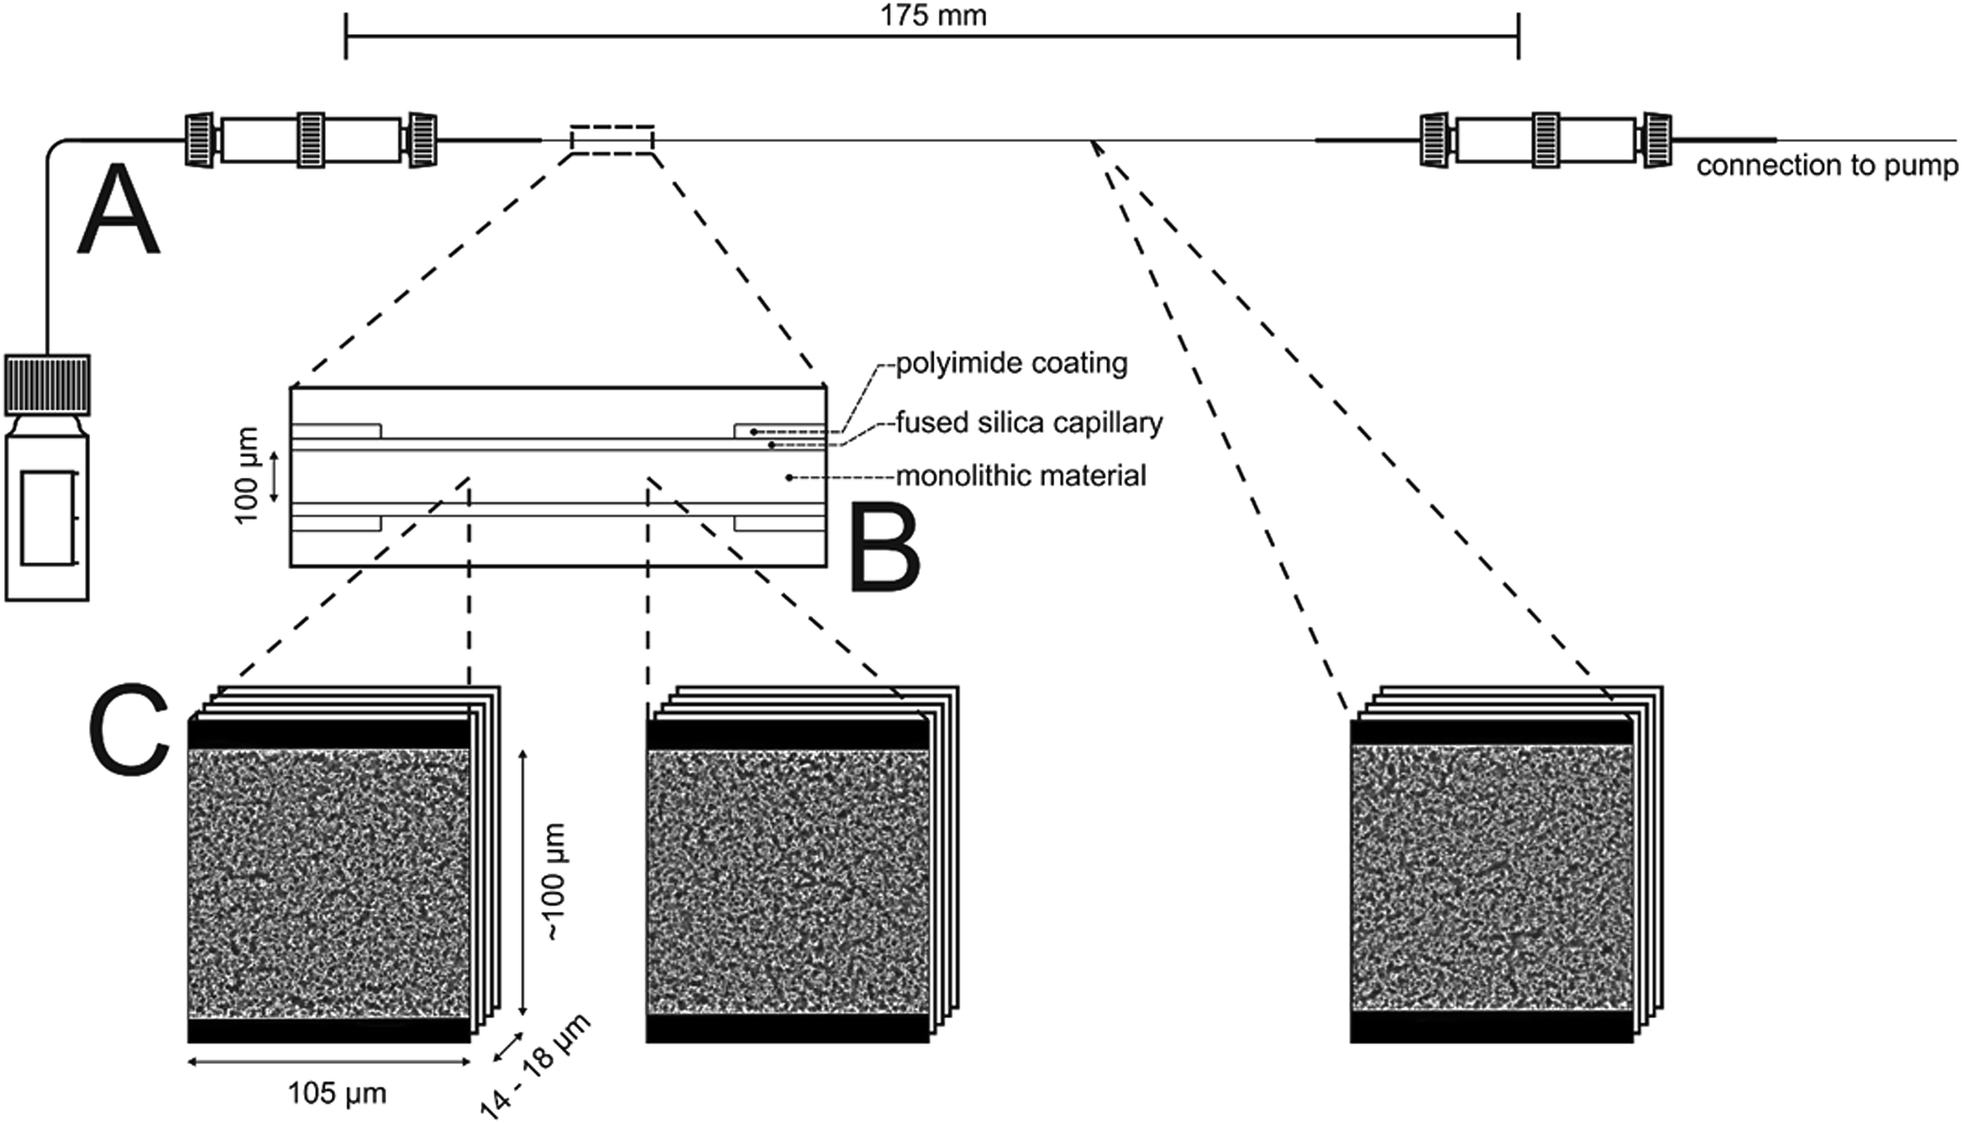 | ||
| Fig. 1 Schematic overview of the two pretreatment steps prior to acquisition of the CLSM images and their positions within the capillary. The monolithic material is modified by octadecyltrimethoxysilane, then with the dye Bodipy 493/503 and afterwards filled with a ternary mixture matching the refractive index of the silica material. All solutions and washing solvents are delivered from an Agilent 1100 series nanopump. Excess is collected at the capillary outlet (A). A bare fused-silica window of ∼5 mm length is created by chemical etching of the polyimide coating (B). The treated area allows the confocal microscope to focus into the bulk of the monolithic material when immersed in refractive index matching liquid. Stacks of about 105 μm × 100 μm × 14 to 18 μm acquired at three different positions were used for the morphological characterization of the PTMS–TMOS hybrid silica monoliths macropore space based on CLD analysis (Section 3.4.). | ||
2.3.6.1. Sample preparation. Monoliths are stained by a two-step procedure. First, the silanol groups remaining at the surface (cf.Scheme 1) were modified with octadecyltrimethoxysilane to provide a more hydrophobic surface. After washing the monolith with ethanol, a solution of octadecyltrimethoxysilane (220 mg ml−1 in toluene) was pumped through the capillary for 6 h at a flow rate of 0.3 μl min−1 and a temperature of 343 K. The capillary was flushed with toluene and acetone to remove excess solution. The hydrophobic surface of the hybrid silica monolith was then stained with a solution of Bodipy 493/503 (0.5 mg ml−1 in acetone) for 0.5 h at a flow rate of 0.2 μl min−1 and room temperature. The polyimide coating was removed with warm sulfuric acid to enable focusing through the glass capillary.
A mixture of glycerol, dimethyl sulfoxide and water (70/19/11, v/v/v) was prepared to match the optical dispersion of silica over the wavelength range relevant for the CLSM measurements (488–515 nm).32,41 The refractive index of the ternary mixture was adjusted by an AR200 digital refractometer (Reichert Analytical Instruments, Depew, NY) to the refractive index of silica at the sodium D line (nD = 1.4582).
2.3.6.2. Image acquisition. Images were acquired using a TCS SP5 II confocal microscopy system equipped with a HCX PL APO 63×/1.3 GLYC CORR CS (21°) glycerol immersion objective lens from Leica Microsystems (Wetzlar, Germany). The silica monolithic sample was mounted directly underneath a cover slip, placing the capillary window (where polyimide has been removed) into an embedding medium. This consists of refractive index matching liquid and guarantees an imaging free of aberrations due to the curved capillary wall. A “type 0” cover slip (Gerhard Menzel, Braunschweig, Germany) was chosen to separate embedding and immersion liquids and to minimize spherical aberrations.41
In this work, the prepared ternary matching liquid was used for immersion as well as embedding. Fluorescence of the Bodipy dye (λexc = 493 nm, λem = 503 nm) was excited with a UV diode laser at 488 nm and detected in the interval of 491–515 nm. Sampling steps of 30 nm (lateral) and 126 nm (axial) were calculated using the Nyquist rate and point spread function calculator (Scientific Volume Imaging, Hilversum, The Netherlands). Stacks of 8-bit grayscale images of 4096 × 4096 pixels were acquired at three different positions along the capillary, as illustrated in Fig. 1. The number of images per stack varied between 120 and 160.
2.3.6.3. Image processing. Image processing consists of four consecutive steps whose details are described elsewhere.41 (i) First, the images were corrected for Poisson-distributed photon noise using the PureDenoise plug-in for ImageJ42 provided by Luisier.43 (ii) The acquired image stacks were then corrected for the intensity loss from photobleaching by fitting the average intensity of the images along the z-axis to a second-order exponential decay. (iii) Images were deconvolved with the Huygens Maximum Likelihood Algorithm (Scientific Volume Imaging, Hilversum, The Netherlands). (iv) Images were segmented by twice subtracting a copy of the image stack blurred with a large Gaussian kernel filter (kernel size: 200 pixels) from the deconvolved image stack to get a homogeneous background intensity corresponding to the intensity value zero. All pixels with an intensity value above zero were then assigned as skeleton. To eliminate artifacts from processing, image stacks were cropped in lateral dimension to 4000 × 3500 pixels and in axial dimension by discarding the five top and bottom images; each image stack subjected to image analysis corresponded to a physical volume of 105 μm × 100 μm × 14 to 18 μm.
2.3.6.4. Image analysis. The segmented image stacks were analyzed on the basis of CLDs, as shown by Courtois et al.,44 using in-house software written with Visual Studio C# 2008 (Microsoft Corporation, Redmond, WA). To calculate a CLD for the hybrid silica monoliths macropore space, points were randomly chosen in the void space of an image stack. From each point vectors were projected in 32 angularly equispaced directions, until they either hit the skeleton or projected out of the image boundaries; in the latter case, the corresponding vector pairs were discarded. Points of origin were chose until the value of 62
500 was reached. Chord lengths were calculated as the sum of the absolute lengths of a pair of opposed vectors. The 106 collected chord lengths were binned using a bin size of 0.2 μm and the resulting histogram (a CLD) was fitted to a k-gamma function using the Levenberg–Marquardt algorithm.45 The external or macroporosity (εext) of a reconstructed volume was calculated as the fraction of void pixels to the total number of pixels in that image stack.
3. Results and discussion
3.1. Characterization of the organic modification
To confirm incorporation of phenyl groups into the monolithic silica material (suggested by Scheme 1) TGA-MS analysis, FT-IR measurements and elemental analysis were conducted. Fig. 2 shows the TGA-MS characteristics of sample TP(10)-1.0-40 prior to the calcination, where the weight loss starting at 350 °C can be attributed to the decomposition of the phenyl group (as associated with the observation of C4H3+ and C6H5+). It can be concluded that phenyl groups remain intact at the temperature applied in the course of the synthesis (330 °C during calcination).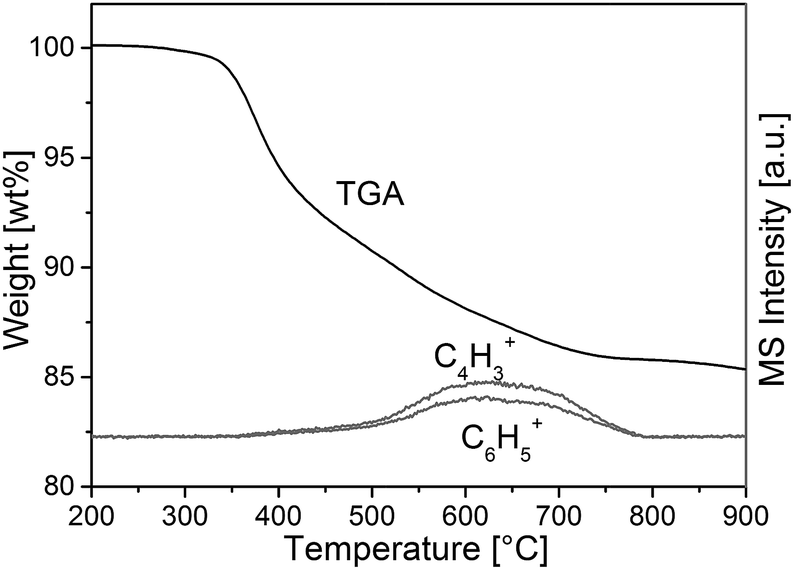 | ||
| Fig. 2 TGA-MS analysis of a PTMS–TMOS hybrid silica rod before the calcination (sample TP(10)-1.0-40, Table 1). The onset of degeneration of the aromatic compounds at ca. 350 °C indicates the stability of the phenyl modification at 330 °C, i.e., at the temperature of the heat-treatment used to obtain the macroporous–mesoporous monolith (Section 2.2.2.). | ||
Fig. 3 compares FT-IR spectra of a rod with phenyl modification (TP(10)-0.6-40) and a standard rod prepared with only TMOS as precursor.38,40 The regions between 1450 and 1410 cm−1 as well as between 730 and 670 cm−1 point towards important differences between the two materials. The band at ∼1430 cm−1 is assigned to ring stretching with some C–H bond coupling, while the band at ∼700 cm−1 corresponds to out-of-plane ring bending that is typical for benzene with a substituent.46,47
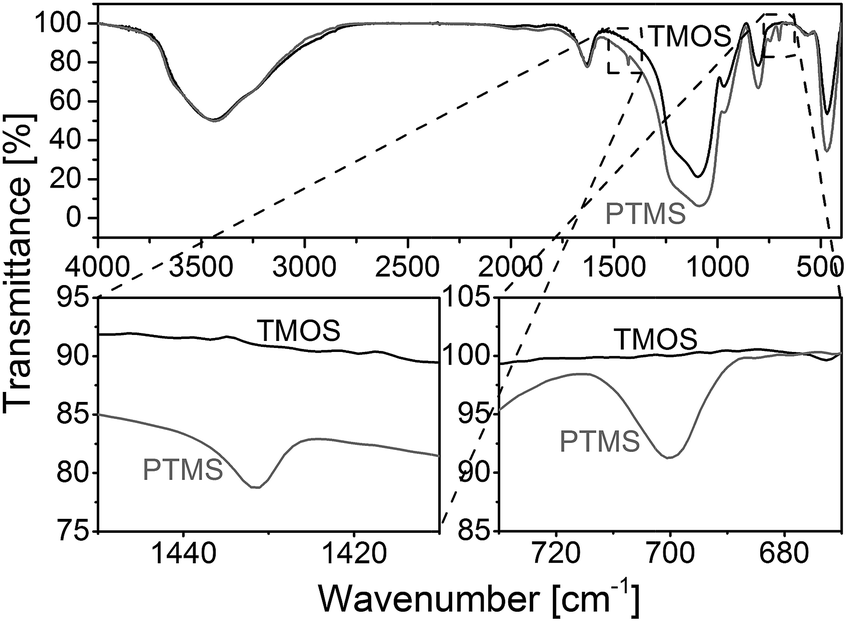 | ||
| Fig. 3 FT-IR spectra for silica monoliths with (grey) and without (black) phenyl modification (PTMS–TMOS vs. pure TMOS). The band at ∼1430 cm−1 is assigned to ring stretching with some C–H bond coupling, whereas the band at ∼700 cm−1 corresponds to out-of-plane ring bending, typical for benzene with a substituent. | ||
In addition, elemental analysis for three slices (from the bottom, middle and top) taken from silica rod TP(10)-0.6-40 indicates a homogeneous carbon distribution and therefore the presence of phenyl groups throughout the entire rod (11.0–11.7 wt% carbon). The overall carbon load of the PTMS–TMOS rod is higher than for the commercial phenyl-modified silica particles (Section 2.1.), but since the phenyl-modification refers to the bulk solid and the surface in the rod (Scheme 1) its surface coverage will be lower than for the particles, which are surface-modified in a traditional post-functionalization procedure.
3.2. Analysis of macro- and mesoporosity
Many parameters influence the morphology of monolithic silica materials. Two parameters which were varied in this work are the amount of PEG and the gelation temperature (cf.Table 1). SEM images were taken from the fractured surfaces of the prepared materials to receive insight into the macropore space morphology of the rods and capillaries. SEM micrographs for selected starting compositions are depicted in Fig. 4. The observed decrease in the macropore size with increasing PEG amount (B → D) as well as the increase in the macropore size with decreasing polymerization temperature (D → F) correspond to results reported previously for the pure TMOS system.48–50 Furthermore, Fig. 4A shows that it was possible to prepare a monolithic silica capillary column in a good quality using the PTMS–TMOS system, since no cracks can be observed in the bulk material and at its interface with the inner wall of the capillary. However, an adjustment of the preparation conditions is still necessary to generally avoid cracks in the bulk material as well as between the monolith and capillary wall. Fig. 4G shows such cracks observed in one of the prepared samples. The adjustment procedure indicates that by using a lower gelation temperature in the course of the preparation (Table 1), a monolith cracking within the capillary could be prevented. We believe this is caused by a lower reaction rate during the gelation, so that the distribution of silica phase becomes more homogenous within the capillary (especially close to the capillary wall), because the time for phase separation increases.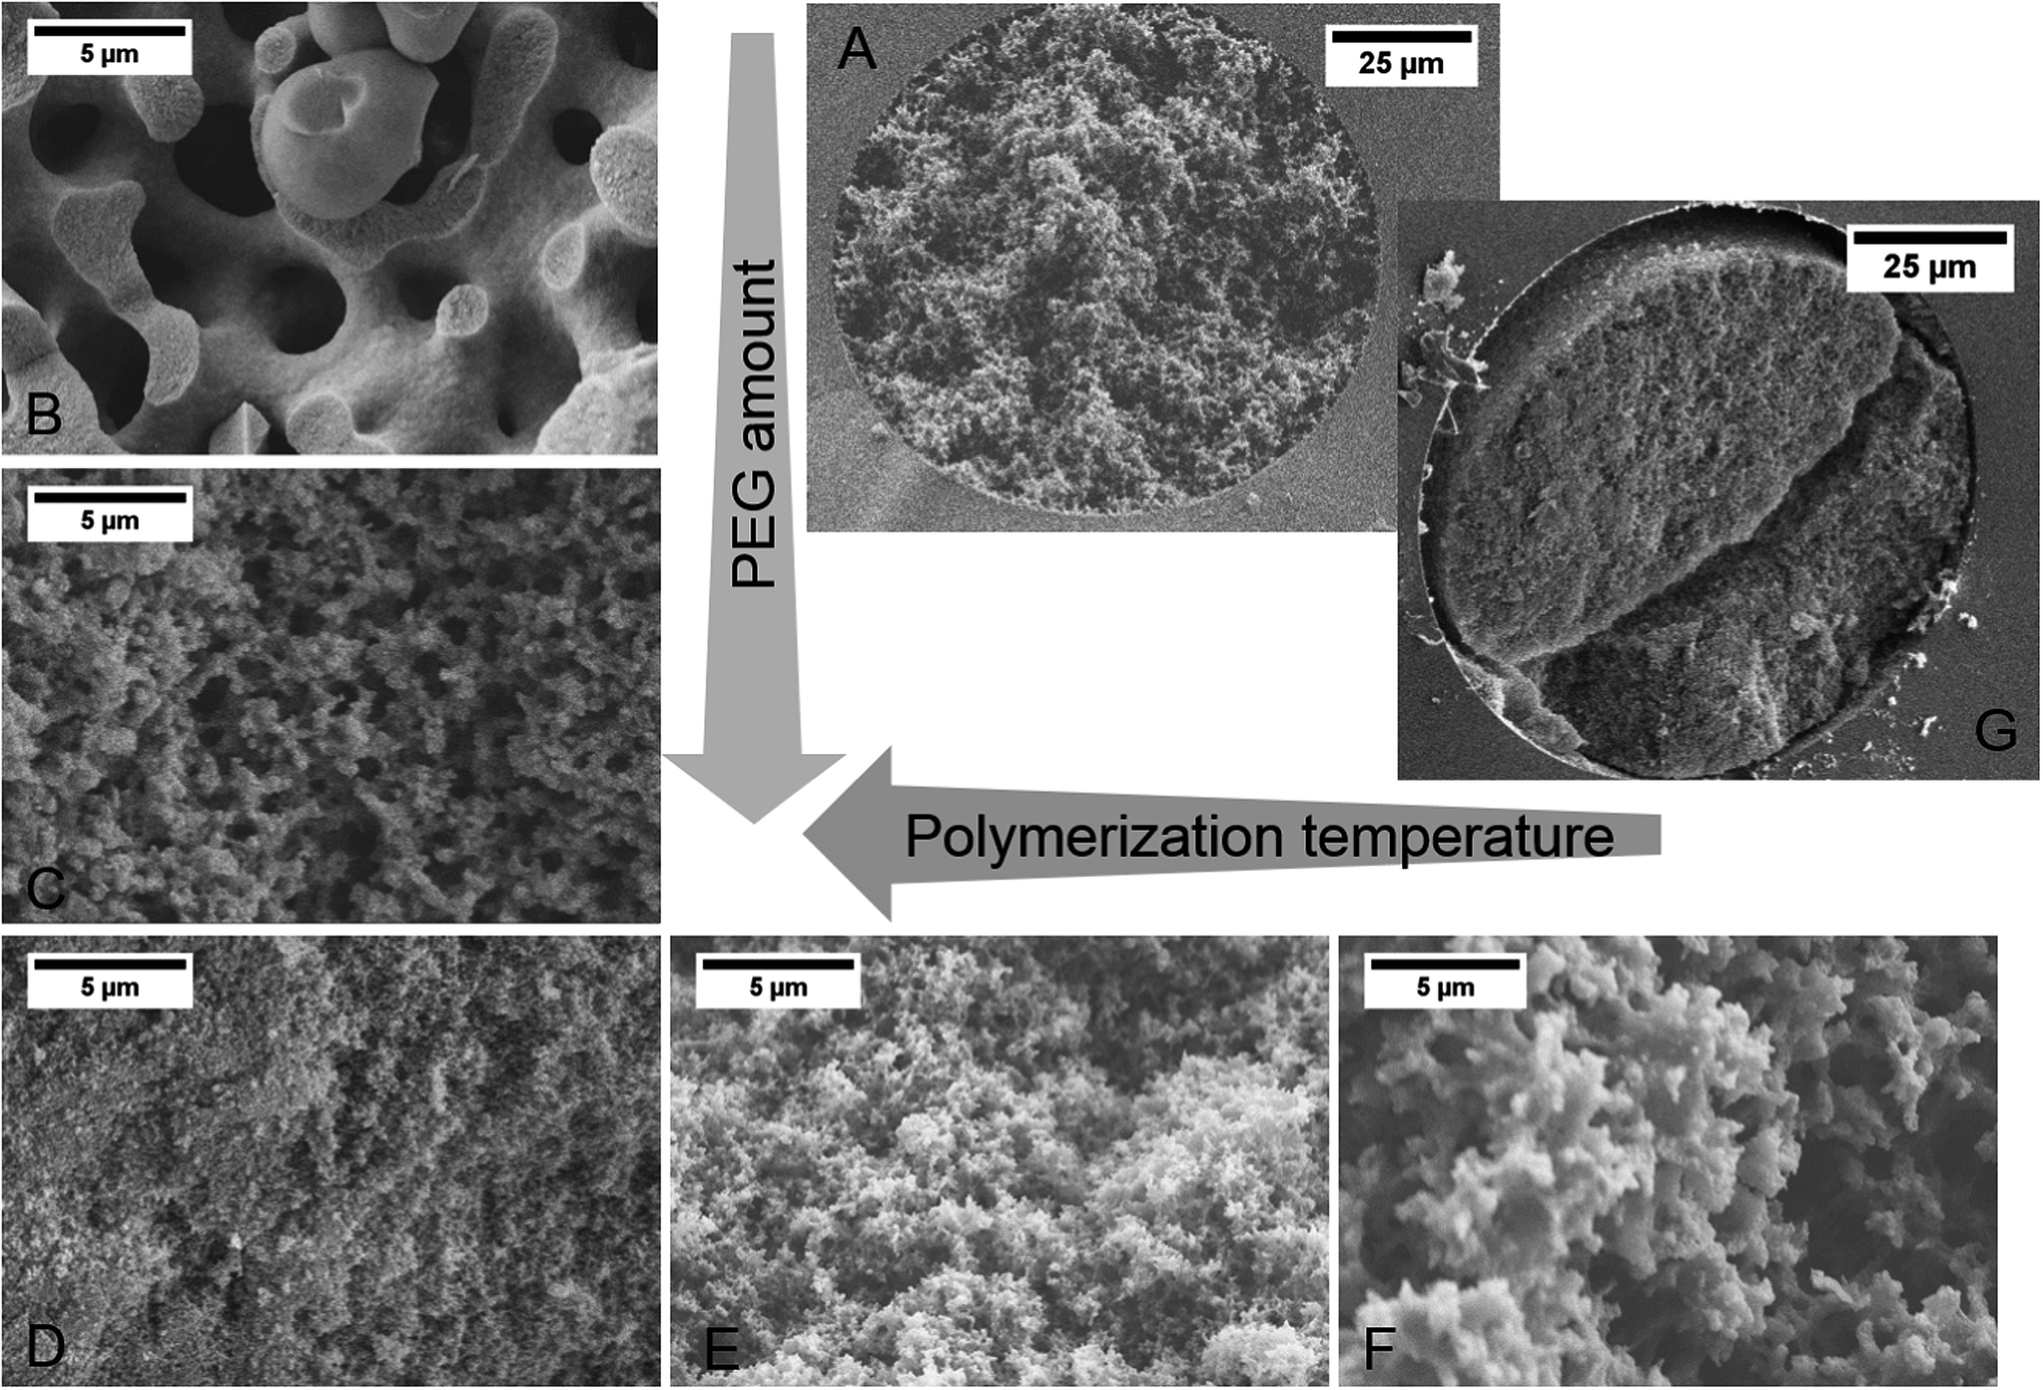 | ||
| Fig. 4 SEM micrographs of hybrid silica monoliths prepared from PTMS and TMOS. The influence of a variation in the PEG amount and polymerization temperature on the monolith domain size (sum of the average macropore size and average skeleton thickness) is shown, cf.Table 1. (A) TP(10)-1.5-30 in a 100 μm i.d. fused-silica capillary; (B) TP(10)-0.6-40; (C) TP(10)-1.1-40; (D) TP(10)-1.5-40; (E) TP(10)-1.5-35; (F) TP(10)-1.5-30; (G) TP(10)-1.5-40 in a 100 μm i.d. fused-silica capillary. | ||
Fig. 5 compares the isotherm curves and pore size distributions of two phenyl-modified samples and a pure TMOS-based monolith (identical hydrothermal treatment for all samples) using nitrogen physisorption at 77 K. The NLDFT method for silica was applied to the adsorption branch, assuming cylindrical mesopores, since it was demonstrated that the NLDFT approach is more suitable for these materials than the Barrett–Joyner–Halenda method.51,52 This analysis resolves only a small difference in mesoporosity between the phenyl-modified samples (Table 2), so that there exists no (or an only small) effect of the PEG amount regarding the mesopore space properties. This result is consistent with the mechanism of pore formation in these silica monoliths, as the mesopores result from etching of the silica under basic conditions (which should not be affected by the actual PEG amount). However, the average mesopore diameter of the phenyl-modified monoliths is generally smaller and the surface area larger (∼6 nm and ∼850 m2 g−1) than for the TMOS monolithic silica (∼12 nm, 350 m2 g−1). It suggests that the PTMS–TMOS hybrid silica material has a higher stability under basic conditions than pure silica, since the hydrothermally induced pore expansion under basic conditions is responsible for the mesopore formation.
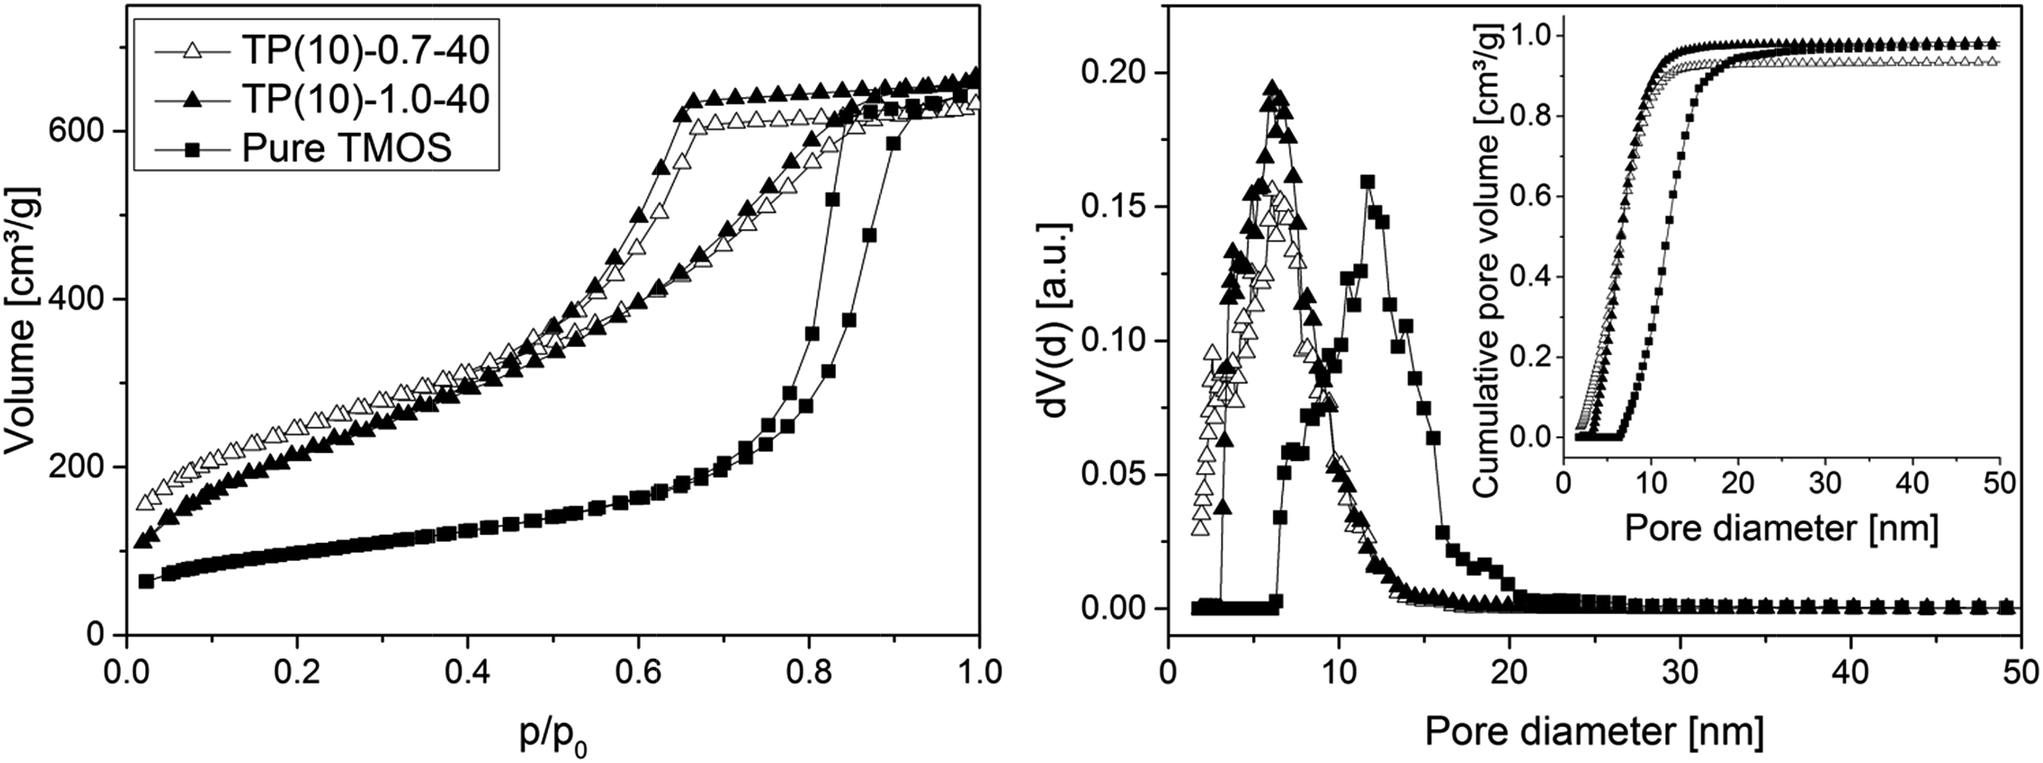 | ||
| Fig. 5 N2 isotherms (left) and pore size distributions (right) for PTMS–TMOS hybrid silica rods prepared with different PEG amount (cf.Table 1) and for a silica rod based on pure TMOS. The inset containing the cumulative pore volume data demonstrates that the amount of microporosity remaining in the prepared (macroporous–mesoporous) monoliths is indeed negligible. | ||
| Rod | Specific surface area [m2 g−1] | Average pore diameter [nm] | Average pore volume [cm3 g−1] |
|---|---|---|---|
| TP(10)-1.0-40 | 810 | 5.8 | 0.97 |
| TP(10)-0.7-40 | 870 | 5.8 | 0.82 |
| Pure TMOS | 350 | 11.7 | 0.98 |
3.3. Chromatographic performance
Fig. 6 shows chromatograms for a set of analytes (propylbenzene, butylbenzene, anthracene) and thiourea as the dead-time marker, obtained with acetonitrile/water (50/50, v/v) as mobile phase. For this comparison, we employed a 4.6 mm i.d. column packed with the phenyl-modified silica particles, a phenyl-modified (PTMS–TMOS) monolithic silica capillary (TP(10)-1.5-30, Table 1) and a C18-modified (MTMS–TMOS) monolithic capillary, prepared as described in Section 2.2.3.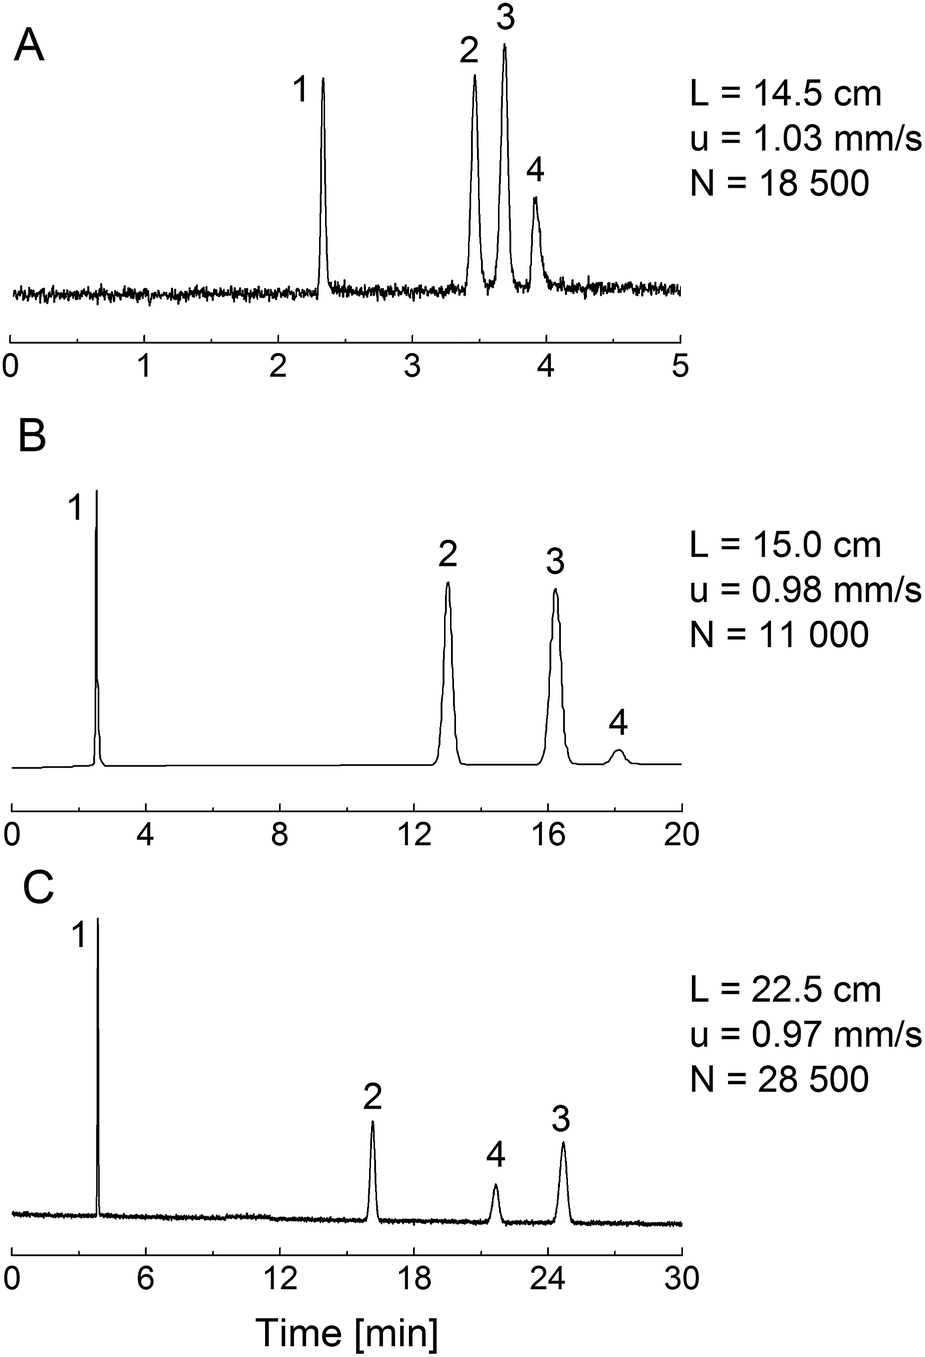 | ||
| Fig. 6 Chromatograms for thiourea (1; dead-time marker), propylbenzene (2), butylbenzene (3) and anthracene (4). Mobile phase: acetonitrile/water 50/50 (v/v). Detection wavelength: 210 nm. The column length L, mobile phase linear velocity u, and number of theoretical plates N are noted. (A) Phenyl-modified monolithic silica column TP(10)-1.5-30 (100 μm i.d.); (B) Inertsil Ph-3 particle-packed column (4.6 mm i.d.); (C) C18-modified monolithic silica column (100 μm i.d.). | ||
The PTMS–TMOS hybrid silica monolith (Fig. 6A) demonstrates a similar separation regarding the elution order of the analytes as the phenyl-modified silica particles (Fig. 6B). Both the monolith and the particulate column demonstrate a base-line separation of the analytes under similar conditions (identical mobile phase and almost identical linear velocity). This comparison reveals a larger number of theoretical plates and a shorter separation time for the PTMS–TMOS capillary column. The higher separation efficiency for monolithic materials is consistent with previous results;53 the shorter analysis time likely originates in a lower surface coverage by phenyl groups in the monolith (resulting in weaker retention). A comparison of the PTMS–TMOS capillary with the C18-silica monolith (Fig. 6C) reveals the absence of π–π-interactions in the latter, since the elution order of butylbenzene and anthracene is reversed. This demonstrates the possibility of a selectivity tuning with the PTMS–TMOS materials, which complements traditional reversed-phase materials like C18-silica.
3.4. Morphological analysis of the monoliths
The intrinsic efficiency of any chromatographic material becomes limited by local and global differences of the analyte velocities in a column. An efficient column allows analytes to pass through it with a narrow distribution of longitudinal velocities. The velocity biases are a general consequence of structural heterogeneities that occur on different length scales in a column. The corresponding hydrodynamics lead to eddy dispersion, which can considerably contribute to the overall band broadening in chromatographic practice. Giddings has classified the velocity biases over different length scales and incorporated them into his coupling theory of eddy dispersion.54 In silica-based monoliths, velocity biases are known to occur on the scale of a single macropore (transchannel contribution), on the scale of a few (1–2) macropores (short-range interchannel contribution), and over the entire column diameter (transcolumn contribution).55,563D imaging methods allow the analysis of morphological features behind eddy dispersion. We employed CLSM to reconstruct the macropore space of the monoliths. With local resolution, image analysis delivers an accurate characterization of the void space from the individual macropore up to the column (capillary) cross-section.22,33Fig. 1 already gave an insight into this analysis. After surface modification with octadecyltrimethoxysilane the capillary monolith was stained with the lipophilic fluorescent dye Bodipy 493/503. By removing polyimide coating and filling (as well as immersing) the capillary using a matching liquid with the same refractive index as fused-silica, the CLSM approach enables the imaging of the monolithic bulk without mechanical slicing. Three image stacks at different positions (cf.Fig. 1) were acquired from the ∼17.5 cm long PTMS–TMOS capillary monolith. Each stack covers up to 160 images (with a resolution of 4096 × 4096 pixels featuring a physical size of 30 × 30 nm per pixel) that were used for reconstruction. After image processing-related cropping, the reconstructed volume corresponded to a physical volume of 100 μm × 105 μm × 14 to 18 μm for each stack. A reconstructed stack is shown in Fig. 7. It demonstrates a continuous silica layer at the monolith–capillary wall interface (near x = 0).
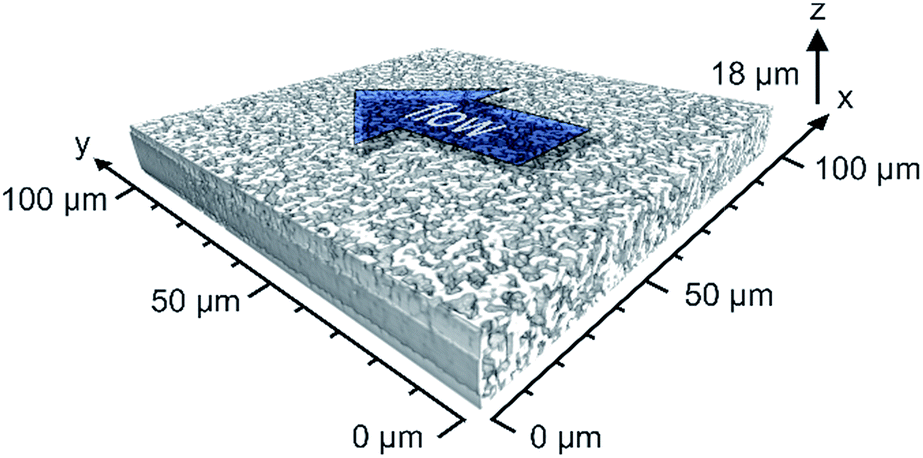 | ||
| Fig. 7 CLSM-based physically reconstructed section of a PTMS–TMOS monolith. The processed images cover a physical volume represented by the 100 μm over the entire capillary diameter (x-direction), 105 μm in the y-direction (along the capillary axis) and 18 μm in z-direction. The flow direction through the capillary, e.g., in HPLC, is indicated. | ||
Reconstructed volumes of a PTMS–TMOS hybrid silica monolith (Fig. 1) were evaluated using the CLD approach. As pointed out already in the Introduction the generated CLD is an accurate tool to describe void space distributions in monoliths, since it captures the complete geometry and does not rely on a predefined model of macropore geometry.22,32,33,44 Traditional analysis by mercury intrusion porosimetry (MIP), for example, assumes that all pores have a cylindrical shape. But if the material under study shows a more complex pore geometry as revealed by Fig. 7 for the PTMS–TMOS monolith, the MIP-analysis provides data whose accuracy depends on the actual difference between real and assumed pore geometry. Macropore size characteristics of these monoliths thus cannot be correctly described through a model-based porosimetry analysis. As shown by Gille et al.,57 a pore can be described with two interdependent variables, the pore diameter and mean chord length. Only for a perfect and infinitely long cylindrical pore the diameter and mean chord length would be identical.58 Thus, CLD analysis (Fig. 8A) is valuable in describing as well as comparing monoliths with varying domain sizes and compositions like the PTMS–TMOS, MTMS–TMOS and pure TMOS monoliths.
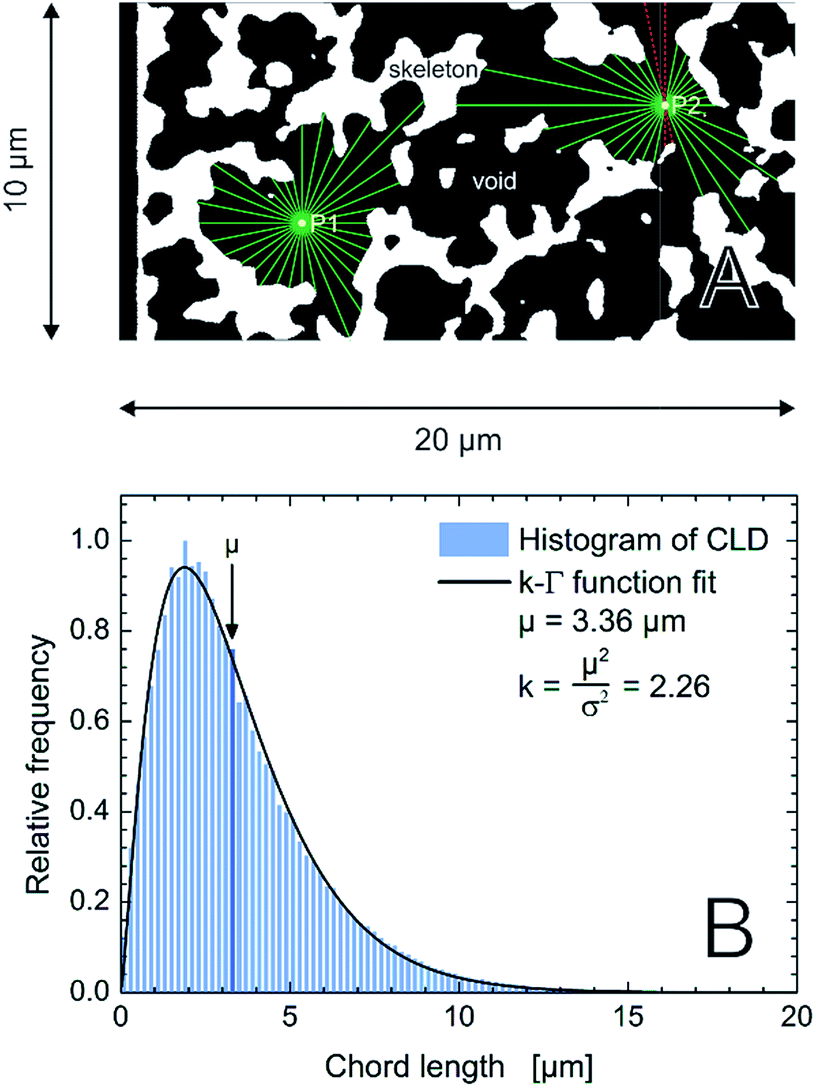 | ||
| Fig. 8 (A) Schematic illustration of the CLD analysis in the macropore space of the monoliths. For each image stack 62500 points are randomly distributed in the macroporous void space (black). 32 vectors are spread equiangularly from each point until they reach the skeleton–macropore interface (green). The sum of the lengths of two opposing vectors defines a chord length. If a vector projects out of the image boundaries (red), the corresponding chord length is rejected. (B) Normalized histogram for 106 chords from the macropore space of an image stack of the PTMS–TMOS monolith. The k-gamma function, eqn (1), was fitted to the data providing the values of μ and k, as indicated. | ||
A mathematical description of the CLD is achieved by fitting the histogram with a k-gamma function as shown previously.22,27,33,35 The k-gamma function has been delineated as a descriptor of the void space distribution in disordered materials using a statistical mechanics formalism.59 The k-gamma function, which provides information about the average pore size and statistical dispersion of the pore size distribution, is defined by the mean and standard deviation of the CLD (Fig. 8B)
 | (1) |
Interpreted in terms of a monoliths macropore space morphology, μ is a measure for the average pore size (different from and not to be confused with the average pore diameter as obtained from the interpretation of MIP data) and k for the homogeneity of the void space distribution. The parameters μ and k can be related to the individual contributions to hydrodynamic dispersion in fluid flow through the monoliths macropore space.22,35 Here, a smaller value of μ represents a shorter lateral distance that an analyte needs to cover in the fluid between two encounters with the solid monolith skeleton. This lowers transchannel dispersion, which results from the flow velocity bias over the largest lateral distance across an individual macropore. In addition, larger k-values are indicative of a narrower distribution relative to μ, i.e., a higher homogeneity on the scale of 1–2 macropores. A more homogeneous macropore space reduces the velocity bias between neighboring channels and thus the short-range interchannel dispersion.35,54–56
Over the past years, the CLD analysis has become a versatile tool for the morphological description of packed beds and monoliths. Originally used for analysis of capillary silica monoliths,22,32,44 it was extended to particulate packings,41,60 analytical-format silica monoliths61,62 and organic-polymer monoliths.63
The relationships between morphology and transport properties make the CLD analysis useful for the systematic improvement of functional materials, e.g., in separation and catalysis. In addition, profiles of the external porosity (or interskeleton macroporosity) εext recorded over the cross-section of a column (“transcolumn”) allow to complement the CLD analysis by characterizing the wall attachment and possible systematic radial porosity variations in a monolithic structure. The analysis of the prepared PTMS–TMOS monoliths macropore space by CLDs and radial macroporosity profiles is related to the respective eddy dispersion contributions (i.e., transchannel, short-range interchannel and transcolumn) and compared to previously analyzed MTMS–TMOS and pure TMOS monoliths.
With a mean chord length of μ = 3.41 ± 0.08 μm (average value from three stacks, cf.Fig. 1) the prepared PTMS–TMOS capillary monolith in this work has a smaller pore size than the previously studied MTMS–TMOS hybrid silica monoliths22 and pure TMOS monolith (Merck Chromolith CapRod).32 It indicates faster lateral equilibration of analyte molecules in individual macropores and a smaller transchannel eddy dispersion contribution in the present PTMS–TMOS monolith. If wall effects, e.g., due to a snapped-off monolithic structure at the wall,22,32 and bulk heterogeneity due to a wide distribution of macropore and domain sizes were absent, the mean macropore size (as reflected by the μ-value of the CLD) will determine monolith efficiency. This was demonstrated with a set of MTMS–TMOS hybrid silica monoliths:22 as macropore and domain sizes became smaller (at conserved macropore space homogeneity), the decreasing μ-value of the monoliths correlated with a higher separation efficiency in capillary HPLC.
The actual degree of heterogeneity of the prepared PTMS–TMOS capillary monolith is characterized by k = 2.22 ± 0.04 (cf.Fig. 8B for data on one of the three stacks). This k-value range indicates a more homogeneous monolithic bulk structure than for the Merck Chromolith CapRod (which resulted in k-values of 1.9 ± 0.1).32 Considering the mean pore size of the PTMS–TMOS monolith its k-value is comparable to the previously studied MTMS–TMOS hybrid silica monoliths.22 While the separation efficiency of silica monoliths has been shown to improve with increasing k-value and decreasing μ-value62 and silica monoliths that combine small macropore size with a rather homogeneous macropore space have occasionally been reported, yet no synthetic route guarantees this outcome.1–6 Although all the investigated hybrid silica monoliths (PTMS–TMOS, MTMS–TMOS) show good results with respect to the macropore space homogeneity, this seems to be an effect of sophisticated preparation protocol rather than the actual material composition. It is demonstrated with commercial analytical silica monoliths based on pure TMOS (the 2nd generation Chromolith columns from Merck Millipore66), which have shown even higher homogeneity, with k = 2.6–2.9 (μ = 2.53–4.85 μm).62
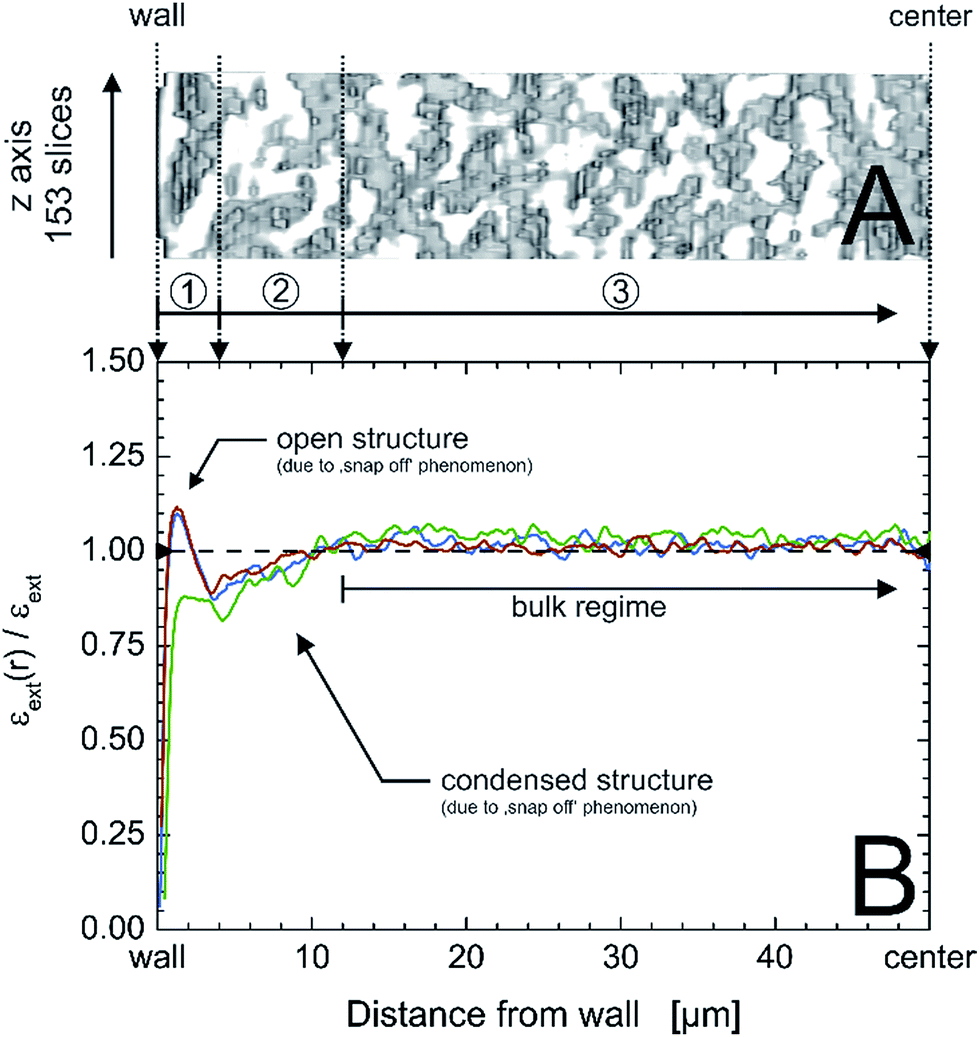 | ||
| Fig. 9 Exemplary x,z-region of a physically reconstructed PTMS–TMOS monolith covering an area of 153 slices in the z-direction and 50 μm from the capillary inner wall to the center of the monolith (A); the capillary i.d. is 100 μm. (B) Radial profiles of external or macroporosity for the three acquired image stacks (cf.Fig. 1) of the PTMS–TMOS capillary monolith (red, green and blue lines), normalized by the average macroporosity εext, visualizing the existence of three characteristic regions: a 4 μm wide open structure next to the wall (1), followed by 8 μm of densified structure (2) and the monolithic bulk region (3). | ||
This phenomenon is also well known from capillary monoliths of other compositions, of which pure TMOS capillary monoliths are the most prominent ones. Opposed to larger-diameter monolithic rods, the capillary monoliths are prepared directly in the tube then used for chromatographic separations (or other applications). The persistent mechanical stress introduced by shrinkage causes the bed to snap back from the rigid column wall, yielding gaps that allow the mobile phase to bypass the bed.56 Analytical monoliths instead are cladded in a separate step by polyether ether ketone.67 Hybrid monoliths could help to overcome this problem due to the reduced number of functional groups in the precursor molecules that participate in the condensation process (cf.Scheme 1), which will reduce the mechanical stress in the system.20,22
A monolith with small transcolumn eddy dispersion contribution would have a flat porosity profile that varies statistically around the mean external porosity value and has a well-connecting silica layer at/near the wall. The capillary wall–silica monolith interface of the actual PTMS–TMOS monolith illustrates porosity profiles (Fig. 9B) similar to the transcolumn porosity profiles revealed for some defective MTMS–TMOS monoliths from the reported set of eleven hybrid monoliths.22 It suggests that separation efficiency of the PTMS–TMOS monolith is dominated by transcolumn eddy dispersion and bears potential for a better performance if the wall effect can be reduced, as shown for good MTMS–TMOS capillary monoliths from the previously studied sample set.22
4. Conclusions
The presented hybrid silica monoliths have a macro–mesoporous structure with a large mesopore surface area of 800–900 m2 g−1, as determined by nitrogen physisorption at 77 K. TGA-MS, FT-IR and elemental analysis proved the presence of phenyl groups in the entire material, the majority of which remained intact despite the elevated temperature during heat-treatment applied to obtain intraskeleton mesopores. We used a CLSM method to reconstruct the macropore space morphology of the PTMS–TMOS monolith prepared in capillary column format. Image analysis delivered an accurate characterization of the void space from the macropore level up to the entire column (capillary) cross-section. Statistical analysis of the reconstructed pore space through CLDs allowed to assess the heterogeneity of the macropore space by a quantitative approach. The parameters obtained from the CLD analysis by eqn (1) could be related to the individual contributions to dispersion occurring in mobile-phase flow through the monoliths macropore space. It enabled us to compare the morphological homogeneity and chromatographic efficiency of the PTMS–TMOS monolith to previously investigated hybrid and pure TMOS monoliths. The prepared PTMS–TMOS monolith has a small macropore size and therefore a small transchannel eddy dispersion contribution. It has a macropore space homogeneity similar to good MTMS–TMOS monoliths and consequently also a small short-range interchannel eddy dispersion contribution. The CLSM-based analysis revealed a transcolumn heterogeneity in the macroporosity profile, which causes transcolumn eddy dispersion in chromatographic practice. Improvements in monolith preparation are required regarding the capillary wall–monolith interface, as demonstrated previously for the MTMS–TMOS monoliths.22 It may be achieved by a variation of the PTMS/TMOS ratio and/or the adjustment of the gelation temperature.Overall, we demonstrated the successful permanent incorporation of the phenyl group into macroporous–mesoporous hybrid silica monoliths, without compromising bulk morphological properties reported for other hybrid and pure TMOS monoliths. This is an important result, as it allows to introduce organic functionalities at conserved morphological properties of the macropore space. In addition, the PTMS–TMOS hybrid silica monolith delivered the envisioned results in terms of selectivity and separation efficiency in HPLC. Its selectivity reflected commercial phenyl-modified particulate material. Higher retention on these monoliths may be achieved by a post-functionalization, which is always an option, but with the advantage (over the combination of the pure TMOS monoliths and post-functionalization) of a bulk hybrid structure that is more flexible (less brittle) and thus can better withstand the physical stress and deformation due to shrinkage taking place during monolith preparation.
Acknowledgements
This work was supported by the Deutsche Forschungsgemeinschaft DFG (Bonn, Germany) under grant TA 268/6-1. Merck Millipore (Darmstadt, Germany) is gratefully acknowledged for financial support. This project was supported by the Laboratory of Materials Research (LaMa) of JLU.References
- A.-M. Siouffi, J. Chromatogr. A, 2003, 1000, 801–818 CrossRef CAS.
- K. Cabrera, J. Sep. Sci., 2004, 27, 843–852 CrossRef CAS PubMed.
- K. Nakanishi and N. Tanaka, Acc. Chem. Res., 2007, 40, 863–873 CrossRef CAS PubMed.
- S. Hartmann, D. Brandhuber and N. Hüsing, Acc. Chem. Res., 2007, 40, 885–894 CrossRef CAS PubMed.
- G. Guiochon, J. Chromatogr. A, 2007, 1168, 101–168 CrossRef CAS PubMed.
- K. K. Unger, R. Skudas and M. M. Schulte, J. Chromatogr. A, 2008, 1184, 393–415 CrossRef CAS PubMed.
- F. Roohi, M. Antonietti and M.-M. Titirici, J. Chromatogr. A, 2008, 1203, 160–167 CrossRef CAS PubMed.
- J. Le Bideau, M. Y. Miah, A. Vioux, F. Fajula and A. Galarneau, J. Mater. Chem., 2009, 20, 964–971 RSC.
- B. Reinhardt, D. Enke and G. Bienhaus, Opt. Appl., 2012, 42, 265–270 CAS.
- I. Tan, F. Roohi and M.-M. Titirici, Anal. Methods, 2012, 4, 34–43 RSC.
- A. Inayat, B. Reinhardt, H. Uhlig, W.-D. Einicke and D. Enke, Chem. Soc. Rev., 2013, 42, 3753–3764 RSC.
- C. Triantafillidis, M. S. Elsaesser and N. Hüsing, Chem. Soc. Rev., 2013, 42, 3833–3846 RSC.
- A. Sachse, A. Galarneau, B. Coq and F. Fajula, New J. Chem., 2011, 35, 259–264 RSC.
- E. G. Vlakh and T. B. Tennikova, J. Sep. Sci., 2013, 36, 1149–1167 CrossRef CAS PubMed.
- M. R. Awual, T. Yaita and H. Shiwaku, Chem. Eng. J., 2013, 228, 327–335 CrossRef CAS PubMed.
- A. Sachse, N. Linares, P. Barbaro, F. Fajula and A. Galarneau, Dalton Trans., 2013, 42, 1378–1384 RSC.
- K. Kanamori and K. Nakanishi, Chem. Soc. Rev., 2011, 40, 754–770 RSC.
- M. Wu, R. Wu, Z. Zhang and H. Zou, Electrophoresis, 2011, 32, 105–115 CrossRef CAS PubMed.
- J. Ou, H. Lin, Z. Zhang, G. Huang, J. Dong and H. Zou, Electrophoresis, 2013, 34, 126–140 CrossRef CAS PubMed.
- K. Kanamori, H. Yonezawa, K. Nakanishi, K. Hirao and H. Jinnai, J. Sep. Sci., 2004, 27, 874–886 CrossRef CAS PubMed.
- M. Motokawa, M. Ohira, H. Minakuchi, K. Nakanishi and N. Tanaka, J. Sep. Sci., 2006, 29, 2471–2477 CrossRef CAS PubMed.
- S. Bruns, T. Hara, B. M. Smarsly and U. Tallarek, J. Chromatogr. A, 2011, 1218, 5187–5194 CrossRef CAS PubMed.
- S. Tang, L. Wang, H. Han, H. Qiu, X. Liu and S. Jiang, RSC Adv., 2013, 3, 7894–7901 RSC.
- S. Tang, S. Liu, H. Ren, X. Liang, H. Qiu, Y. Guo, X. Liu and S. Jiang, RSC Adv., 2014, 4, 25819–25826 RSC.
- K. Kawakami, R. Takahashi, M. Shakeri and S. Sakai, J. Mol. Catal. B: Enzym., 2009, 57, 194–197 CrossRef CAS PubMed.
- M. Wu, H. Zhang, Z. Wang, S. Shen, X. Chris Le and X.-F. Li, Chem. Commun., 2013, 49, 1407–1409 RSC.
- D. Stoeckel, C. Kübel, K. Hormann, A. Höltzel, B. M. Smarsly and U. Tallarek, Langmuir, 2014, 30, 9022–9027 CrossRef CAS PubMed.
- K. Nakanishi, J. Porous Mater., 1997, 4, 67–112 CrossRef CAS.
- L. Yan, Q. Zhang, W. Zhang, Y. Feng, L. Zhang, T. Li and Y. Zhang, Electrophoresis, 2005, 26, 2935–2941 CrossRef CAS PubMed.
- J. Hu, X. Li, Y. Cai and H. Han, J. Sep. Sci., 2009, 32, 2759–2766 CrossRef CAS PubMed.
- Z. Zhang, H. Lin, J. Ou, H. Qin, R. Wu, J. Dong and H. Zou, J. Chromatogr. A, 2012, 1228, 263–269 CrossRef CAS PubMed.
- S. Bruns, T. Müllner, M. Kollmann, J. Schachtner, A. Höltzel and U. Tallarek, Anal. Chem., 2010, 82, 6569–6575 CrossRef CAS PubMed.
- S. Bruns, A. Höltzel and U. Tallarek, LCGC North Am., 2013, 31, 486–493 CAS.
- A. Daneyko, D. Hlushkou, S. Khirevich and U. Tallarek, J. Chromatogr. A, 2012, 1257, 98–115 CrossRef CAS PubMed.
- D. Hlushkou, K. Hormann, A. Höltzel, S. Khirevich, A. Seidel-Morgenstern and U. Tallarek, J. Chromatogr. A, 2013, 1303, 28–38 CrossRef CAS PubMed.
- T. Hara, S. Makino, Y. Watanabe, T. Ikegami, K. Cabrera, B. Smarsly and N. Tanaka, J. Chromatogr. A, 2010, 1217, 89–98 CrossRef CAS PubMed.
- T. Hara, S. Mascotto, C. Weidmann and B. M. Smarsly, J. Chromatogr. A, 2011, 1218, 3624–3635 CrossRef CAS PubMed.
- M. Motokawa, H. Kobayashi, N. Ishizuka, H. Minakuchi, K. Nakanishi, H. Jinnai, K. Hosoya, T. Ikegami and N. Tanaka, J. Chromatogr. A, 2002, 961, 53–63 CrossRef CAS.
- K. Miyamoto, T. Hara, H. Kobayashi, H. Morisaka, D. Tokuda, K. Horie, K. Koduki, S. Makino, O. Núñez, C. Yang, T. Kawabe, T. Ikegami, H. Takubo, Y. Ishihama and N. Tanaka, Anal. Chem., 2008, 80, 8741–8750 CrossRef CAS PubMed.
- T. Hara, H. Kobayashi, T. Ikegami, K. Nakanishi and N. Tanaka, Anal. Chem., 2006, 78, 7632–7642 CrossRef CAS PubMed.
- S. Bruns and U. Tallarek, J. Chromatogr. A, 2011, 1218, 1849–1860 CrossRef CAS PubMed.
- W. S. Rasband, ImageJ, U.S. National Institutes of Health, Bethesda, MD, 1997–2011, http://rsb.info.nih.gov//ij/ Search PubMed.
- F. Luisier, PureDenoise, Biomedical Imaging Group, École Polytechnique Fédéral de Lausanne, 2010, http://bigwww.epfl.ch/algorithms/denoise Search PubMed.
- J. Courtois, M. Szumski, F. Georgsson and K. Irgum, Anal. Chem., 2007, 79, 335–344 CrossRef CAS PubMed.
- S. Bochkanov and V. Bystritsky, ALGLIB, www.alglib.net Search PubMed.
- K. Wojtach, M. Laczka, K. Choewa-Kowalska, Z. Olejniczak and J. Sokolowska, J. Non-Cryst. Solids, 2007, 353, 2099–2103 CrossRef CAS PubMed.
- S. Araki, S. Imasaka, S. Tanaka and Y. Miyake, J. Membr. Sci., 2011, 380, 41–47 CrossRef CAS PubMed.
- K. Nakanishi and N. Soga, J. Am. Ceram. Soc., 1991, 74, 2518–2530 CrossRef CAS PubMed.
- H. Minakuchi, K. Nakanishi, N. Soga, N. Ishizuka and N. Tanaka, J. Chromatogr. A, 1997, 762, 135–146 CrossRef CAS.
- N. Ishizuka, H. Minakuchi, K. Nakanishi, N. Soga and N. Tanaka, J. Chromatogr. A, 1998, 797, 133–137 CrossRef CAS.
- M. Thommes, Physical adsorption characterization of ordered and amorphous mesoporous materials, in Nanoporous Materials: Science and Engineering, ed. G.Q. Lu and X.S. Zhao, Imperial College Press, London, 2004, pp. 317–364 Search PubMed.
- M. Thommes, R. Skudas, K. K. Unger and D. Lubda, J. Chromatogr. A, 2008, 1191, 57–66 CrossRef CAS PubMed.
- N. Tanaka, H. Kobayashi, K. Nakanishi, H. Minakuchi and N. Ishizuka, Anal. Chem., 2001, 73, 420A–429A CrossRef CAS.
- J. C. Giddings, Dynamics of Chromatography, Part 1: Principles and Theory, Marcel Dekker, New York, NY, 1965 Search PubMed.
- F. Gritti and G. Guiochon, J. Chromatogr. A, 2009, 1216, 4752–4767 CrossRef CAS PubMed.
- D. Hlushkou, S. Bruns, A. Höltzel and U. Tallarek, Anal. Chem., 2010, 82, 7150–7159 CrossRef CAS PubMed.
- W. Gille, D. Enke and F. Janowski, J. Porous Mater., 2002, 9, 221–230 CrossRef CAS.
- W. Gille, D. Enke and F. Janowski, J. Porous Mater., 2001, 8, 179–191 CrossRef CAS.
- T. Aste and T. Di Matteo, Phys. Rev. E: Stat., Nonlinear, Soft Matter Phys., 2008, 77, 021309 CrossRef CAS.
- S. Bruns, D. Stoeckel, B. M. Smarsly and U. Tallarek, J. Chromatogr. A, 2012, 1268, 53–63 CrossRef CAS PubMed.
- K. Hormann, T. Müllner, S. Bruns, A. Höltzel and U. Tallarek, J. Chromatogr. A, 2012, 1222, 46–58 CrossRef CAS PubMed.
- K. Hormann and U. Tallarek, J. Chromatogr. A, 2013, 1312, 26–36 CrossRef CAS PubMed.
- T. Müllner, A. Zankel, F. Svec and U. Tallarek, Mater. Today, 2014, 17, 404–411 CrossRef PubMed.
- D. Hlushkou, S. Bruns and U. Tallarek, J. Chromatogr. A, 2010, 1217, 3674–3682 CrossRef CAS PubMed.
- A. Daneyko, S. Khirevich, A. Höltzel, A. Seidel-Morgenstern and U. Tallarek, J. Chromatogr. A, 2011, 1218, 8231–8248 CrossRef CAS PubMed.
- K. Cabrera, LCGC North Am., 2012, 30, 30–35 Search PubMed.
- S. Altmaier and K. Cabrera, J. Sep. Sci., 2008, 31, 2551–2559 CrossRef CAS PubMed.
| This journal is © The Royal Society of Chemistry 2015 |