DOI:
10.1039/C4RA16357E
(Paper)
RSC Adv., 2015,
5, 14407-14415
Multiwall carbon nanotube-modified electrode as a nanosensor for electrochemical studies and stripping voltammetric determination of an antimalarial drug
Received
14th December 2014
, Accepted 22nd January 2015
First published on 23rd January 2015
Abstract
A sensitive electrochemical method based on adsorptive stripping differential pulse voltammetry (AdSDPV) developed for the determination of an antimalarial drug, hydroxychloroquine (HCQ), using a multi-walled carbon nanotube (MWCNTs)-modified carbon paste electrode (MWCNTs/CPE). The modified nanosensor due to its enhanced conductivity showed a very large current response from the electroactive substrate. The modified electrode was characterized by different methods such as scanning electron microscopy (SEM) and cyclic voltammetry (CV). Also, some techniques including CV, chronoamperometry (CHA) and chronocoulometry (CHC) were used for electrochemical studies of HCQ. It was observed that by employing MWCNTs/CPE, a 4-fold enhancement in the HCQ signal was observed as compared to the carbon paste electrode (MWCNTs/CPE). Under the optimized conditions, the differential pulse voltammetric peak current was proportional to the HCQ concentration in the range of 5.7 × 10⁻⁸ M to 1 × 10⁻⁴ M with a detection limit (S/N = 3) of 6.0 nM. The analytical applications of the modified sensor were demonstrated by estimating HCQ in pharmaceutical formulations and biological fluids. Also, the modified electrode showed good reproducibility, long-term stability and anti-fouling effects.
1. Introduction
Hydroxychloroquine (HCQ) (Scheme 1) is a hydroxylated form of the antimalarial drug chloroquine that was first synthesized in the 1940s. Shortly thereafter, it was discovered to be as useful as, but less toxic than, chloroquine and became a mainstay of malaria prevention and treatment strategies. Over the years, HCQ has also been shown to provide valuable effects for systemic and cutaneous lupus erythematosus conditions, chronic Q fever, rheumatoid arthritis, and several skin disorders and is now routinely applied in the management of these diseases.1,2 HCQ is most commonly prescribed orally, either as 200 or 400 mg of the sulfate salt. A single drug regimen may not be optimal for all patients, however, as several studies report marked pharmacokinetic variability for HCQ.3 An additional challenge of HCQ treatment is distinguishing non-compliance from refractory disease. Patient self-reports, electronic monitoring devices, clinician's assessments and other strategies are commonly used to distinguish between these two possibilities but are not always effective or accurate. Quantitative HCQ blood levels may provide an additional, and more reliable, means of distinguishing and resolving these two types of clinical scenario.4,5 Most of the analytical procedures for the quantification of HCQ apply chromatographic techniques,6–8 which may have disadvantages such as the need of sample pretreatment, large consummating chemicals, and long analysis time, thereby causing high amounts of waste. So far, few electrochemical methods have been used for the study of chloroquine drugs.9–11 Arguelho et al.9 demonstrated electrochemical reduction of HCQ at the surface of glassy carbon electrode (GCE). They reported a linear concentration range from 2 × 10⁻⁵ M to 5 × 10⁻⁴ M, with a limit of detection of 11.2 μg mL−1 for HCQ. Mashhadizadeh et al.10 introduced an electroanalytical methodology for determining of chloroquine using DPV at a Cu(OH)2 nano-wire-modified electrode. Based on the paper chloroquine showed a linear dynamic range from 0.068 μg mL−1 to 6.88 μg mL−1 with a detection limit of 0.01 μg mL−1. Recently, Deroco et al.11 reported a square wave voltammetry (SWV) method for the determination of HCQ with a cathodically pretreated boron-doped diamond electrode. In the study, obtained SWV analytical curve showed a linear response from 0.1 μg mL−1 to 1.9 μmol L−1, with a detection limit of 0.06 μmol L−1. Electroanalytical techniques using modified electrodes commonly have some advantages over chromatographic techniques, such as shorter analysis times, lower consumption of chemicals, and lower cost of instrumentation.12
 |
| | Scheme 1 Chemical structure of HCQ. | |
Carbon nanotubes (CNTs) are most promising materials to modify the electrodes because of their unique ability to promote electron transfer kinetics and make them attractive for sensing applications.13,14 CNTs are of ultra-light weight with high surface area, excellent electronic conductivity and have chemical and thermal stability.15 CNTs consist of cylinders of graphite layers with both ends capped with half fullerene.16 CNTs are formed in two principal types containing single-walled carbon nanotubes (SWCNTs) and multi-walled carbon nanotubes (MWCNTs).17 SWCNTs are formed by seamlessly rolling a single graphene sheet with closed ends, in certain directions, while MWCNTs consist of arrays of such concentric graphitic layers separated by 3.4 Å.18
Our objective in the present work was to develop a voltammetric sensor for the electrochemical studies and quantification of HCQ. In this study, our aim was to use a simple and convenient method of modification i.e. incorporating the MWCNTs in a carbon paste electrode (MWCNTs/CPE) in order to fabricate a highly sensitive sensor and free from interferences of other bio-molecules for determination of HCQ. Analytical applications of the MWCNTs/CPE were demonstrated by estimating the HCQ content in pharmaceutical formulations and biological samples.
2. Experimental
2.1. Reagents
HCQ, carbon graphite powder, paraffin oil (ρ = 0.88 g cm−3) and other chemicals were obtained from Merck. MWCNT with purity of >95% was purchased from the Chinese Academy of Science. All aqueous solutions were prepared in demineral water and the experiments were performed at room temperature. Phosphate buffer solution (PBS) was prepared by 0.2 M phosphoric acid and a saturated solution of sodium hydroxide to obtain different pH values. 1.0 × 10⁻³ M HCQ stock standard solution was prepared. Working standard solutions were prepared by proper dilution of the stock standard solution with buffer.
2.2. Apparatus
Electrochemical experiments were conducted using a Sama 500 potentiostat (Isfahan, Iran). All measurements were carried out in a conventional three-electrode system with an unmodified or modified carbon paste electrode (1 mm in diameter) as a working electrode, a platinum wire (Metrohm, Switzerland) as an auxiliary electrode and Ag/AgCl electrode (Metrohm, Switzerland) as a reference electrode. The pH measurements were performed using 691 pH meter (Metrohm, Switzerland) to adjust the pH of the buffer solution, which was used as the supporting electrolyte. Demineral water was prepared with an ultrapure water system (smart 2 pure, TKA, Germany). Scanning electron microscope employed for surface characterization of the electrodes was KYKY-EM3200 with an operating voltage of 26 kV. An ultrasound bath (Bandelin Sonorex, Germany), operated at a constant frequency of 35 kHz was used for the experiments.
2.3. Preparation of bare and MWCNTs modified carbon paste electrodes
The CPE was prepared as follows: 0.50 g of reagent grade graphite powder was taken and mixed with 0.2 mL of paraffin oil. The carbon paste was packed into a Teflon holder that had been cut off at the end. Electrical contact to the paste was established through a thin copper rod passed through the Teflon holder.
For preparation of the MWCNTs/CPE, different amounts of MWCNTs was mixed with 0.50 g graphite powder and then 0.20 mL of paraffin oil was added to the mixture and mixed for 30 min until a uniformly wetted paste was formed. The paste was then filled in a Teflon holder. The fresh surface was obtained by polishing the electrode on a clean paper until it showed a smooth appearance.
3. Results and discussion
3.1. Surface characterization of the MWCNTs/CPE
Fig. 1 compares the morphological features of (a) CPE and (b) MWCNTs/CPE using scanning electron microscope (SEM). SEM was applied to evaluate the physical appearance and surface characteristics of MWCNTs on the CPE surface. The SEM profile of CPE was characterized by a surface of irregularly shaped graphite particles that appeared to remain isolated (Fig. 1a). The SEM image of MWCNTs/CPE, as observed in Fig. 1b, shows different morphology than the CPE. Thus, the current increase at the MWCNTs/CPE could be attributed to presence of MWCNTs and increased surface area because of MWCNTs as compared to CPE.
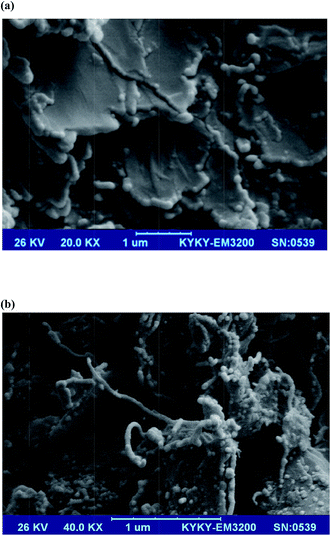 |
| | Fig. 1 SEM micrographs of (a) CPE and (b) MWCNTs/CPE. | |
3.2. Voltammetric behaviour of HCQ at the modified electrode
Fig. 2 shows the cyclic voltammograms of 1.0 μM HCQ recorded at CPE and MWCNTs/CPE in 0.2 M PBS of pH 8.0. HCQ shows two oxidation peaks at the both bare and modified electrodes. The second anodic peak did not show enough sensitivity and therefore, the first anodic peak is used in the further studies. The anodic peak current (Ipa) of HCQ at CPE (Fig. 2, curve (a)) and MWCNTs/CPE (Fig. 2, curve (c)) were measured to be 0.08 and 0.32 μA, respectively. Four times increase in current sensitivity was observed for HCQ oxidation at MWCNTs/CPE. MWCNTs carry edge plane sites/defects at its open ends and along the tube axis. The edge plane sites act as reactive centres for different analytes. This edge plane and the defect sites cause an increase in surface area and therefore enhance current sensitivity. Thus, different peak currents might be easily related to the different active surface area of the two electrodes, accordingly to what has been commented previously about the surface characterization (Fig. 1).
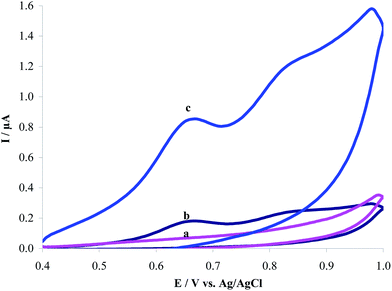 |
| | Fig. 2 Cyclic voltammograms of (a) modified MWCNTs/CPE in 0.2 M PBS of pH 8.0; (b) as (a) + 1.0 μM HCQ at the surface of unmodified CPE; (c) as (a) + 1.0 μM HCQ. Scan rate: 120 mV s−1. | |
3.3. Optimization of experimental conditions
Compared to the unmodified CPE, the MWCNTs/CPE displayed a higher sensitivity for HCQ according to the above voltammetric data so that a sensitive voltammetric technique could be developed at the surface of MWCNTs/CPE. But, before establishing the detection method, a series of tests to select the optimum experimental variables were performed.
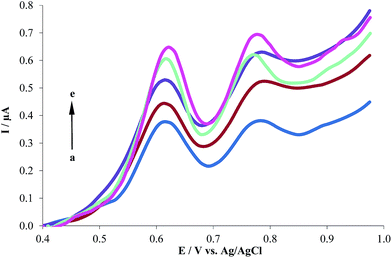
3.3.1. Effect of accumulation time and accumulation potential. The influence of accumulation time and accumulation potential on the oxidation peak current of HCQ at the MWCNTs/CPE in 0.2 M PBS was investigated. It was found that the oxidation peak current of HCQ progressively increases to 90 s accumulation time. However, the oxidation peak current kept almost unchanged above 90 s (Fig. 3). These results indicating that HCQ accumulated on MWCNTs/CPE in a short time, which should be due to that the adsorptive capability of MWCNTs/CPE is improved. Accumulation on the electrode surface by adsorption is a process that can be related to only surface modified electrode not diffusion process. Also, the peak current increased with the changing in accumulation potential from 0.4 V to 0.0 V, and then decrease from 0.0 V to −0.4 V (Fig. 4), indicating that the peak current is almost independent of accumulation potential. Therefore, an electrostatic effect on the possible adsorption phenomenon occurs for 90 s accumulation time when an open circuit is adopted.
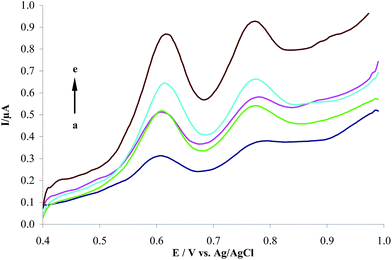 |
| | Fig. 3 Effect of accumulation time on the stripping oxidation current of 1.0 μM HCQ in 0.2 M PBS at the MWCNTs/CPE. (a) to (e) correspond to 0, 30, 60, 90 and 120 s accumulation time. | |
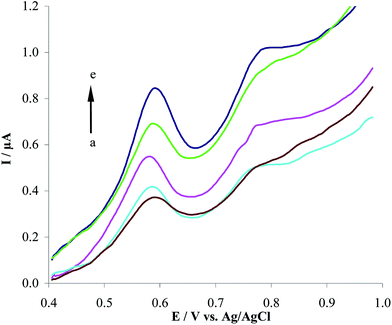 |
| | Fig. 4 Effect of accumulation potential on the stripping oxidation current of 1.0 μM HCQ in 0.2 M PBS at the MWCNTs/CPE. (a) to (e) correspond to 0.4, 0.2, 0.0, −0.2 and −0.4 V accumulation potential at 90 s accumulation time. | |
3.3.2. Effect of amount of MWCNTs on HCQ oxidation. The amount of MWCNTs used in the modified electrode plays an important role in the performance of the sensor. Therefore, to obtain the best conditions in preparation of the sensor, different amount of MWCNTs (2.0–6.0 mg) was applied in CPE. The experiments were performed and the corresponding Ipa were recorded at the MWCNTs/CPE (Fig. 5). Maximum current sensitivity was achieved when the electrode was modified with 5.0 mg of MWCNTs. Thus, the amount was selected for preparation of the modified sensor.
 |
| | Fig. 5 Plot of Ipa of 1.0 μM HCQ with different quantities of MWCNTs. (a) to (e) correspond to 2.0, 3.0, 4.0, 5.0 and 6.0 mg of MWCNTs. | |
3.3.3. The effect of electrolyte. The effects of supporting electrolyte were investigated on the DPV responses of 1.0 μM HCQ at the MWCNTs/CPE in 0.2 M KCl (a), acetate (b), Britton–Robinson (c), and phosphate (d) buffers, as shown in Fig. 6. The MWCNTs/CPE showed the most well-defined anodic peak and sensitive response to HCQ in PBS. So, PBS was selected as the supporting electrolyte in the following experiments.
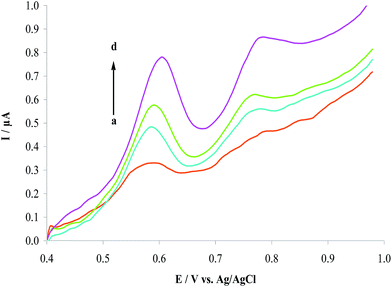 |
| | Fig. 6 Differential pulse voltammograms of 1.0 μM HCQ at the MWCNTs/CPE in the presence of 0.2 M different supporting electrolyte, (a) to (d) correspond to KCl, acetate, Britton–Robinson and phosphate buffers, respectively. | |
3.3.4. Effect of pH. The pH value of the supporting electrolyte is an important factor in determining the performance of electrochemical sensors. Therefore, the influence of pH on the electrochemical behavior of HCQ was investigated by adsorptive stripping differential pulse voltammetry (AdSDPV) for 1.0 μM HCQ in 0.2 M PBS of different pH ranging from 4.0 to 9.0. As displayed in Fig. 7A, it is clear that changing the pH of the supporting electrolyte altered both the peak current and the peak potential of HCQ. Thus, the oxidation of HCQ at the MWCNTs/CPE is a pH-dependent reaction and protonation/deprotonation takes part in the charge transfer process. The relationship between the anodic peak potential and the solution pH value is demonstrated in Fig. 7B. This relationship could be fit to the linear regression equation as Epa (V) = 0.3541–0.0543 pH with a correlation coefficient of 0.9956. The anodic peak potential was shifted negatively with the increase of solution pH. The slope (−0.0543 V/pH) is close to the theoretical value (−0.059 V/pH) demonstrating that the electrode process is two-proton coupled two-electron transfer.19 Also, the highest oxidation peak current was obtained at pH 8.0 (Fig. 7C). Thus, PBS/pH 8.0 was used for the determination of HCQ to achieve higher sensitivity. Also, proposed redox reaction mechanism of HCQ has been presented in Scheme 2.
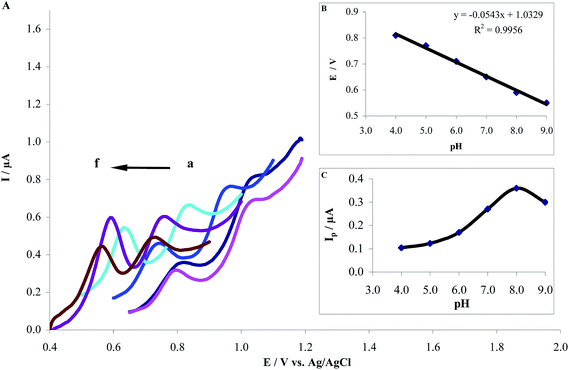 |
| | Fig. 7 (A) Dependence of the anodic peak potential of 1.0 μM HCQ/0.2 M PBS on pH value of the solution at MWCNTs/CPE. (a) to (f) correspond to pH values of 4.0, 5.0, 6.0, 7.0, 8.0 and 9.0, respectively. (B) Electrochemical potential, Epa (V) vs. pH and (C) dependence of the anodic peak current of HCQ on pH value. | |
 |
| | Scheme 2 Mechanism of HCQ oxidation at the MWCNTs/CPE. | |
3.4. Chronoamperometric studies
Chronoamperometry (CHA) is one of electrochemical methods employed for the investigation of electrode processes at chemically modified electrodes. Chronoamperometric measurements of different concentrations of HCQ at the MWCNTs/CPE were shown in Fig. 8A by setting the working electrode potential at 1.0 V. Using this technique the diffusion coefficient, D, of HCQ can be determined. For an electroactive material with a diffusion coefficient of D/cm2 s−1, the current for the electrochemical reaction (at a mass transport limited rate) is described by the Cottrell equation (eqn (1)):20| | |
I = nFAD1/2Cπ−1/2t−1/2
| (1) |
where D/cm2 s−1 and C/mol−1 cm−3 are the diffusion coefficient and the bulk concentration, respectively. Under diffusion control, a plot of I versus t−1/2/s−1/2 will be linear, and the value of D/cm2 s−1 can be obtained from the slope. Fig. 8B demonstrates the fitted experimental plots for different concentrations of HCQ. The relationship between slopes of the resulting straight lines and the HCQ concentration (Fig. 8C), is described by the following equation:
| Slope = 23.797CHCQ + 11.414 (R2 = 0.9961) |
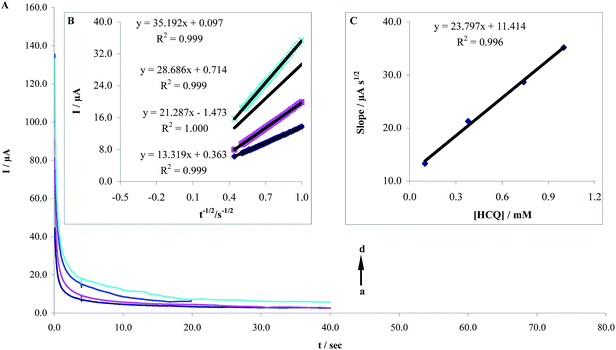 |
| | Fig. 8 (A) Chronoamperograms obtained at MWCNTs/CPE in pH 8.0 PBS for different concentration of HCQ by setting potential step at 1.0 V. The letters (a)–(d) corresponds to 0.4, 0.6, 0.8 and 0.1 μM of HCQ. (B) Plots of I vs. t−1/2/s−1/2 obtained from chronoamprograms and (C) plot of the slope of the straight lines against the HCQ concentration. | |
According these studies with assuming n = 2, the mean value of D/cm2 s−1 for HCQ was found to be 4.8 × 10⁻⁵ cm2 s−1.
3.5. Chronocoulometric studies
In previous section the diffusion coefficient of HCQ was calculated CHA. Another method for calculating the diffusion coefficient is chronocoulometry (CHC). From the chronocoulometric data, the diffusion coefficient of HCQ at the MWCNTs/CPE was calculated using Cottrell equation (eqn (2)):20| | |
Q = 2nFAD1/2Cπ−1/2t1/2
| (2) |
The chronocoulometric responses for different concentration of HCQ at the MWCNTs/CPE are shown in Fig. 9A. The experimental plots of Q versus t1/2 with the best fits for different concentration of HCQ and the slopes of the resulting lines versus the HCQ concentration were demonstrated in Fig. 9B and C, respectively. From the plot of slopes versus HCQ concentration and the Cottrell equation and taking n = 2 the D value of HCQ was estimated to be 4.6 × 10⁻⁵ cm2 s−1. This value is in agreement with the diffusion coefficient obtained from CHA measurements.
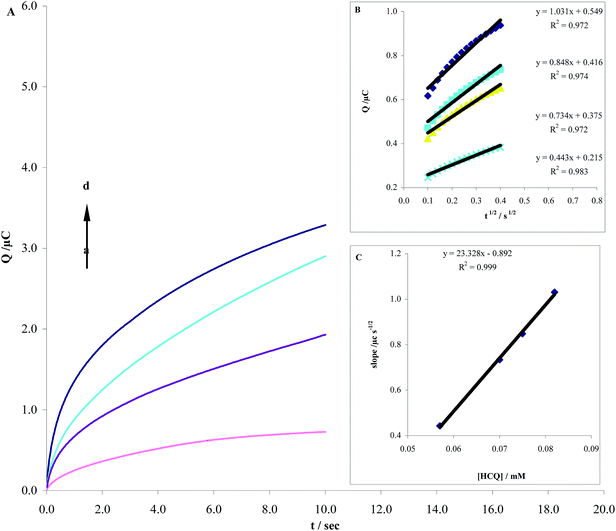 |
| | Fig. 9 (A) Chronocoulomograms obtained at MWCNTs/CPE in pH 8.0 PBS for different concentration of HCQ. The letters (a)–(d) corresponds to 0.4, 0.6, 0.8 and 0.1 μM of HCQ. (B) Plots of the charge (Q) vs. square root of the time (t1/2/s1/2) obtained from chronocoulomograms and (C) plot of the slope of straight lines against the HCQ concentration. | |
3.6. Effect of scan rate on the voltammetric response of HCQ
The effects of scan rate (ν) on the oxidation current of HCQ were examined at the MWCNTs/CPE (Fig. 10A). The relation between the anodic peak oxidation current, Ipa (mA) and scan rate, ν (V s−1), is given by eqn (3):20| | |
Ipa = 2.69 × 10⁵n3/2AD1/2Cν1/2
| (3) |
where n is the number of electrons exchanged in oxidation, A is the apparent surface area of the electrode (cm2), D is the diffusion coefficient, and C is the concentration of the electroactive species (mM). According the Fig. 10B, the peak current increased linearly with the increase of square root of scan rate ranging from 20 mV s−1 to 120 mV s−1, and it can be expressed as:
| Ipa = 0.8728ν1/2 − 0.067 (R2 = 0.991) |
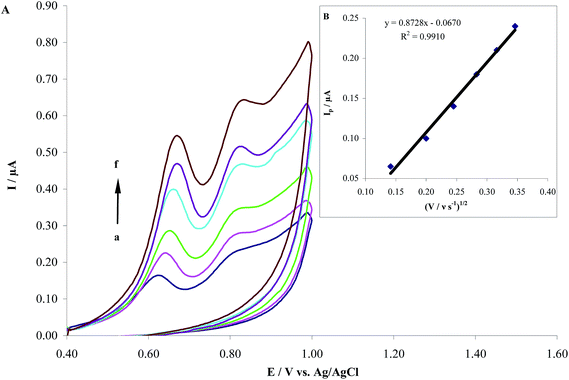 |
| | Fig. 10 (A) Cyclic voltammograms of 1.0 μM HCQ in PBS (pH 8.0) at MWCNTs/CPE with different scan rates, (a) to (f) correspond to 20, 40, 60, 80, 100 and 120 mV s−1, (B) plot of scan rate vs. oxidation peak current. | |
These results indicate that the electrode process is controlled by the diffusion step. It is noted that in the Section 3.3.1. we showed an accumulation effect on the electrode surface. But the two processes (adsorption and diffusion) cannot be in contradiction between each other because diffusion process is related to analyte transfer from bulk to electrode surface whereas adsorption process (accumulation on the electrode surface) is related to only surface electrode.
Also the rising part of the cyclic voltammograms is known as the Tafel region, which is affected by the electron transfer kinetics between HCQ and the modified electrode. If deprotonation of HCQ is a sufficiently fast step, with assuming the number of electrons involved in the rate determining step of nα = 2, charge transfer coefficient (α) and ionic exchanging current density (j0) can be calculated by the slope and intercept of the Tafel plot, respectively.20 From these results, values for α and j0 in the anodic oxidation of HCQ were found to be 0.52 and 0.97 μA cm−2, respectively (Fig. 11).
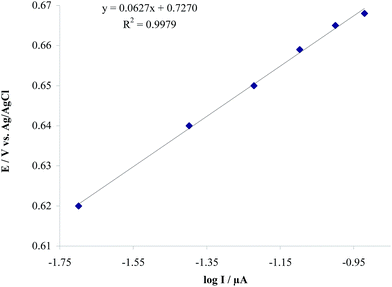 |
| | Fig. 11 Tafel plot derived from Fig. 10A in scan rate of 120 mV s−1. | |
3.7. Analytical properties
3.7.1. Determination of HCQ by AdSDPV. Fig. 12A shows the anodic adsorptive stripping voltammograms obtained of MWCNTs/CPE in 0.2 M PBS pH 8.0 with different HCQ concentrations. Under the optimized experimental conditions, the calibration curve showed two linear dynamic ranges. The first linear dynamic range was between 5.7 × 10⁻⁸ M to 1.8 × 10⁻⁶ M and the second was between 1.8 × 10⁻⁶ M to 1.0 × 10⁻⁴ M. The relationship between peak current and concentration can be described with the following linear regression equations for the first and second linear dynamic ranges (Fig. 12B):
| Ipa (μA) = 0.368CHCQ + 0.054 (R2 = 0.998) |
| Ipa (μA) = 0.015CHCQ + 0.775 (R2 = 0.991) |
A detection limit of 6.0 nM was obtained using the relations 3Sb/b, where Sb is the blank standard deviation and b the slope of the calibration curve.21
3.7.2. Interference study. Under the optimal conditions the interferences of various foreign species have been evaluated at the surface of MWCNTs/CPE. The tolerance limit was considered as the maximum concentration that gave a relative error less than ±5.0% at a concentration of 1.0 μM of HCQ. The results showed that 200-fold excess of Zn2+, Na+, K+, NH4+, Cl−, SO42−, CO32−, oxalic acid, L-phenyl alanine, L-glycin; 100-fold excess of epinephrine, uric acid and 20-fold excess of dopamine did not interfere with the analysis of HCQ. This suggests that the determination of HCQ in the real samples is not affected considerably by the common interfering species.
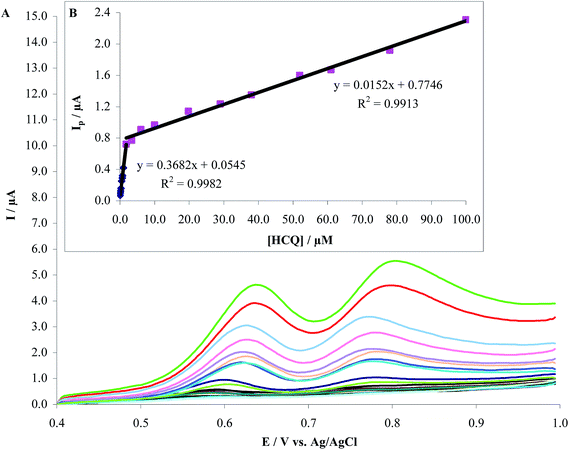 |
| | Fig. 12 (A) Differential pulse voltammograms recorded at MWCNTs/CPE in 0.2 M PBS at pH 8.0 after addition of HCQ to give final solution concentrations in the range of 5.7 × 10⁻⁸ M to 1.0 × 10⁻⁴ M. Scan rate: 120 mV s−1 and 90 s accumulation time. (b) Plots of peak current as a function of HCQ concentration. | |
3.7.3. Repeatability and stability. The ability to create a repeatable electrode surface was examined using AdSDPV data from four separately prepared MWCNTs/CPEs for 0.7 μM of HCQ. The calculated RSD for peak current (1–3%) suggested that surface repeatability was satisfactory. This degree of repeatability is close to the same as that expected for an ordinary carbon paste surface.22 In addition, in order to investigate the stability of MWCNTs/CPE, the AdSDPV for 0.7 μM of HCQ/0.2 M PBS/pH 8.0 solution was recorded for a two week period. The results showed that the anodic peak current remained fairly stable without any noticeable decrease in the voltammetric response. Thus, MWCNTs/CPE showed good reproducibility, high long-term stability, low detection limit, enhanced sensitivity and anti-interference ability.
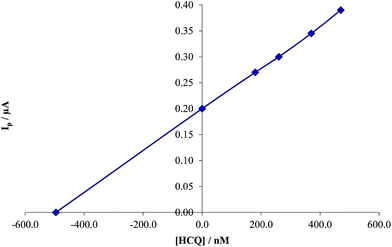 |
| | Fig. 13 Standard addition plot of 480.0 nM HCQ at the MWCNTs/CPE in 0.2 M PBS at pH 8.0 in human blood serum samples. | |
3.8. Analytical application
3.8.1. Determination of HCQ in medical samples. The performance of the proposed method was investigated by analyzing HCQ tablet samples. The contents of 10 tablets of HCQ were weighed for obtaining the average mass of each tablet. Then these powdered and an amount of one tablet were transferred to a 100.0 mL beaker and dissolved in demineral water, then the solution filtered and diluted in a 50.0 mL volumetric flask to the mark with demineral water. Proper aliquots from the working solutions were taken for the voltammetric determination of them by AdSDPV technique in the standard addition mode, and diluted with buffer to obtain final concentrations in the range of calibration curve. The results are summarized in Table 1 with the recoveries between 98.9 and 102.4. The recovered ratio indicated that MWCNTs/CPE could be applied for the routine analytical control of pharmaceuticals.
Table 1 Determination of HCQ in tablet samples as determined by AdSDPV in 0.2 M PBS (pH 8.0)
| Sample |
Added (nM) |
Founded (nM) |
Recovery (%) |
| 1 |
290.0 |
287.0 |
98.9 |
| 2 |
540.0 |
553.2 |
102.4 |
| 3 |
580.0 |
593.0 |
102.2 |
| 4 |
730.0 |
725.0 |
99.3 |
3.8.2. Determination of HCQ in human blood serum. In order to evaluate the analytical applicability of the proposed method, also it was applied to the determination of HCQ in human blood serum samples. The samples were found to be free from HCQ. Therefore different amounts of HCQ were spiked to the sample and analyzed by the proposed method (Fig. 13). The results for determination of HCQ at the surface of MWCNTs/CPE in real samples are given in Table 2. Satisfactory recovery of the results confirms that the modified electrode retained its efficiency for the determination of HCQ in real samples.
Table 2 The application of MWCNTs/CPE for determination of HCQ in human blood serum samples
| Sample |
Added (nM) |
Founded (nM) |
Recovery (%) |
| 1 |
0.0 |
Not detected |
— |
| 2 |
480.0 |
473.0 |
98.5 |
| 3 |
660.0 |
670.0 |
101.5 |
| 4 |
740.0 |
722.0 |
97.5 |
4. Conclusions
This work has shown a novel nanostructured composite material based on MWCNTs with unique properties, such as high specific surface area and special electronic properties for the analyzing of HCQ. Adsorptive stripping voltammetry at MWCNTs/CPE has been shown to be suitable for the determination of nanomolar levels of HCQ. The method has been employed for the determination of HCQ in pharmaceutical formulations and blood serum samples. Since HCQ is used for treatment of some diseases such as malaria, it is expected that the proposed method will be useful in its determination in pharmaceutical formulations and biological fluids and thus would be of great help to both clinical and pharmaceutical industries.
Acknowledgements
We are grateful to University of Kashan for supporting this work with Grant no. 211037-12.
References
- I. Ben-Zvi, S. Kivity, P. Langevitz and Y. Shoenfeld, Clin. Rev. Allergol. Immunol., 2012, 42, 145 CrossRef CAS PubMed.
- M. Petri, Curr. Rheumatol. Rep., 2011, 13, 77 CrossRef CAS PubMed.
- N. Costedoat-Chalumeau, Z. Amoura, J. S. Hulot, H. A. Hammoud, G. Aymard, P. Cacoub, C. Francès, B. Wechsler, L. T. Huong du, P. Ghillani, L. Musset, P. Lechat and J. C. Piette, Arthritis. Rheum., 2006, 54, 3284 CrossRef CAS PubMed.
- C. Francès, A. Cosnes, P. Duhaut, N. Zahr, B. Soutou, S. Ingen-Housz-Oro, D. Bessis, J. Chevrant-Breton, N. Cordel, D. Lipsker and N. Costedoat-Chalumeau, Arch. Dermatol., 2012, 148, 479 CrossRef PubMed.
- N. Costedoat-Chalumeau, Z. Amoura, J.-S. Hulot, G. Aymard, G. Leroux, D. Marra, P. Lechat and J.-C. Piette, Ann. Rheum. Dis., 2007, 66, 821 CrossRef CAS PubMed.
- A. R. M. de Oliveira and P. S. Bonato, J. Sep. Sci., 2007, 30, 2351 CrossRef PubMed.
- L.-Z. Wang, R. Y.-L. Ong, T.-M. Chin, W.-L. Thuya, S.-C. Wan, A. L.-A. Wong, S.-Y. Chan, P. C. Ho and B.-C. Goh, J. Pharm. Biomed. Anal., 2012, 61, 86 CrossRef CAS PubMed.
- A. K. Fuezery, A. R. Breaud, N. Emezienna, S. Schools and W. A. Clarke, Clin. Chim. Acta, 2013, 421, 79 CrossRef PubMed.
- M. L. P. M. Arguelho, J. F. Andrade and N. R. Stradiotto, J. Pharm. Biomed. Anal., 2003, 32, 269 CrossRef CAS.
- M. H. Mashhadizadeh and M. Akbarian, Talanta, 2009, 78, 1440 CrossRef CAS PubMed.
- P. B. Deroco, F. C. Vicentini, G. G. Oliveira, R. C. Rocha-Filho and O. Fatibello-Filho, J. Electroanal. Chem., 2014, 71, 19 CrossRef PubMed.
- L. F. Xiao, J. Chen and C. S. Cha, J. Electroanal. Chem., 2000, 495, 27 CrossRef CAS.
- P. R. Chang, P. W. Zheng, B. X. Liu, D. P. Anderson, J. G. Yu and X. F. Ma, J. Hazard. Mater., 2011, 186, 2144 CrossRef CAS PubMed.
- A. Khoobi, S. M. Ghoreishi, M. Behpour and S. Masoum, Anal. Chem., 2014, 86, 8967 CrossRef CAS PubMed.
- Y. Lin, S. Taylor, H. Li, K. A. S. Fernando, L. Qu, W. Wang, L. Gu, B. Zhou and Y.-P. Sun, J. Mater. Chem., 2004, 14, 527 RSC.
- H. Dai, Surf. Sci., 2002, 500, 218 CrossRef CAS.
- C. N. R. Rao, B. C. Satishkumar, A. Govindaraj and M. Nath, Chem. Phys. Chem., 2001, 2, 78 CrossRef CAS.
- P. M. Ajayan, Chem. Rev., 1999, 99, 1787 CrossRef CAS PubMed.
- N. F. Atta, M. F. El-Kady and A. Galal, Anal. Biochem., 2010, 400, 78 CrossRef CAS PubMed.
- A. J. Bard and L. R. Faulkner, Electrochemical Methods, Fundamentals and Applications, Wiley, New York, 2001 Search PubMed.
- J. C. Miller and J. N. Miller, Statistic for Analytical Chemistry, Ellis Horwood PTR, Prentice Hall, New York, 1993 Search PubMed.
- P. W. Geno, K. Ravichandran and R. P. Baldwin, J. Electroanal. Chem.
Interfacial Electrochem., 1985, 183, 155 CrossRef CAS.
|
| This journal is © The Royal Society of Chemistry 2015 |
Click here to see how this site uses Cookies. View our privacy policy here. 


