Nitrogen removal from municipal wastewater by a bioreactor containing ceramic honeycomb
Wenping Cao*
School of Environmental Engineering, Xuzhou Institute of Technology, Jiangsu 221000, P. R. China. E-mail: wenpingcao2013@163.com
First published on 15th January 2015
Abstract
Ceramic honeycombs were used as bio-carriers for removal of nitrogen from municipal wastewater by a bioreactor under aerobic conditions. Firstly, we investigated the removal rates of total nitrogen and ammonium, nitrite and nitrate forms of nitrogen. The experimental results demonstrated that the removal rates of total and ammonium nitrogen averaged 52.61 and 45.71% at a hydraulic retention time of 1 h, and the nitrite and nitrate nitrogen concentrations remained at low levels in influent and effluent throughout the experiment. Then, we investigated whether the nitrification and denitrification processes could occur simultaneously in a reactor using isolation and biological diversity analyses. Finally, the simultaneous nitrification and denitrification mechanisms in the bioreactor containing the ceramic honeycomb were analyzed. The conclusion was that the special structural feature of the ceramic honeycomb served as a bio-carrier, resulting in aerobic and anoxic zones co-existing in the system.
1 Introduction
Pollution by nitrogen compounds is recognized as one of the main causes of water quality degradation in water bodies all over the world. Many regions have identified eutrophication and other adverse effects as increasing problems in estuaries and coastal areas.1,2 With the application of more stringent TN (total nitrogen) discharge criteria in China, the removal of nitrogen compounds is of increasing importance. The removal of TN (i.e. NH4+–N (ammonium nitrogen), NO3−–N (nitrate nitrogen) and NO2−–N (nitrite nitrogen)) from wastewater has become one of the most important issues in controlling the eutrophication of receiving water bodies. Several biological and physicochemical treatment methods have been developed to remove nitrogen compounds from wastewater. These include chemical removal processes (i.e. selective ion exchange for both NH4+–N and NO3−–N removal), physical removal methods (i.e. ammonia stripping by air at elevated pH, reverse osmosis and electrodialysis for NO3−–N removal) and biological removal methods.3 Compared with chemical and physical processes, the biological processes are economical and effective for removal of nitrogen compounds. The methods of biological removal of nitrogen include A/O (anaerobic–oxic), A2/O (anaerobic–anoxic–oxic) and A2/O2 (anaerobic–anoxic–oxic–oxic) processes; however, these methods involve high occupation and operational costs, because the nitrification and denitrification process achieves TN removal through either separate aerobic and anoxic units or by temporal division of the conditions in a sequencing batch reactor.4 Reducing the area required and simplifying operation control of biological removal of nitrogen are increasingly important.Some removal technologies including SND (simultaneous nitrification and denitrification), shortcut nitrification and denitrification, and ANAMMOX (anaerobic ammonium oxidation) have been widely researched and have resulted in some novel mechanisms for removing biological nitrogen compounds. The SND process is one of the most researched methods of TN removal, and has been researched since the 1990s, and its mechanism has three widely acknowledged factors: dissolved oxygen in the reactor, thickness of bio-film or floc and aeration strategy.5,6 SND has attracted significant attention in recent years due to its potential to eliminate the separate tanks required in conventional treatment plants for removing nitrogen compounds, thus simplifying plant design and saving space and time.7 Under identical overall conditions, SND in a single reactor may have advantages over the separated processes due to the reduction of reactor volume and time.8 Some researchers have obtained satisfactory nitrogen removal efficiency by SND in certain bio-film reactors, e.g. rotating biological contractors and fluidized bed bio-film reactors.6 SND can be carried out using dissolved oxygen control, thicker bio-films or floc and aeration strategies in a single bio-film reactor; however, the technologies are designed artificially, resulting in more complex management and higher operation costs. Reducing running costs and simplifying bioreactor design have become urgent problems for SND technology. Bio-film processing is one mainstream technology for removal of nitrogen compounds, and bio-carriers are a core technology of bio-film reactors.9,10 An excellent bio-carrier is necessary for minimizing running costs and enhancing operation efficiency for removal of nitrogen compounds.
In this study, we chose ceramic honeycombs as bio-carriers for removal of nitrogen compounds from municipal wastewater under aerobic conditions. A ceramic honeycomb is a honeycomb-like bio-carrier and, compared with other bio-carriers, has a sophisticated pore structure forming many different micro-environmental zones, which aid in increasing the efficiency of removal of nitrogen compounds. The two main objectives of our study were (1) to evaluate conversion efficiency of nitrogen compounds (i.e. NH4+–N, NO2−–N, NO3−–N and TN), and CODcr (chemical oxygen demand, using potassium dichromate (K2Cr2O7) as an oxidizer) with removal efficiency also being investigated; and (2) to discuss and confirm the mechanisms for removal of nitrogen compounds through the SND process in the bioreactor.
2 Materials and methods
2.1 Experimental setup and bio-carriers
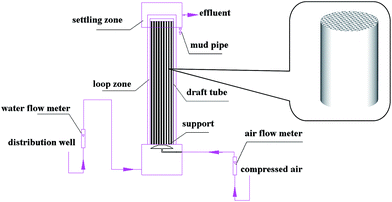
The bioreactor (Fig. 1) was fabricated with organic glass. Raw water was obtained from the influent of the wastewater treatment plant of Zhonghua in Kunshan city (Jiangsu, China). The raw water passed through a coarse grit (pitch of 20 mm), a fine grit (pitch of 6 mm) and a primary settling tank with HRT (hydraulic retention time) of 2 h. Then the pretreated raw water was pumped into the bottom of the bioreactor and the flow rate of influent was measured with a flow meter. Oxygen was supplied by a porous aerator from compressed air and also regulated by a flow meter. A draft tube with a diameter of 200 mm and a length of 1000 mm was installed in the center of the bioreactor chamber, which was split into two parts: the outer of the draft tube was a settler part and a raiser part was formed in the draft tube. There were four ceramic honeycomb bio-carriers with a diameter of 194 mm and length of 240 mm inside the draught tube, and a rubber ring between two bio-carriers was used to enhance the internal cycle efficiency of water in the bioreactor. The liquid/solid mass transfer coefficient would be increased due to the internal water cycle of the bioreactor, which effectively strengthened mass-transport advantages in the bioreactor. The top section of the bioreactor with a diameter of 330 mm and height of 200 mm served as an effluent settling zone.The profile of a honeycomb ceramic bio-carrier is shown in Fig. 1. The ceramic honeycomb was a honeycomb-like cylindrical shape, with 400 hexagonal honeycomb-like holes (3 mm × 3 mm) fabricated in its section. The number of micropores in the ceramic honeycomb increased the specific surface area and formed a complex microbial habitat. The porosity of the ceramic honeycomb was about 85.0% and specific surface area was approximately 280.0 m2 m−3.
2.2 Qualities of raw water
Most raw water from this area was pharmaceutical and chemical wastewater, and little was domestic sewage, resulting in raw water with high nitrogen compound concentrations and low C/N ratio, and especially high NH4+–N concentrations. Qualities of raw water were as follows (all mg L−1): CODcr of 165.1–220.1, biological oxygen demand (BOD5) of 28.7–41.9, NH4+–N of 52.7–88.5, TN of 65.8–108.2, NO2−–N of 0.07–1.12 and NO3−–N of 0.05–0.91; and pH values of 7.1–8.0. A HRT of 1 h was chosen to study the efficiency and mechanisms of nitrogen removal based on the efficiency of nitrogen removal in the above experiment; the HRT cannot be too long for engineering practice.2.3 Start-up of the bioreactor
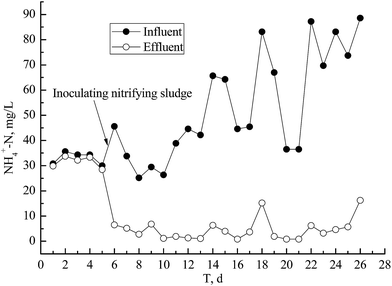
In the first 5 days of the start-up period, the CODcr removal rates reached 42.7–61.2%, but the NH4+–N removal rate was only 2.9–6.1%. To shorten the culture time of the nitrifying bacteria on the bio-carriers, the nitrification sludge obtained from a nitrification reactor was seeded into the bioreactor, and the NH4+–N removal rate substantially increased from 5.0 to 85.7% within 24 h. Steady-state bio-films were formed on the ceramic honeycombs within 5 days of seeding the nitrification sludge, and these bio-films contained diverse organisms including protozoa and metazoa.2.4 Performance of nitrification and denitrification using bio-films from ceramic honeycomb
Two 500 mL Erlenmeyer flasks were respectively utilized as batch reactors for nitrification and denitrification. The experiments were both carried out for 24 h at 30 °C and 100 rpm for a shaker based on the previous operation results and conditions, and initial pH of the synthetic wastewater was adjusted to 7.5 by using 0.5 M sodium carbonate.The aerobic flask was unsealed to maintain aerobic conditions and DO was kept at >4.0 mg L−1. The anoxic flask was sealed with rubber plugs to maintain anoxic conditions, and the gas generated from the flask was discharged through exhaust pipes installed in rubber plugs. Argon bubbling was used to maintain DO concentrations at <0.5 mg L−1 prior to experiment start-up and during sampling. Continuous acclimation for 1 week resulted in the formation of mature microorganisms of nitrification and denitrifying bacteria in the two separate flasks. Seed sludge as mentioned above was randomly isolated from the mature bio-films from honeycomb-like holes.
The aerobic flask was fed with synthetic wastewater, which was simulated with C6H12O6, NH4Cl and KH2PO4 dissolved in distilled water, and contained about 100 mg L−1 of NH4+–N and 150 mg L−1 of CODcr. The anoxic flask was also fed with synthetic wastewater that contained about 100 mg L−1 of NO3−–N and 150 mg L−1 of CODcr, from addition of C6H12O6, NaNO3 and KH2PO4.
2.5 Analytic methods used for water qualities and biological monitoring
CODcr, BOD5, NH4+–N, NO2−–N, NO3−–N and TN were measured according to standard methods,11 and all data generated were obtained through three replicate trials using one reactor. The water samples were collected every day and centrifuged for 2 min at 1000 rpm, and the supernatant fluid was analyzed for the components as for water samples, except for CODcr and BOD5. The nitrifying bacteria biomass was determined using the maximum probable number (MPN).3 Results
3.1 Effect of seed nitrification sludge on NH4+–N removal during start-up phase
The NH4+–N removal rate increased from 5.0 to 85.7% with the seeding of nitrifying bacteria during 5–6 days after commencement. The seed nitrification sludge was obtained from the nitrification unit of a two-phase BAF (biological aerobic filter). Most measured NH4+–N concentrations in effluent were lower than grade I (B) of the ‘Cities Sewage Treatment Plant Pollutant Discharged Standard of China’ (GB18918-2002) (<8 mg L−1 for water temperature of >12 °C) when HRT was 2 h except for at 18 and 26 days (Fig. 2).The NH4+–N removal rate was rapidly improved by seeding with nitrification sludge, which effectively shortened the time needed to develop a film-forming culture, until there was a steady state of biomass loading on the ceramic honeycomb. This was mainly due to a largely autotrophic microorganism population (e.g. nitrifying bacteria) present in the nitrification unit of the two-phase BAF.12 The nitrifying bacteria biomass in the seed nitrification sludge reached 3.5 × 10¹⁰ cfu according to MPN. The presence of autotrophic aerobic sludge was essential for the start-up of the nitrification bioreactor.
3.2 The profiles of nitrogen removal under aerobic conditions
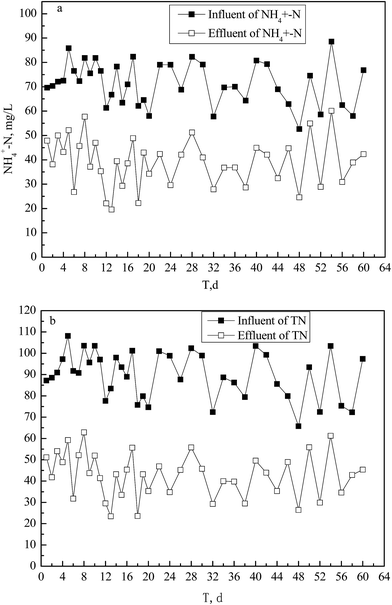
The influent water qualities for HRT of 1 h under aerobic conditions were (all mg L−1): DO of 1.8–2.5, TN of 65.8–108.2 and NH4+–N of 52.7–88.5. The removal ratio of TN was 38.8–65.4% with a mean value of 52.6% and of NH4+–N was 26.3–65.0% with a mean of 45.7% (Fig. 3a and b).The influent NO2−–N and NO3−–N concentrations were respectively 0.07–1.12 and 0.05–0.91 mg L−1; and the corresponding effluent concentrations were 1.85–4.52 and 0.60–4.21 mg L−1. These data of NO2−–N and NO3−–N were lower compared to those of NH4+–N and TN and are not shown.
The averaged increment value of the combined NO2−–N and NO3−–N concentrations was 4.49 mg L−1 (Fig. 3), including NO2−–N of 2.48 mg L−1 and NO3−–N of 2.01 mg L−1; however, the NH4+–N removal concentration reached 46.5 mg L−1 (Fig. 3). Based on the principle of raw mass conservation of elemental nitrogen, there was a TN loss of up to 50% under aerobic conditions including a small quantity of nitrogen converted into cell material of microorganisms. Most NH4+–N was converted to gaseous nitrogen except for small amounts converted to NO3−–N and NO2−–N.
3.3 Performance of nitrification and denitrification in the two flasks
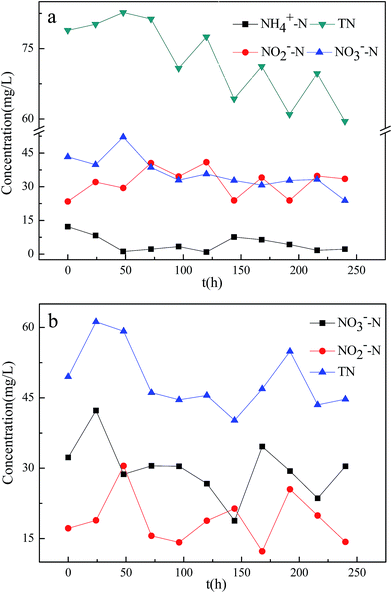
The various removal efficiencies of TN, NH4+–N, NO2−–N and NO3−–N under aerobic and anoxic conditions are shown in Fig. 4.During the experiment, NH4+–N declined significantly, and NO2−–N and NO3−–N increased after 24 h under aerobic conditions (Fig. 4a). When the initial NH4+–N was 100 mg L−1, the TN, NH4+–N, NO2−–N and NO3−–N concentrations were 61–82.7, 0.9–12.2, 23.4–40.9 and 30.7–52.1 mg L−1, respectively; and the TN and NH4+–N removal rates were 17.3–35.7 and 87.8–99.1%, respectively.
In the anoxic flask, the NO3−–N and TN simultaneously declined, although NO2−–N accumulated significantly (Fig. 4b). For an initial NO3−–N concentration of 100 mg L−1, the final TN, NO2−–N and NO3−–N concentrations were (all mg L−1) 40.2–61.2, 14.2–30.5 and 18.8–42.3, respectively. The NO3−–N and TN removal rates were 57.7–81.2 and 38.8–59.8%, respectively.
The experimental results showed that nitrification and denitrification processes occurred simultaneously in the aerobic and anoxic zones, respectively, co-existing in the reactor.
3.4 Biological diversity analysis
Bio-film samples from the different honeycomb holes were analyzed for biological diversity (Fig. 5). The biological diversity differed greatly between the different ceramic honeycombs or honeycomb-like holes, including the characteristics of zoogloea and Vorticella. The literature shows that nitrifying bacteria populations are a pale yellow color,12,13 and so those in Fig. 5a may be a nitrifying bacteria population.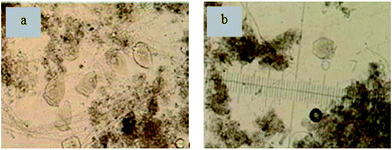 | ||
| Fig. 5 Typical biological forms on ceramic honeycombs observed by microscopy (a) and (b), and magnification times was 400. | ||
However, the population depicted in Fig. 5b may have been preceded by a denitrifying bacteria population, indicated by the dull color. The biological diversity results support a conclusion that some microorganisms of different characteristics had naturally formed in the different honeycomb-like holes, ensuring a co-existence of nitrifying and denitrifying bacteria under aerobic conditions.
4 Discussion
The efficiency of TN removal depends both on DO distribution and on the bio-film thicknesses on the bio-carriers in the bioreactor.6,13 The honeycomb-like structure of the bio-carriers was one of the most important factors for the SND processes in the bioreactor. As the bio-films developed on the ceramic honeycomb, the bio-films gradually thickened, which may have formed heterogeneous bio-films in the different zones – including the different honeycomb holes and different depths in bio-films on the honeycomb. Some zones may have had aerobic micro-environments and so were populated by aerobic nitrifying bacteria, and other zones may be anoxic and contained anaerobic denitrifying bacteria. Consequently, the different micro-environments simultaneously formed ecological regions suited for either aerobic or anoxic zones.14,15According to the biological principle of nitrogen compound removal, NH4+–N was converted to gaseous nitrogen via nitrification and denitrification – this nitrification could be relatively easy to implement in the reactor. However, the denitrification process ought to involve carbon source and anoxic zones, and the carbon source was mainly internal carbon (i.e. CODcr – that of the influent was 165.1–220.1 mg L−1 and that of the effluent was 95.1–148.1 mg L−1 during the experiment) and anoxic zones achieve denitrification through consuming the carbon source as an electron donor. In the aerobic system, due to the thickness of bio-films that developed on the different parts of the ceramic honeycomb, resulting in the different shock strength in the different holes due to the heterogeneity of the water flow and aeration. The occurrence of SND in the bioreactor was due to the following:
(1) The different levels of DO in the different honeycomb holes resulted in the creation of aerobic and anoxic zones in these different holes. In aerobic zones, aerobic nitrifying bacteria oxidized NH4+–N to NO3−–N with molecular oxygen as the electron acceptor. Nevertheless, anoxic denitrification occurred by utilizing electron donors (organic carbon source) in anoxic holes, in which NO3−–N was reduced to gaseous nitrogen by heterotrophic denitrifying bacteria.
(2) The thicker bio-films were advantageous for SND.4,16,17 The thickness of bio-films on ceramic honeycombs developed during the experiment, macroscopic views gave evidence of gradient distribution of DO level on the ceramic honeycombs, and the oxygen diffusion limitation in the bio-films created significant anoxic micro-zones, which led to denitrification processes in the internal zones of bio-films. In the outer part of the bio-films, the aerobic conditions stimulated activity of nitrifying bacteria, and the NO3−–N produced in the aerobic micro-zones diffused to the anoxic micro-zones where it was converted to gaseous nitrogen.
(3) Biological uptake of nitrogen into biological tissue was also a partial cause of nitrogen removal.
(4) Some aerobic denitrifying bacteria and anaerobic nitrifying bacteria may have led to some reduction in TN.
Overall, (1) and (2) were the main causes of TN removal through SND, with (3) and (4) secondary reasons for TN removal through non-SND processes.
5 Conclusion
A bioreactor was constructed using ceramic honeycomb as a bio-carrier, and the performance of removal of nitrogen compounds utilizing SND was investigated under aerobic conditions. Nitrification took place in bio-carrier interfaces, which were aerobic layers, whereas anoxic micro-zones existed in the deeper layers of the bio-films or anoxic honeycomb-like holes which allowed heterotrophic denitrifiers to produce gaseous nitrogen. Sufficient carbon was necessary in order to denitrify the nitrate formed during nitrification under aerobic conditions. Compared with other processes of SND, that in the present study removed TN in a bioreactor that included aerobic and anoxic zones in a continuous flow mode made possible by the use of ceramic honeycomb as a bio-carrier. This process is ideal, having lower energy consumption, high SND efficiency and ease of operation.Acknowledgements
This study was supported by Six Talent Summit of Jiangsu Province (JNHB-005), Qinglan Project of Jiangsu Province, Instrument Special Fund of Xuzhou Institute of Technology (XKY2011606), and National Spark Program of China (2013GA690421).References
- H. J. Yu and W. P. Cao, RSC Adv., 2014, 4, 48660–48665 Search PubMed.
- M. Arnaldos and K. Pagilla, Water Res., 2010, 44, 5306–5315 CrossRef CAS PubMed.
- L. B. Chu and J. L. Wang, Chem. Eng. J., 2011, 170, 220–225 CrossRef CAS PubMed.
- S. M. Hocaoglu, G. E. Insel, E. U. Cokgor and D. Orhon, Bioresour. Technol., 2011, 102, 6665–6672 CrossRef CAS PubMed.
- Y. Rahimi, A. Torabian, N. Mehrdadi and B. Shahmoradi, J. Hazard. Mater., 2011, 185, 852–857 CrossRef CAS PubMed.
- R. Abbassi, A. K. Yadav, S. Huang and P. R. Jaffé, J. Environ. Manage., 2014, 142, 53–59 CrossRef CAS PubMed.
- Y. Zhang, Z. Shi, M. X. Chen, X. Y. Dong and J. T. Zhou, Bioresour. Technol., 2014, 100, 1100–1107 Search PubMed.
- K. Szewczyk and A. Kulig, J. Biotechnol., 2007, 131S, 133–187 Search PubMed.
- W. P. Cao, H. H. Zhang, Y. M. Wang and J. Z. Pan, Ecol. Eng., 2012, 42, 146–149 CrossRef PubMed.
- Y. M. Zhang, L. Chang, N. Yan, Y. X. Tang, R. Liu and B. E. Rittmann, Environ. Sci. Technol., 2014, 48, 649–655 CrossRef CAS PubMed.
- State Environmental Protection Administration of China, Detection technologies for water and wastewater, Beijing: China Environmental Science Press., 2002, P. R. China Search PubMed.
- W. P. Cao, Y. M. Zhang and L. H. Qian, Water Treatment Technol., 2006, 32, 62–65 CAS.
- T. Y. Gao, G. W. Gu, Q. Zhou, Water pollution control engineering, Beijing: Higher Education Press., 2007, P. R. China Search PubMed.
- W. P. Cao, J. Xuzhou Inst. Technol., Nat. Sci. Ed., 2012, 27, 73–77 CAS.
- C. Y. Zhang, L. Wang, N. Yan, Y. M. Zhang and R. Liu, Bioprocess Biosyst. Eng., 2013, 36, 597–602 CrossRef CAS PubMed.
- Y. Jiang and C. Li, Chin. J. Environ. Sci., 2011, 32, 158–164 CAS.
- T. Daigger, G. Adams, D. Craig and K. Steller, Water Environ. Res., 2007, 79, 375–387 CrossRef.
| This journal is © The Royal Society of Chemistry 2015 |

