
One-step synthesis of carbon nanodots for sensitive detection of cephalexin
Kunjie Wanga,
Feng Guana,
Hongxia Li*a,
Mingliang Lia,
Huixia Fenga and
Haiyan Fan*b
aCollege of Petrochemical Technology, Lanzhou University of Technology, Lanzhou, 730050, China. E-mail: wangkj80@163.com
bChemistry Department, Nazarbayev University, Astana 010000, Kazakhstan
First published on 11th February 2015
Abstract
Blue photoluminescence water soluble carbon dots with an average size of 1.5 nm were synthesized by hydrothermal treatment of fresh potato at 200 °C for 5 h without adding any other reagents. XRD and TEM illustrated the poor crystalline nature and narrow distribution of these spherical carbon dots. The functional groups were confirmed by FTIR studies. Thus bio-based photoluminescence carbon dots were applied to the detection of cephalexin. The sensing probe exhibits many advantages, such as wide linear response range, high sensitivity and short response time with a detection limit as low as 0.311 μM.
Introduction
Cephalexin is a lactam antibiotic which is widely used to treat infections of the urinary tract, the upper respiratory tract, the skin, the middle ear and other common bacterial infections.1,2 Despite its efficiency, excessive use of cephalexin is extremely harmful to the human body, for example, it is well known that excessive use of cephalexin will cause acute renal failure in humans and experimental animals. Therefore, developing effective analytical methods for the sensitive and selective detection of trace amounts of cephalexin is especially important. Compared with many other methods, like high-performance liquid chromatography (HPLC),3 liquid chromatography (LC),4 flow injection analysis,5 electrochemical methods,6 fluorescence assays have several advantages, such as high sensitivity and fast analysis. However, to the best of our knowledge, the use of fluorescence probe for analysis of cephalexin is very rare. Lately, Li et al. proposed a fluorescence probe based on the fluorescence quenching of L-Cysteine capped core–shell CdTe/ZnS nanoparticles to detect cephalexin.7 The above photoluminescence material suffer from complex synthesis route and expensive regents. Accordingly, the development of a simple, economical, and green preparative strategy toward photoluminescence materials is meaningful.Recently, photoluminescent carbon nanodots (CDs) have attracted growing interest. Considerable research efforts have been focused on the synthesis of CDs via various methods with a number of significant breakthroughs taking place in the past years.8–13 Due to their reasonable PL, high resistance to photobleaching, high aqueous solubility, excellent biocompatibility, low toxicity and robust chemical inertness,14 they have been employed as fluorescence signal sources in biosensing applications. For example, Zhou et al. demonstrated carbon nanodots as novel and environmentally-friendly fluorescence probes for the sensing of Hg2+;15 Zong et al. reported “off-on” detection of Cu2+ and L-Cys using unmodified carbon dots as photoluminescence probes.16
Potato is rich in starch and protein, which is suitable to be precursor of CDs. Lu et al. and Xu et al. have proved it in their papers.17,18 Here, we demonstrated the use of potato as material for hydrothermal preparation of water-soluble, photoluminescence CDs. We further testified that such CDs can serve as a very effective photoluminescence probe for detection of cephalexin with a detection limit as low as 0.311 μM.
Experimental
Materials
Potato was purchased from the local supermarket. Dialysis bags with a molecular weight cut off of 1000 Da were purchased from Shanghai Green Bird Science & Technology Development Co., Ltd, China. Phosphate-buffered saline (PBS) (pH = 6.8) were purchased from Shanghai Rex Co-perfect Instrument Co., Ltd. Cephalexin (98%) were obtained from Shanghai Yuanye Biological Technology Co., Ltd. De-ionized water was prepared with a Milli-Q-Plus system (18.2 MΩ).Characterization
The morphology and dimension of the sample was revealed with a JEOL JEM-2100 transmission electron microscope (TEM) operating at 200 kV. Fluorescence spectroscopy was performed with a Shimadzu RF-5301 PC spectrophotometer equipped with a xenon lamp using right-angle geometry. UV-vis absorption spectra was recorded using a Shimadzu UV-2550 spectrophotometer. IR spectra was taken on a Nicolet AVATAR 360 FT-IR spectrophotometer. The X-ray diffraction (XRD) was investigated by a Shimadzu XRD-6000 spectrometer. X-ray photoelectron spectroscopy (XPS) spectra were generated by a PHI-5702 multifunctional X-ray photoelectron spectrometer (American). Atomic force microscopy (AFM) analysis was carried out in the non-contact mode on a Agilent 5500 AFM. All optical measurements were carried out at room temperature under ambient conditions.Preparation of CDs
In a typical process, CDs were prepared through a hydrothermal treatment of fresh potato. Cut potato into pieces. 4 g of potato was added into 30 mL of water. Then the mixture was transferred into a 50 mL Teflon-lined autoclave and heated at 200 °C in an oven for a period of 5 h. The product was centrifuged at 10![[thin space (1/6-em)]](https://www.rsc.org/images/entities/char_2009.gif) 000 rpm for 10 min to remove the large dots. Finally, the solution was dialyzed against water for two days and dried under vacuum at 60 °C until a brown powder was obtained.
000 rpm for 10 min to remove the large dots. Finally, the solution was dialyzed against water for two days and dried under vacuum at 60 °C until a brown powder was obtained.
General procedure for detection of cephalexin (Cep)
100.0 μL CDs solution (100 μg mL−1), 100.0 μL PBS buffer solution (pH = 6.8) and different concentrations of Cep were diluted with water to the total volume of 2.0 mL in a 4.0 mL centrifuge tube. Subsequently, the mixture was vortex-mixed and placed for 1 min before measurements. The photoluminescence (PL) emission spectra were recorded immediately at room temperature. All of the photoluminescence detections were made under the same conditions: the slot widths of the excitation and emission were both 10 nm, and the excitation wavelength was set at 350 nm. The fluorescence intensities were recorded in the range of 360 nm to 600 nm. Fluorescence intensity was measured at 440.0 nm.Results and discussion
Synthesis and characterization of CDs
The formation of carbon dots was confirmed from TEM micrographs as shown in Fig. 1. The TEM image (Fig. 1a) reveals that when the reaction proceed for 5 h, the nanoparticles obtained were well separated from each other and they have a narrow size distribution ranging from 1 nm to 2 nm (Fig. 1c), which is smaller than previously reported CDs.19,20 When the reaction was allowed to proceed 12 h, the CDs grew larger to about 3.2 nm. And interestingly, the CDs can be viewed as a uniform array of circular clusters (Fig. 1b). Each cluster is seen to be composed of an aggregate of a few tens of nanoparticles with much smaller diameters. This may result from the high surface energy of the CDs. The AFM image (Fig. 1g) further confirmed the uniform distribution of the CDs having an average height of about 1.5 nm (Fig. 1h). | ||
| Fig. 1 a and b) TEM micrographs of CDs obtained by different reaction time. (c) Size distribution of (a). (d) FT-IR spectrum of the obtained CDs. (e) XRD pattern. (f) UV-vis absorbance and photoluminescence emission spectra. The inset shows aqueous solution containing the as-prepared C-dots when exposed to an ultraviolet lamp unit (365 nm). (g) AFM micrograph and the height profile (h). | ||
Fig. 1d shows the FT-IR spectrum of these CDs. The peaks at about 3410 cm−1 can be ascribed to the characteristic absorption bands of the O–H. The peaks at 1630 cm−1 can be attributed to the stretching vibration of C![[double bond, length as m-dash]](https://www.rsc.org/images/entities/char_e001.gif) O. The characteristic absorption band of C–OH stretching at 1150 cm−1 is also observed, and the peak at 2928 cm−1 can be assigned to the C–H stretching mode.21
O. The characteristic absorption band of C–OH stretching at 1150 cm−1 is also observed, and the peak at 2928 cm−1 can be assigned to the C–H stretching mode.21
The corresponding X-ray diffraction (XRD) pattern, shown in Fig. 1e, displays a broad diffraction peak at 2θ = 20.02°, which is indicative of the amorphous nature and is consistent with reported ref. 22.
To evaluate the optical properties of C-dots, the UV-vis absorption spectrum and PL emission spectrum were investigated (Fig. 1f). For the UV-vis absorption spectrum of the prepared C-dots, no visible absorption peak was observed. This was consistent with the C-dots derived from commercial activated carbon.23 The PL spectrum of CDs showed a 440 nm emission peak (blue line) under the excitation of 350 nm. The full width at half maximum was about 60 nm, which was resulted from a narrow size distribution. The inset shows the bright blue photoluminescence photo of 100 μg mL−1 CDs solution illuminated by an UV beam of 365 nm.
The surface composition and elemental analysis of CDs were identified using the X−ray photoelectron spectroscopy (XPS). The XPS survey spectra (Fig. 2a) show a predominant C 1s peak at ca. 284 eV, O 1s peak at ca. 536 eV and N 1s peak at ca. 404 eV. The ratio of C:O:N was calculate to be 49.3:18.2:1.0. The high-resolution C 1s spectrum (Fig. 2b) shows three peaks at 284.8 eV, 285.9 eV and 286.1 eV, which are attributed to C–C/C–O/C–H, C–N and C–OH, respectively. While the N 1s spectrum of the CDs (Fig. 2c) reveals the presence of NH3 at 400.4 eV, N−(C)3 at 404.2 eV, and NO3 at 406.4 eV. The above observations confirm that the synthesized carbon dots function with hydroxyl, carboxylic and amino groups.
 | ||
| Fig. 2 XPS spectra of CDs (a), high resolution scan of the C 1s (b), O 1s (c) and N 1s (d). | ||
The photoluminescence variation of CDs with different pH was also investigated. As depicted in Fig. 3a, an increase of the pH from 1 to 7 led to an increase in PL intensity, and continually increasing the pH to 13 resulted in a gradual decrease in PL intensity. Such pH-dependent PL behavior is probably due to the dissociation of a great amount of ammonium ions and carboxylic acid groups on the surface of the CDs.20 To affirm the stability of CDs under high ionic strength environments, their PL intensities were measured in a solution containing different concentrations of NaCl. As shown in Fig. 3b, the PL intensity only changed slightly, which reveals that CDs are stable even under high ionic strength conditions. This finding suggests that CDs have great potential for sensing applications under physiological conditions.21
 | ||
| Fig. 3 The effect of (a) pH value and (b) the NaCl concentration on CDs fluorescence. | ||
Determination of cephalexin
Finally, to evaluate possible applications of the CDs in analytical chemistry, the CDs, which possess good fluorescence, were applied to detect cephalexin based on the fluorescence quenching process (Table 1).| Methods | Performance | Ref. | |
|---|---|---|---|
| Detection limit (10−6 M) | Linear range (10–5 M) | ||
| HPLC | — | 57.6–504 | 24 |
| Electrochemical | 0.15 | 0.06–5 | 25 |
| Synchronous fluorimetry and H-point standard additions | — | 0.72–22 | 26 |
| UV spectrophotometry | 3 | 1–18 | 27 |
| Reverse phase HPLC | — | 14.4–57.6 | 28 |
| Ninhydrin quantitative method | — | 11.5–57.6 | 29 |
| CdTe/ZnS nanoparticles | 0.83 | 0.38–10 | 7 |
| CDs | 0.311 | 0.05–0.95 | This work |
To explore the response rate of the PL signal of the CDs to the Cep, the time-dependent PL changes upon addition of 10 μmol was first monitored. As shown in Fig. 4a, the PL intensity of CDs at 440 nm was quenched as soon as the Cep was added into the solution and kept stable during the following 6 min. This result suggests that the quenching of Cep to the CDs is quite rapid, implying a promising application in fast, stable and convenient sensing.
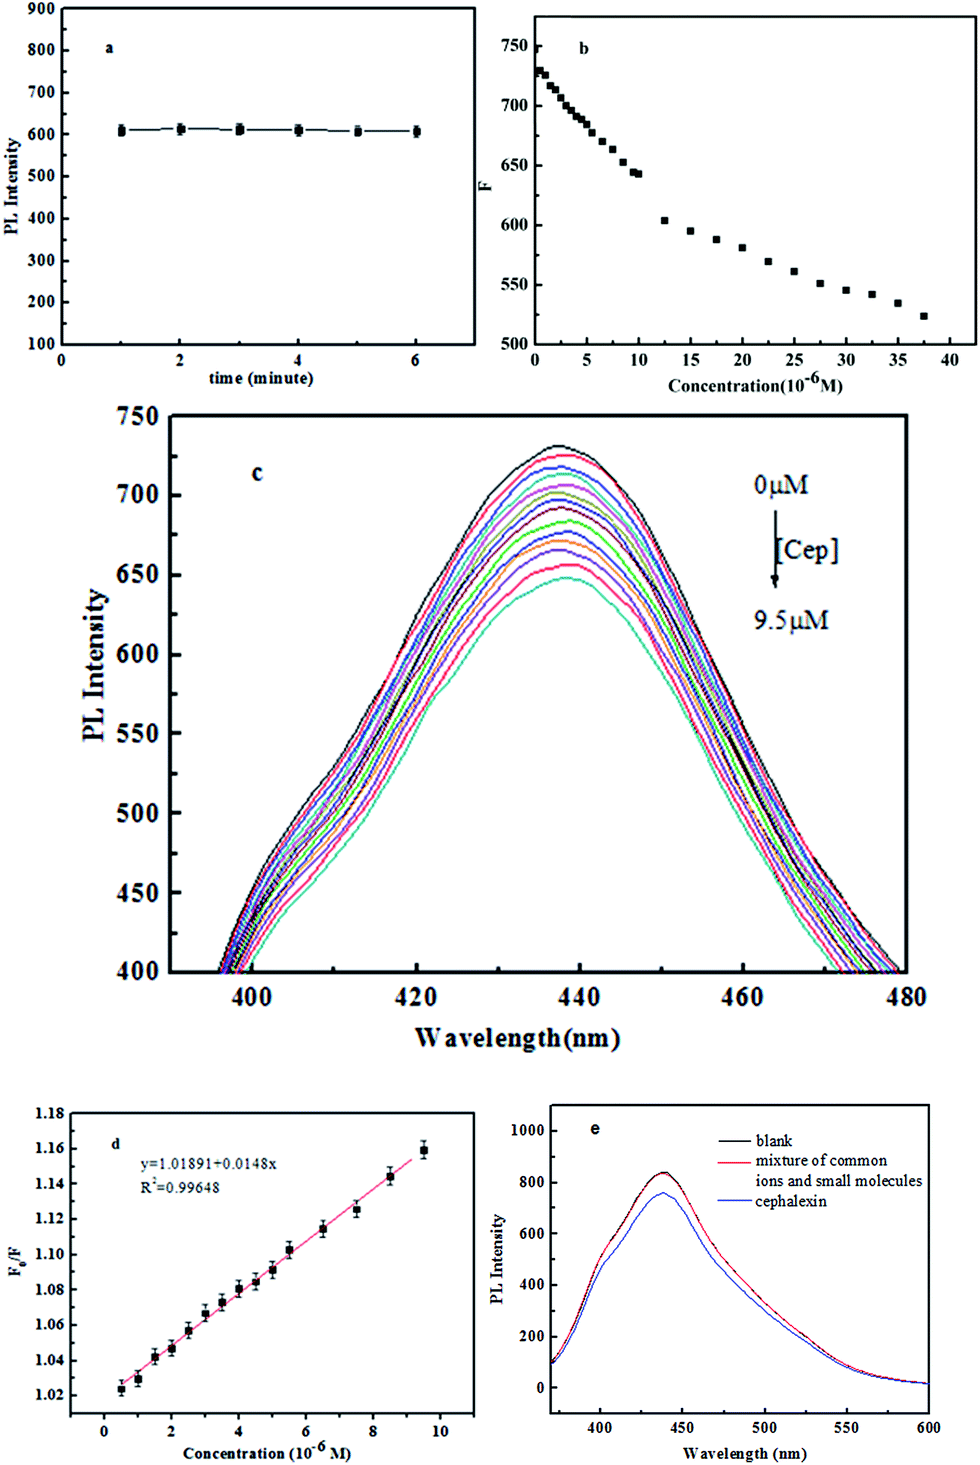 | ||
| Fig. 4 (a) Time-dependent PL response of CDs to 5 μM in pH 6.8 PBS. CDs, 10 μg mL−1 (b) plot of the value of F versus the concentrations of cephalexin. CDs, 5 μg mL−1. (c) PL spectra of CDs dispersion in the presence of different concentrations of cephalexin from 0.5 to 9.5 μM. CDs, 5 μg mL−1. (d) Sterne–Volmer plot between CDs and cephalexin. (e) The difference in PL Intensity of CDs dispersion under different conditions in PBS (pH 6.8), the mixture including kBr, Ca(NO3)2, NaF, sucrose, glucose, ascorbic acid, tryptophan, aspartic acid, L-cysteine, the concentration of each composition in the mixture was 125 μM. CDs, 6.25 μg mL−1. Cephalexin, 125 μM. | ||
Fig. 4b shows the effect of the amount of Cep on the fluorescence of the CDs. The PL intensity of CDs at 440 nm is sensitive to Cep and decreases as the concentration of Cep is increased (Fig. 4c). The relationship between the fluorescence intensity changes of CDs and the concentration of Cep is described by the Stern–Volmer equation:
| F0/F = 1 + KSVC | (1) |
The calibration curve in Fig. 4d shows a linear relationship (R2 = 0.996) of F0/F versus the concentration of Cep over the range from 0.5 to 9.5 μM. The detection limit was calculated to be 0.311 μM, which is comparable to other reported values using alternative methods.7,24–29
Herein, a hypothesis was proposed to explain the quenching mechanism according to the ref. 7 The quenching of CDs in the presence of cephalexin in lower concentrations indicates it may be due to the static quenching process. Upon excitation, the electron of CDs will jump from the valence band to the conduction band and a positively charged hole is formed in its valence band, as well as a free electron in its conduction band. Thus, a bound electron–hole pair called an exciton was formed. As a result of the combination of the hole and the electron, photoluminescence is produced. But the introduction of cephalexin, which occupies the hole sites, hindered recombination of electron–hole at the surface of CDs, consequently caused photoluminescence quenching.
Subsequently, we studied the effect of some common ions and small molecules including kBr, Ca(NO3)2, NaF, sucrose, glucose, ascorbic acid, tryptophan, aspartic acid, L-cysteine on the PL intensity of the CDs. It was found that the intensity of CDs decreased obviously with the addition of Cep, while less influenced by other small molecules and ions (Fig. 4e). Therefore, the detection of Cep showed a certain sensitivity and selectivity to some extent.
Conclusion
In summary, we synthesized CDs powders in one pot by hydrothermal treatment of potato. The CDs prepared have a narrow size distribution, excellent water solubility and good PL characters. Additionally, they can give a very sensitive response to cephalexin, which provides a broad range of usage and desirable applications in the fields of trace detection of cephalexin.Acknowledgements
This work was supported by grant no. 1310RJYA017 and 1112RJZA006 of the Natural Science Foundation of Gansu, the hongliu young teacher cultivate project of Lanzhou University of Technology (Q201211) and the Doctoral research start-funded projects of Lanzhou University of Technology.Notes and references
- Q. Fei, M. Li, B. Wang, Y. Huan, G. Feng and Y. Ren, Chemom. Intell. Lab. Syst., 2009, 97, 127 CrossRef CAS PubMed.
- Y. Huan, G. Feng, B. Wang, Y. Ren and Q. Fei, Spectrochim. Acta, Part A, 2013, 109, 308 CrossRef CAS PubMed.
- A. Pecavar, A. Šmidovnik, D. Milivojevic and M. Prošek, J. High Resolut. Chromatogr., 1997, 20, 674 CrossRef CAS.
- M. Qi, P. Wang, P. Sun and X. Liu, J. Chromatogr. B: Anal. Technol. Biomed. Life Sci., 2006, 832, 307 CrossRef CAS PubMed.
- U. J. Meyer, Z.-l. Zhi, M. Meusel, F. Spener and E. Loomans, Analyst, 1999, 124, 1605 RSC.
- A. G. Fogg and M. J. Martin, Analyst, 1981, 106, 1213 RSC.
- Q. Z. L. Li, Y. Ding, X. Cai, S. Gu and Z. Cao, Anal. Methods, 2014, 6, 2715 RSC.
- W. Kwon, S. Do and S.-W. Rhee, RSC. Adv., 2012, 2, 11223 RSC.
- X. Qin, W. Lu, A. M. Asiri, A. O. Al-Youbi and X. Sun, Catal. Sci. Technol., 2013, 3, 1027 CAS.
- L. Cao, S. T. Yang, X. Wang, P. G. Luo, J. H. Liu, S. Sahu, Y. Liu and Y. P. Sun, Theranostics, 2012, 2, 295 CrossRef CAS PubMed.
- B. Chen, F. Li, S. Li, W. Weng, H. Guo, T. Guo, X. Zhang, Y. Chen, T. Huang, X. Hong, S. You, Y. Lin, K. Zeng and S. Chen, Nanoscale, 2013, 5, 1967 RSC.
- C. Liu, P. Zhang, F. Tian, W. Li, F. Li and W. Liu, J. Mater. Chem., 2011, 21, 13163 RSC.
- R. Ye, C. Xiang, J. Lin, Z. Peng, K. Huang, Z. Yan, N. P. Cook, E. L. Samuel, C. C. Hwang, G. Ruan, G. Ceriotti, A. R. Raji, A. A. Marti and J. M. Tours, Nat. Commun., 2013, 4, 2943 Search PubMed.
- H. Shi, J. Wei, L. Qiang, X. Chen and X. Meng, J. Biomed. Nanotechnol., 2014, 10, 2677 CrossRef CAS PubMed.
- L. Zhou, Y. Lin, Z. Huang, J. Ren and X. Qu, Chem. Commun., 2012, 48, 1147 RSC.
- J. Zong, X. Yang, A. Trinchi, S. Hardin, I. Cole, Y. Zhu, C. Li, T. Muster and G. Wei, Biosens. Bioelectron., 2014, 51, 330 CrossRef CAS PubMed.
- W. Lu, X. Qin, A. M. Asiri, A. O. Al-Youbi and X. Sun, J. Nanopart. Res., 2012, 15, 1344 CrossRef.
- J. Xu, Y. Zhou, S. Liu, M. Dong and C. Huang, Anal. Methods, 2014, 6, 2086 RSC.
- B. De and N. Karak, RSC Adv., 2013, 3, 8286 RSC.
- J. Hou, J. Yan, Q. Zhao, Y. Li, H. Ding and L. Ding, Nanoscale, 2013, 5, 9558 RSC.
- W. Lu, X. Qin, S. Liu, G. Chang, Y. Zhang, Y. Luo, A. M. Asiri, A. O. Al-Youbi and X. Sun, Anal. Chem., 2012, 84, 5351 CrossRef CAS PubMed.
- C.-W. Lai, Y.-H. Hsiao, Y.-K. Peng and P.-T. Chou, J. Mater. Chem., 2012, 22, 14403 RSC.
- M. Tan, L. Zhang, R. Tang, X. Song, Y. Li, H. Wu, Y. Wang, G. Lv, W. Liu and X. Ma, Talanta, 2013, 115, 950 CrossRef CAS PubMed.
- M.-C. Hsu, Y.-S. Lin and H.-C. Chung, J. Chromatogr. A, 1995, 692, 67 CrossRef CAS.
- L. H. Y. Chen and Q. Lin, Int. J. Electrochem. Sci., 2012, 7, 7948 Search PubMed.
- C. Landes, C. Burda, M. Braun and M. A. El-Sayed, J. Phys. Chem. B, 2001, 105, 2981 CrossRef CAS.
- W. R. Algar, A. J. Tavares and U. J. Krull, Anal. Chim. Acta, 2010, 673, 1 CrossRef CAS PubMed.
- Y. Jinghe, Z. Guangjun, J. Nianqin, H. Rongjiang, L. Cunguo and H. Jingtian, Anal. Chim. Acta, 1996, 325, 195 CrossRef.
- A. S.-C. P. Campins-Falco, L. Gallo-Martinez, F. Bosch-Reig and I. Monzr-Mansanet, Mikrochim. Acta, 1997, 126, 207 CrossRef.
| This journal is © The Royal Society of Chemistry 2015 |