Oxidation of SO2 and NO by epoxy groups on graphene oxides: the role of the hydroxyl group

Wanglai Cenab, Meiling Houa, Jie Liuc, Shandong Yuand, Yongjun Liuab and Yinghao Chu*ab
aCollege of Architecture and Environment, Sichuan University, Chengdu 610065, P.R. China. E-mail: chuyinghao@scu.edu.cn
bNational Engineering Research Center for Flue Gas Desulfurization, Chengdu 610065, P.R. China
cDepartment of Environment Engineering, Chengdu University of Information Technology, Chengdu 610025, P.R. China
dInstitute of New Energy and Low Carbon Technology, Sichuan University, Chengdu 610065, P.R. China

Received 25th November 2014 , Accepted 23rd February 2015

First published on 24th February 2015


Abstract

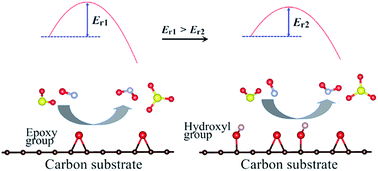
Simultaneous catalytic removal of SO2 and NOx at low temperature (<150 °C) has long been recognized as a challenge for the treatment of coal-burned flue gases. Density functional theory corrected with dispersion was used to investigate the potential of graphene oxides (GOs) for the catalytic oxidation of SO2 and NOx. It is found that both the SO2 and NOx can be oxidized by epoxy groups of GO nearly at room temperature. The hydroxyl groups on the GO surface enhance the adsorption and oxidation of SO2, and of NO as well, but in quite different ways. For the case of SO2, the promotion is derived from the formation of charge transfer channels, which are fabricated by the hydroxyl group, the adsorbed SO2 and the epoxy group. The promotion is enhanced by the introduction of more hydroxyl groups as more charge transfer channels are formed. However, for NO, the hydroxyl group leads to a strong N–C covalent interaction between the adsorbed NO molecules and the GO surface, through which the NO is activated and oxidized with a much lower barrier. These results provide a mechanistic explanation of the low temperature catalytic oxidation of SO2 and NO by carbon materials and insights into designing new carbon-based catalysts.


1. Introduction

Simultaneous catalytic removal of sulfur dioxide (SO2) and nitric oxide (NO) from the flue gases emitted by burnt fossil fuels is still a challenge, both in scientific research and industrial applications.1–3 Recently, it was found that SO2 can be catalytically oxidized by graphene oxides (GOs) to SO3 experimentally at room temperature.4 It motivated our theoretical investigations on the mechanism of highly efficient catalytic oxidation of SO2 by GOs, and the potential application in the catalytic removal of NO.

Actually, carbon materials, for example, granular activated carbon or activated carbon fibers, have long been studied for the catalytic removal of SO2 at low temperature (20–150 °C).5–8 In the reaction, SO2 is oxidized to form SO3, which in turn is hydrated to sulfuric acid in the presence of water. The oxidation of SO2 to SO3 is supposed to be the rate-determining step9 and can be improved by introduction of surface oxygen groups (C–O complexes).17–19 Due to the complex geometric and chemical structures of actual carbon catalysts, the dependence of the adsorption and oxidation of SO2 on surface C–O complexes is still an open question.

According to Long et al.,4 the hydroxyl and epoxy groups on a GO surface are responsible for the efficient catalytic oxidation of SO2 by GOs at room temperature. It spotlights the confusing desulfurization mechanism of carbon materials at the atomic level. Based on ab initio calculations, Yang and Yang9 proposed that catalytic oxidation of SO2 occurs on the edge of the microstructure of carbon materials. The initial step is the adsorption and oxidation of SO2 by surface oxygen species. The hydroxyl group was also indentified to play a key role in the chemical reaction catalyzed by GO.10 These results indicate that both epoxy and hydroxyl groups might have important effects on the adsorption and catalytic oxidation of SO2.

The catalytic removal of NO by carbon materials at room temperature has also been reported, dating back to more than two decades.11–16 In the reaction, NO is catalytically oxidized to NO2, which is further converted to HNO3 in the presence of water. However, understanding of the catalytic mechanism is much less than that for SO2. Practical applications are limited so far by the unsatisfactory state of knowledge. Very recently, Tang and Cao17 reported that the hydroxyl group enhances the adsorption of NO on the GO surface. Details for the oxidation of NO were not included.

In a typical catalytic oxidation loop, the active oxygen species on the surface of catalysts are consumed, and must be regenerated dynamically. Radovic and coauthors18,19 found that surface oxygen species can be formed by O atom spill over after O2 dissociation on the edge sites of graphene. It could be enhanced by N-doping20–22 and As decoration.23 Our previous theoretical work24 investigated the adsorption of SO2 on different GOs, and the feasibility for oxidation. In the present study, we focus on two points: (1) the mechanism and capacity for the promotion of the hydroxyl group to the oxidation of SO2 by carbon materials; (2) whether the promotion could be spread to the oxidation of NO. The oxidation of CO is investigated as well for comparison. Single atomic layer graphene functionalized with combinations of hydroxyl and epoxy groups is used as the model carbon material.

2. Models and methods

2.1 Computational models

Single atomic layer graphene with a rectangular boundary (12.78 × 14.76 Å, denoted as GP) was used as the substrate material, as depicted in Fig. 1. A vacuum region of 20 Å was added perpendicular to the graphene plane to minimize the interaction between the two nearby layers.17 Single O atom was added at a bridge site to form an epoxy group, denoted by OGP, as shown in Fig. 1a. A hydroxyl group (OH) was added to OGP to fabricate HO_OGP1 (Fig. 1b) or HO_OGP2 (Fig. 1c). The two different bridge sites of the epoxy group, referring the OH were used due to the different sizes of SO2, NO and CO molecules. The optimized adsorption configuration of SO2 on the OGP surface was denoted by SO2/OGP. Other adsorption configurations were denoted along the same lines.
image file: c4ra15179h-f1.tif
Fig. 1 Relaxed geometric structures of (a) OGP, (b) HO_OGP1 and (c) HO_OGP2. The brown, red and gray balls stand for carbon, oxygen and hydrogen atoms, respectively. Three carbon atoms are labeled as A, B and C. The O atom of the epoxy is located at the bridge site A–B for HO_OGP1 and the bridge site B–C for HO_OGP2. All lengths in the insets of (a) and (b) are given in Å.

2.2 Computational methods

All the density functional theory (DFT) calculations were carried out with the code VASP5.2,25,26 using the generalized gradient approximation with a Perdew–Burke–Ernzerhof (PBE) exchange and correlation functional.27 A plane-wave basis set with cut-off energy 400 eV was employed within the framework of the projector augmented-wave (PAW) method.28,29 The Brillouin zone was sampled with a 3 × 3 × 1 k-points mesh, generated by the Monkhorst–Pack algorithm. Gaussian smearing was used, with a smearing width 0.2 eV. The D2 method of Grimme30 was used to describe the van der Waals (vdW) correction with the default parameters. Actually, the D2 method only depicts the dispersion part of the vdW force empirically. There exist more complex non-local vdW functionals,31 however, it is not clear how to make a choice.32 We therefore tested at least the optB88-vdW functional, which was found to be in excellent agreement with experimental data for organic molecules adsorption on graphene.33 We showed (Table S1) that the adsorption energies from optB88-vdW are albeit systematically lower than that from PBE-D2, however, the variation trend was unchanged. We therefore used PBE-D2 in our work.

The atoms on the boundary were frozen in all directions. All the remaining atoms were relaxed until the maximum Hellman–Feynman force was less than 0.02 eV Å−1. Spin polarization and the zero-point energy correction were not included. All the above parameters were sufficient to ensure that the total energy converged to within 1 meV per atom. Further details for the validation tests can be found elsewhere.24

The adsorption energy ΔEads is defined as

ΔEads = Etot − (Emol + Esheet)
where the Etot, Emol and Esheet are the total energies of the adsorption complex, the isolated molecules and the GP/GO sheets, respectively.

The minimum energy pathway (MEP) from an initial state (IS) to its final state (FS) was determined by the nudged elastic band (NEB) method,34,35 with 8–12 replicas interpolated. The transition state (TS) was localized using the climbing image method and verified with single imaginary frequency. The convergence criterion was 0.02 eV Å−1. It was estimated that the zero-point energy correction leads to a barrier decrease by 0.02 eV for the oxidation of SO2 and 0.03 eV for NO. Spin polarization leads to barrier difference lower than 0.01 eV (see Table S1 and S2 in the ESI). Therefore, it is acceptable for the ignorance of both of them.

3. Results

3.1 Oxidation of SO2 to SO3

3.1.1 Adsorption and oxidation on HO_OGP. The MEP for the oxidation process SO2/OGP → SO3/GP is demonstrated as Fig. 2a. On SO2 approaching the epoxy (from IS1 to TS1), the bond length of SO2 is elongated from 1.45 to 1.46 Å, and is then converted to SO3 with three equivalent bond lengths of 1.44 Å. Meanwhile, the oxygen atom of the epoxy group itself is drawn out of the GP surface from the two-foot bridge site to the single-foot top site. One O–C bond of the epoxy group is elongated by 0.33 Å and the other almost unchanged. The barrier and total energy release for the oxidation are 0.21 and 1.89 eV, respectively.
image file: c4ra15179h-f2.tif
Fig. 2 Minimum energy pathways (MEPs) for the oxidation of SO2 by the epoxy group on (a) OGP, (b) HO_OGP1 and (c) HO_OGP2. The IS, TS and FS stand for initial, transitional and final states of the three reactions, respectively. The yellow ball represents the S atom. Ea is the activation energy, Er is the reaction energy, defined as Ea/r = ETS/FSEIS. Insets are included in (c) to show the geometry of the epoxy group. All the lengths are given in Å.

Fig. 2b shows MEP for the oxidation of SO2 on HO_OGP1 (see the topviews in Fig. S1a in the ESI). In the initial state IS2, the distance of the hydrogen bond H⋯O is 1.91 Å. The S–O distance is pulled much closer, from 2.69 in IS1 to 2.52 Å. In the TS2, the hydrogen bond is shortened to 1.82 Å, while the on-breaking O–C bond of the epoxy group is elongated by 0.28 Å. The oxidation barrier is reduced to 0.12 eV, compared to 0.21 eV for the oxidation of SO2 on OGP. Consequently, it can be assumed that the introduction of the hydroxyl group plays two roles: enhancing the adsorption of SO2 (see Table 1) and reducing the oxidation barrier. Nevertheless, based on further investigation as below, it does not tell the entire story.

Table 1 Summary of adsorption energy, charge transfer and imaginary frequency validation for the adsorption and oxidation of SO2, NO and CO on different GO surfaces
Reactions ΔEads, eV Δqa, e f/i, cm−1
IS IS TS TS
a The charge transfer Δq = Bader population – valence electrons, as a whole for an adsorbed molecule.
SO2/OGP → SO3/GP −0.30 0.050 0.131 306
SO2/HO_OGP1 → SO3/HO_GP −0.40 0.060 0.141 194
SO2/HO_OGP2 → SO3/HO_GP −0.45 0.079 0.144 163
SO2/2HO_OGP → SO3/2HO_GP −0.58 0.094 0.152 296
NO/OGP → NO2/GP −0.10 −0.051 −0.095 434
NO/HO_OGP1 → NO2/HO_GP −0.54 0.005 −0.005 343
NO/HO_OGP2 → NO2/HO_GP −0.25 −0.035 −0.086 301
CO/OGP → CO2/GP −0.09 0.003 0.004 450
CO/HO_OGP1 → CO2/HO_GP −0.14 0.002 0.012 461
CO/HO_OGP2 → CO2/HO_GP −0.15 0.007 0.005 471


Several other configurations of HO_OGP have been investigated and a more energetically favorable MEP for the oxidation of SO2 is depicted in Fig. 2c (see the topviews in Fig. S1b in the ESI). The adsorption of SO2 on HO_GP2 is slightly preferable to HO_GP1 (see Table 1) and the oxidation barrier is reduced to 0.08 eV. However, compared to the configuration IS2, both distances of H⋯O (1.99 Å) and S–O (2.61 Å) are slightly longer, but non-negligible. In the TS3, the distance of H⋯O is 1.98 Å, almost unchanged. The S–O is reduced to 2.32 Å. Both of them are much longer than their counterparts in TS2. These differences indicate that the H-bonding interaction is not the only factor that enhances the adsorption and promotes the oxidation of SO2 on the GO surface.

3.1.2 Adsorption and oxidation on 2HO_OGP. To further investigate the potential for the enhancement of the hydroxyl group on the oxidation of SO2 on GO, a second hydroxyl group was added to HO_OGP to fabricate the 2HO_OGP configuration. The top and side views for the adsorption and oxidation of SO2 on 2HO_OGP are shown in Fig. 3. As expected, the adsorption energy of SO2/2HO_OGP is increased to −0.58 eV. The oxidation barrier is further reduced to 0.06 eV. Two hydrogen bonds are formed between each of the two hydroxyl groups and the two oxygen atom of the adsorbed SO2 molecule. In the movie of the oxidation process, the two hydroxyl groups rotate according to the movement of SO2, and keep pointing to each of the two oxygen atoms of the SO2 molecule. The two bond lengths of the epoxy group in the IS configuration are 1.50–1.51 Å, which are the longest among those of SO2/OGP and SO2/HO_OGP. Meanwhile, the on-breaking O–C bond in TS is extended from 1.51 to 1.74 Å, by the lowest extent 0.23 Å.
image file: c4ra15179h-f3.tif
Fig. 3 MEP for the oxidation of SO2 by epoxy on 2HO_OGP. IS: SO2/2HO_OGP; FS: SO3/2HO_GP.
3.1.3 Charge transfer for adsorption and oxidation of SO2. The promotion of the hydroxyl group to the adsorption and oxidation of SO2 on GO surface has been ascribed to the strong hydrogen bonding interaction, which results in pre-activation of the epoxy group in the initial adsorption configuration.24 Herein, both the charge transfer of the IS and TS configurations are of concern in order to give a more clear picture of the promotion mechanism.

Fig. 4a shows the charge transfer pattern for the adsorption and oxidation of SO2 on OGP. The IS in Fig. 4a shows electrons are transferred in a back-donation way: (1) electrons are transferred to the epoxy group, through the Coulomb interaction between the positive S(IV) atom and the negative O(−II); and (2) electrons are transferred to the adsorbed SO2 molecule through the π–π stacking interaction between the main graphene surface and the π43 of SO2. During the oxidation, more electrons are transferred to the adsorbed SO2, and then to the epoxy, as both the blue and yellow areas increase, as shown in the TS. According to Bader population analysis (Table 1), in the IS configuration, the net charge transferred to the adsorbed SO2 is 0.050 e. It is increased to 0.131 e in the TS configuration. The yellow area present at one of the O–C bonds of the epoxy group demonstrates the breaking.


image file: c4ra15179h-f4.tif
Fig. 4 Charge differences for the initial state (IS) and transition state (TS) of SO2 oxidation on (a) OGP, (b) HO_OGP1 and (c) 2HO_OGP. All the isosurfaces are 0.02 e Å−3. The blue (yellow) area denotes electron accumulation (depletion).

The charge difference plots of SO2/HO_OGP1 and SO2/2HO_OGP are shown in Fig. 4b and c, respectively. As the pattern of SO2/HO_OGP2 is quite similar to SO2/HO_OGP1, only the latter is presented here. The strong H-bonding interaction is confirmed in that there are considerable electron accumulated (blue) and depleted (yellow) areas on all the H⋯O bonds in pairs. For SO2/HO_OGP1, the net electron transfer to SO2 is 0.060 e in IS2 and 0.141 e in TS2. For SO2/2HO_OGP, the two values are increased to 0.094 e and 0.152 e respectively. More electrons are transferred from the two hydroxyl groups to the adsorbed SO2 molecule in a dual-channel manner. In summary, as listed in Table 1, for the adsorption and oxidation of SO2 on the four different GO surfaces, both the net charge transfers in the IS and TS configurations are increased with increase of SO2 adsorption energies. The oxidation barriers decrease monotonically in the same order.

In Section 3.1.1, it has been mentioned that the hydrogen bond interaction for the adsorption and oxidation of SO2 on HO_OGP2 should be weaker than that on HO_OGP1. However, both the adsorption energy and net charge transfers of the former are higher than those of the latter, and with a lower oxidation barrier. It is due to the stronger π–π stacking interaction between the main graphene surface and the π43 of SO2, since the topviews in Fig. S1b for SO2/HO_OGP2 show the S–O bonds of the adsorbed SO2 molecule are clearly parallel to the C–C bonds of the main GP surface.

Consequently, the promotion of hydroxyl groups to the adsorption and oxidation of SO2 on GO surface can be ascribed to the unique charge transfer channels, through which electrons are transferred from the hydroxyl group to the adsorbed SO2, and in turn to the epoxy group. Through the charge transfer channel, the epoxy group is not only pre-activated for further oxidation, but also is well charged by SO2 when climbing to the transitional state, which helps to reduce the oxidation barrier intrinsically.

3.2 Oxidation of NO to NO2

3.2.1 Adsorption and oxidation on OGP. The configuration for the adsorption of NO on OGP is shown as IS1 in Fig. 5a. It is a typical weak physisorption since the adsorption energy is as low as −0.10 eV (Table 1), much lower than the value of −0.30 eV for SO2/OGP. Additionally, the bond length of the adsorbed NO molecule remains the same as the calculated value of free NO, 1.17 Å. As shown in Fig. 6a, electrons are transferred from NO to the OGP surface (0.051 e). The charge transfer direction is opposite to that of SO2. It has been explained17,36 that the highest occupied molecule orbital (HOMO) of NO is higher than the Fermi level of OGP.
image file: c4ra15179h-f5.tif
Fig. 5 MEP for the oxidation of NO by the epoxy group on HO_OGP1 and HO_OGP2. Insets are included for HO_OGP2 to show the local geometry of the epoxy group in IS2 and TS2. IS1: NO/HO_OGP1; IS2: NO/HO_OGP2; FS: NO2/HO_GP.

image file: c4ra15179h-f6.tif
Fig. 6 Charge difference plots for (a) NO/OGP, (b) NO/HO_OGP1, (c) NO/HO_OGP2 and (d) NOd/HO_OGP2. The NOd/HO_OGP2 is an alternative adsorbed configuration of NO on HO_OGP2, where the O atom is more close to the substrate than the N atom. The isosurface for (b) is 0.03 e Å−3, for others is 0.01 e Å−3. Refer the configuration (d) and the oxidation related to Fig. S3 in the ESI.

For the oxidation process NO/OGP → NO2/GP (Fig. 5a), the N–O bond of NO in TS1 is slightly shortened to 1.16 Å (it is 1.17 Å in IS1), rather than elongated to some extent. The number of electrons donated by NO is increased to 0.095 e. It is noteworthy that the oxidation barrier is 0.11 eV, which is about half of that for SO2 on OGP. Such a low barrier indicates that NO can be oxidized by the epoxy group on OGP almost at room temperature. However, the prerequisite adsorption of NO on OGP is too weak to form an effective oxidation chain. It should be enhanced in some way.

3.2.2 Adsorption and oxidation on HO_OGP. The adsorption configurations NO/HO_OGP1 and NO/HO_OGP2 are shown as IS2 and IS3 in Fig. 5b and c, respectively. Compared to the adsorbed configuration in NO/OGP, herein the NO is upside down, where the N atom is much closer to the GP surface than the O atom. In both situations, the adsorption of NO is well enhanced as the adsorption energy for NO/HO_OGP1 is −0.54 eV and that for NO/HO_OGP2 is −0.25 eV, compared to −0.11 eV for NO/OGP, likely due to the strong chemisorption for the adsorption of NO on HO_OGP.

The charge difference plots in Fig. 6 help to explain the obvious difference in adsorption energy among NO/OGP, NO/HO_OGP1 and NO/HO_OGP2. As shown in Fig. 6b for NO/HO_OGP1, there is a strong charge transfer from a C atom in the HO_OGP surface to the N atom of the adsorbed NO molecule. It results in a net charge transfer to the adsorbed NO molecule by 0.005 e, as listed in Table 1. A similar (but slightly weaker) electron transfer from the C atom to the N atom is shown in Fig. 6c for NO/HO_OGP2, in which the donated electrons of the adsorbed NO are reduced from 0.051 e to 0.035 e. The strong covalent interaction between the adsorbed NO molecule and the HO_OGP surface makes it clear that NO is chemisorbed. Furthermore, there is weak hydrogen bonding interaction between the hydroxyl group and the adsorbed NO. The electron accumulation area around the O atom of NO is weakly polarized and is pointed towards the H atom of hydroxyl group.

The oxidation barrier for NO on HO_OGP1 is 0.11 eV, equivalent to that for NO/OGP → NO2/GP. However, for the oxidation of NO on HO_OGP2, the oxidation barrier is reduced to 0.06 eV, even lower than that for SO2/HO_OGP2 (0.08 eV). When NO is adsorbed in the O down way (denoted as NOd/HO_OGP2 in Fig. 6d), the oxidation barrier is increased to 0.13 eV (see Fig. S3 in the ESI). It implies that the N–C covalent interaction helps to activate the NO molecule, and reduce the oxidation barrier.

It is now known that the oxidation barrier for the oxidation of NO by the epoxy group on GO is rather low. The introduction of the hydroxyl group can enhance the adsorption of NO, which in turn facilitates the oxidation of NO by the epoxy groups of the GOs. It can also reduce the oxidation barrier, which depends on the relative locations of the epoxy groups to the hydroxyl groups.

3.3 Oxidation of CO to CO2

3.3.1 Adsorption and oxidation on OGP. There is also a weak physisorption for CO on OGP in the IS1 configuration as shown in Fig. 7a. The adsorption energy is −0.09 eV and the charge transfer is 0.003 e to the adsorbed CO molecule (see Table 1). The bond length of the adsorbed CO molecule is 1.14 Å, remaining the same as that of a free CO molecule. The distance from the C atom of CO to the O atom of the epoxy group on the OGP surface is 2.95 Å, much longer than the value 2.81 Å for NO/OGP and 2.69 Å for SO2/OGP.
image file: c4ra15179h-f7.tif
Fig. 7 MEP for the oxidation of CO by the epoxy group on HO_OGP1 and HO_OGP2. Insets are included for HO_OGP2 to show the local geometry of the epoxy group in IS2 and TS2. IS1: CO/HO_OGP1; IS2: CO/HO_OGP2; FS: CO2/HO_GP.

On CO approaching the epoxy group for the oxidation process CO/OGP → CO2/GP (see Fig. 7a), the bond length of CO is elongated from 1.14 to 1.16 Å, and then converted to CO2 with two equivalent bond lengths of 1.18 Å. Meanwhile, the epoxy group itself is drawn out of the GP surface with the longest extended O–C bond length 1.91 Å, compared to 1.81 Å for SO2/OGP and 1.66 Å for NO/OGP. The O–C distance is shorted from 2.95 to 1.87 Å. The calculated barrier for the oxidation is 0.61 eV (see Table 1), followed by an intensive energy release of 4.18 eV to form the final state CO2/GP.

3.3.2 Adsorption and oxidation on HO_OGP. The adsorption configurations CO/HO_OGP1 and CO/HO_OGP2 are shown as IS2 and IS3 in Fig. 7b and c, respectively. Insets are included for CO/HO_OGP2 to show the local geometries of the surface epoxy group. The introduction of the hydroxyl group seems to make little change to the weak physical adsorption process as the bond length of the adsorbed CO molecule remains 1.14 Å in both situations. The distances from the C atom of CO to the O atom of the epoxy group on the HO_OGP1 and HO_OGP2 surface are elongated slightly by ca. 0.1 Å (3.03 and 3.04 Å vs. 2.95 Å). The adsorption energy and charge transfer for CO/HO_OGP1 are −0.14 eV and 0.002 e, respectively; and for CO/HO_OGP2 are −0.15 eV and 0.007 e, respectively, as listed in Table 1. The two situations are similar, both energy-wise and geometrically.

The oxidation barrier for CO on HO_OGP1 is 0.60 eV, equivalent to 0.61 eV for CO/OGP → CO2/GP. It is 0.74 eV for CO oxidation on HO_OGP2. The on-breaking O–C bond of the epoxy group is extended from 1.46 Å in IS2 to 1.89 Å in TS3, and from 1.47 Å in IS3 to 1.95 Å in TS3. It seems that the oxidation barrier for CO on GOs depends on the extension of the epoxy group during the oxidation. When the oxidation barrier for CO oxidation is increased to the order 0.60 eV (HO_OGP1) < 0.61 eV (OGP) < 0.74 eV (HO_OGP2), the on-breaking O–C bond of the epoxy group is elongated by 0.43 Å (HO_OGP1) < 0.45 Å (OGP) < 0.48 Å (HO_OGP2). It implies that the activation of the surface epoxy is the key step for a surface oxidation process on GOs and the introduction of the hydroxyl group does not promote the oxidation of CO.

4. Discussion

It has been found that the oxidation of SO2 and NO by epoxy groups on GO surfaces is kinetically preferable, and both the oxidation of SO2 and NO can be promoted by the introduction of the hydroxyl group, which is not the case for CO. Herein, we focus on three points to make generalizations of our findings: (1) why the capacities for the oxidation of SO2, NO and CO by epoxy groups on GO surface are different? (2) The relationship between the oxidation barrier and the activation of the epoxy group; and (3) the feasibility for the simultaneously catalytic removal of SO2 and NO with well-prepared GOs.

As shown in Fig. 8, during the oxidation from the IS to the TS configuration, the electronic structures of the epoxy group and the adsorbed molecules are changed. The variation of the oxidation barrier can be ascribed to the difference in the energy gap of the adsorbed molecules,37 intrinsically, since electrons are activated from the highest occupied molecular orbit (HUMO) to the lowest unoccupied molecular orbit (LUMO) and then transferred to the epoxy group. The energy gap for SO2/OGP is 3.14 eV (Fig. 8a), and is a much narrower than the gap 6.84 eV for CO/OGP is (Fig. 8c). Accordingly, the barrier is increased from 0.21 to 0.61 eV.


image file: c4ra15179h-f8.tif
Fig. 8 Density of states (DOS) analysis for the adsorption and oxidation of (a) SO2, (b) NO and (c) CO on OGP surfaces. PDOS1 and PDOS2 stand for the projected density of states (PDOS) of the epoxy group and the adsorbed molecule, respectively.

For the oxidation of NO on OGP (Fig. 8b), there are partially occupied states just located at the Fermi level for both the IS (marked as A and see Fig. S4 in the ESI) and TS (marked as B) configuration of the adsorbed NO molecule. The intensity of state A is somewhat lower than that of B. Meanwhile, a new empty state is presents on the right of the latter. Other states at much lower energy levels are almost unchanged. These results indicate that the state at the Fermi level itself acts as an electron donor and acceptor, which results in a lowest oxidation barrier of 0.11 eV.

In Section 3.1, it is shown that the barrier for SO2 oxidation on the four different GO surfaces is positively correlated to the extension of the on-breaking O–C bond of the epoxy group. The same trend is also found for the oxidation of CO (see Section 3.3). All the barriers and the corresponding extensions of the O–C bond are collected and dotted as shown in Fig. 9. It can be seen that, except for the two oxidations of NO on OGP (marked as A) and HO_OGP2 (marked as B), all the other points are uniformly dispersed around the trend line. It implies that more attention should be paid to the activation of the epoxy group on the GO surface for any potential application in catalytic oxidation.


image file: c4ra15179h-f9.tif
Fig. 9 Dependence of the oxidation barrier for SO2, NO and CO on the extension of the on-breaking O–C bond of the epoxy group. IS and TS represent the initial state and final state in an elementary oxidation process. The extension is shown in the inset.

In most cases, humidity is inevitable as a disturbing influence on the catalytic oxidation of SO2 and NO from flue gases.38–41 The calculated adsorption energy of a single H2O molecule on HO_OGP1, HO_OGP2 and 2HO_OGP are −0.54, −0.55 and −0.73 eV, respectively. Each is thermodynamically preferable to the corresponding values for SO2. The highest adsorption energy of NO (on HO_OGP1) is −0.54 eV, equivalent to the adsorption energy of H2O on HO_OGP1 and HO_OGP2. Nevertheless, the concentration of NO in the gaseous phase is of the order 0.1 vol%, compared to 1 vol% for water. The adsorption of H2O is still more preferable to NO. However, many experimental studies have confirmed that humidity can promote the catalytic oxidation of SO2,42,43 while strongly inhibiting the catalytic oxidation of NO.12 The opposite effects are likely due to the solubility difference of SO2 and NO in water. Therefore, it seems unfeasible to have simultaneous removal of SO2 and NO by catalytic oxidation on GOs, in the presence of water.

5. Conclusions

Density functional theory corrected with dispersion was used to investigate the mechanism for the oxidation of SO2 and NOx on graphene oxides. It was found that both SO2 and NOx could be oxidized by GO at near room temperature. Epoxy groups should be the active sites where SO2 and NO molecules are oxidized. It is of more importance that hydroxyl groups can help to enhance the adsorption of the two species, and facilitate their oxidation by reducing the activation barrier. The promotion of the hydroxyl group for SO2 is derived from the formation of charge transfer channels, which are fabricated by the hydroxyl group, the adsorbed SO2 and the epoxy group. It can be enhanced by introduction of more hydroxyl groups as more charge transfer channels will be formed. However, for NO, the promotion is due to the strong N–C covalent interaction between the adsorbed NO molecule and the GO surface, through which the NO is activated and oxidized with much lower resistance. Further exploration is needed to determine the effects of humidity on the adsorption and oxidation of SO2 and NO.

Acknowledgements

This work was financially supported by the National Nature Science Youth Fund of China (5110828) and the Department of Science and Technology of Sichuan Province in China (2011HH0009). We also acknowledge the National Supercomputer Center in Shenzhen City of China for computational service support.

References

  1. X. L. Long, Z. L. Xin, H. X. Wang, W. D. Xiao and W. K. Yuan, Simultaneous Removal of NO and SO2 with Hexamminecobalt(II) Solution Coupled with the Hexamminecobalt(II) Regeneration Catalyzed by Activated Carbon, Appl. Catal., B, 2004, 54, 25–32 CrossRef CAS PubMed.
  2. Z. Zeng, P. Lu, C. Li, L. Mai, Z. Li and Y. Zhang, Removal of NO by Carbonaceous Materials at Room Temperature: A Review, Catal. Sci. Technol., 2012, 2, 2188–2199 CAS.
  3. I. Mochida, Y. Korai, M. Shirahama, S. Kawano, T. Hada, Y. Seo, M. Yoshikawa and A. Yasutake, Removal of SOx and NOx over Activated Carbon Fibers, Carbon, 2000, 38, 227–239 CrossRef CAS.
  4. Y. Long, C. Zhang, X. Wang, J. Gao, W. Wang and Y. Liu, Oxidation of SO2 to SO3 Catalyzed by Graphene Oxide Foams, J. Mater. Chem., 2011, 21, 13934 RSC.
  5. J. K. Lee, D. J. Juh, D. Park and S. Park, Sulfur-Dioxide Adsorption over Activated Lignite Char Prepared from Fluidized-Bed Pyrolysis, Chem. Eng. Sci., 1994, 49, 4483–4489 CrossRef CAS.
  6. J. K. Lee, S. Ferrero, R. R. Hudgins and P. L. Silveston, Catalytic SO2 Oxidation in a Periodically Operated Trickle-Bed Reactor, Can. J. Chem. Eng., 1996, 74, 706–712 CrossRef CAS.
  7. A. A. Lizzio and J. A. DeBarr, Mechanism of SO2 Removal by Carbon, Energy Fuels, 1997, 11, 284–291 CrossRef CAS.
  8. Y. X. Li, Z. M. Cheng, L. H. Liu and W. K. Yuan, Catalytic Oxidation of Dilute SO2 over Activated Carbon Coupled with Partial Liquid Phase Vaporization, Chem. Eng. Sci., 1999, 54, 1571–1576 CrossRef CAS.
  9. F. H. Yang and R. T. Yang, Ab Initio Molecular Orbital Study of the Mechanism of SO2 Oxidation Catalyzed by Carbon, Carbon, 2003, 41, 2149–2158 CrossRef CAS.
  10. L. M. Liu, R. Car, A. Selloni, D. M. Dabbs, I. A. Aksay and R. A. Yetter, Enhanced Thermal Decomposition of Nitromethane on Functionalized Graphene Sheets: Ab Initio Molecular Dynamics Simulations, J. Am. Chem. Soc., 2012, 134, 19011–19016 CrossRef CAS PubMed.
  11. S. Adapa, V. Gaur and N. Verma, Catalytic Oxidation of NO by Activated Carbon Fiber (ACF), Chem. Eng. J., 2006, 116, 25–37 CrossRef CAS PubMed.
  12. Z. Guo, Y. Xie, I. Hong and J. Kim, Catalytic Oxidation of NO to NO2 on Activated Carbon, Energy Convers. Manage., 2001, 42, 2005–2018 CrossRef CAS.
  13. I. Mochida, Y. Kawabuchi, S. Kawano, Y. Matsumura and M. Yoshikawa, High Catalytic Activity of Pitch Based Activated Carbon Fibres of Moderate Surface Area for Oxidation of NO to NO2 at Room Temperature, Fuel, 1997, 76, 543–548 CrossRef CAS.
  14. P. Talukdar, B. Bhaduri and N. Verma, Catalytic Oxidation of NO over CNF/ACF-Supported CeO2 and Cu Nanoparticles at Room Temperature, Ind. Eng. Chem. Res., 2014, 53, 12537–12547 CrossRef CAS.
  15. M.-X. Wang, Z.-H. Huang, K. Shen, F. Kang and K. Liang, Catalytically Oxidation of NO into NO2 at Room Temperature by Graphitized Porous Nanofibers, Catal. Today, 2013, 201, 109–114 CrossRef CAS PubMed.
  16. J. D. Atkinson, Z. Zhang, Z. Yan and M. J. Rood, Evolution and Impact of Acidic Oxygen Functional Groups on Activated Carbon Fiber Cloth During NO Oxidation, Carbon, 2013, 54, 444–453 CrossRef CAS PubMed.
  17. S. Tang and Z. Cao, Adsorption of Nitrogen Oxides on Graphene and Graphene Oxides: Insights from Density Functional Calculations, J. Chem. Phys., 2011, 134, 044710 CrossRef PubMed.
  18. L. R. Radovic, A. Suarez, F. Vallejos-Burgos and J. O. Sofo, Oxygen Migration on the Graphene Surface. 2. Thermochemistry of Basal-Plane Diffusion (Hopping), Carbon, 2011, 49, 4226–4238 CrossRef CAS PubMed.
  19. L. R. Radovic, A. B. Silva-Tapia and F. Vallejos-Burgos, Oxygen Migration on the Graphene Surface. 1. Origin of Epoxide Groups, Carbon, 2011, 49, 4218–4225 CrossRef CAS PubMed.
  20. X. Bao, X. Nie, D. V. Deak, E. J. Biddinger, W. Luo, A. Asthagiri, U. S. Ozkan and C. M. Hadad, A First-Principles Study of the Role of Quanternay-N Doping on the Oxygen Reduction Reation Activity and Selectivity of Graphene Edge Sites, Top. Catal., 2013, 56, 1623–1633 CrossRef CAS.
  21. D. W. Boukhvalov, Y. W. Son and R. S. Ruoff, Water Splitting over Graphene-Based Catalysts: Ab Initio Calculations, ACS Catal., 2014, 4, 2016–2021 CrossRef CAS.
  22. W. Li, Y. Gao, W. Chen, P. Tang, W. Li, Z. Shi, D. Su, J. Wang and D. Ma, Catalytic Epoxidation Reaction over N-Containing sp2 Carbon Catalysts, ACS Catal., 2014, 4, 1261–1266 CrossRef CAS.
  23. D. Sen, R. Thapa and K. K. Chattopadhyay, A First-Principles Investigation of Oxygen Reduction Reaction Catalysis Capabilities of as Decorated Defect Graphene, Dalton Trans., 2014, 43, 15038–15047 RSC.
  24. H. Zhang, W. Cen, J. Liu, J. Guo, H. Yin and P. Ning, Adsorption and Oxidation of SO2 by Graphene Oxides: A van der Waals Density Functional Theory Study, Appl. Surf. Sci., 2015, 324, 61–67 CrossRef CAS PubMed.
  25. G. Kresse and J. Furthmuller, Efficient Iterative Schemes for Ab Initio Total-Energy Calculations Using a Plane-Wave Basis Set, Phys. Rev. B: Condens. Matter Mater. Phys., 1996, 54, 11169–11186 CrossRef CAS.
  26. G. Kresse and J. Furthmuller, Efficiency of Ab-Initio Total Energy Calculations for Metals and Semiconductors Using a Plane-Wave Basis Set, Comput. Mater. Sci., 1996, 6, 15–50 CrossRef CAS.
  27. J. P. Perdew, K. Burke and M. Ernzerhof, Generalized Gradient Approximation Made Simple, Phys. Rev. Lett., 1996, 77, 3865–3868 CrossRef CAS.
  28. P. E. Blochl, Projector Augmented-Wave Method, Phys. Rev. B: Condens. Matter Mater. Phys., 1994, 50, 17953–17979 CrossRef.
  29. G. Kresse and D. Joubert, From Ultrasoft Pseudopotentials to the Projector Augmented-Wave Method, Phys. Rev. B: Condens. Matter Mater. Phys., 1999, 59, 1758–1775 CrossRef CAS.
  30. S. Grimme, Semiempirical GGA-Type Density Functional Constructed with a Long-Range Dispersion Correction, J. Comput. Chem., 2006, 27, 1787–1799 CrossRef CAS PubMed.
  31. J. Klimes, D. R. Browler and A. Michaelides, Van der Waals Density Functionals Applied to Solids, Phys. Rev. B: Condens. Matter Mater. Phys., 2011, 83, 195131 CrossRef.
  32. I. Hamada, Adsorption of Water on Graphene: A van Der Waals Density Functional Study, Phys. Rev. B: Condens. Matter Mater. Phys., 2012, 86, 195436 CrossRef.
  33. P. Lazar, F. Karlický, P. Jurečka, M. Kocman, E. Otyepková, K. Šafářová and M. Otyepka, Adsorption of Small Organic Molecules on Graphene, J. Am. Chem. Soc., 2013, 135, 6372–6377 CrossRef CAS PubMed.
  34. G. Henkelman and H. Jonsson, Improved Tangent Estimate in the Nudged Elastic Band Method for Finding Minimum Energy Paths and Saddle Points, J. Chem. Phys., 2000, 113, 9978–9985 CrossRef CAS PubMed.
  35. G. Henkelman, B. P. Uberuaga and H. Jonsson, A Climbing Image Nudged Elastic Band Method for Finding Saddle Points and Minimum Energy Paths, J. Chem. Phys., 2000, 113, 9901–9904 CrossRef CAS PubMed.
  36. O. Leenaerts, B. Partoens and F. M. Peeters, Adsorption of H2O, NH3, CO, NO2, and NO on Graphene: A First-Principles Study, Phys. Rev. B: Condens. Matter Mater. Phys., 2008, 77, 125416 CrossRef.
  37. W. Cen, Y. Liu, Z. Wu, H. Wang and X. Weng, A Theoretic Insight into the Catalytic Activity Promotion of CeO2 Surfaces by Mn Doping, Phys. Chem. Chem. Phys., 2012, 14, 5769–5777 RSC.
  38. F. Yao, D. L. Duong, S. C. Lim, S. B. Yang, H. R. Hwang, W. J. Yu, I. H. Lee, F. Güneş and Y. H. Lee, Humidity-Assisted Selective Reactivity between NO2 and SO2 Gas on Carbon Nanotubes, J. Mater. Chem., 2011, 21, 4502 RSC.
  39. E. Garcia-Bordeje, J. L. Pinilla, M. J. Lazaro and R. Moliner, NH3-SCR of NO at Low Temperatures over Sulphated Vanadia on Carbon-Coated Monoliths: Effect of H2O and SO2 Traces in the Gas Feed, Appl. Catal., B, 2006, 66, 281–287 CrossRef CAS PubMed.
  40. Z. Lei, B. Han, K. Yang and B. Chen, Influence of H2O on the Low-Temperature NH3-SCR of NO over V2O5/AC Catalyst: An Experimental and Modeling Study, Chem. Eng. J., 2013, 215, 651–657 CrossRef PubMed.
  41. Y. Liu, W. Yao, X. Cao, X. Weng, Y. Wang, H. Wang and Z. Wu, Supercritical Water Syntheses of CexTiO2 Nano-Catalysts with a Strong Metal-Support Interaction for Selective Catalytic Reduction of NO with NH3, Appl. Catal., B, 2014, 160, 684–691 CrossRef PubMed.
  42. V. Gaur, R. Asthana and N. Verma, Removal of SO2 by Activated Carbon Fibers in the Presence of O2 and H2O, Carbon, 2006, 44, 46–60 CrossRef CAS PubMed.
  43. J.-x. Guo, J. Liang, Y.-H. Chu, M.-C. Sun, H.-Q. Yin and J.-J. Li, Desulfurization Activity of Nickel Supported on Acid-Treated Activated Carbons, Appl. Catal., A, 2012, 421, 142–147 CrossRef PubMed.

Footnote

Electronic supplementary information (ESI) available. See DOI: 10.1039/c4ra15179h

This journal is © The Royal Society of Chemistry 2015
Click here to see how this site uses Cookies. View our privacy policy here.