Paper-based analytical device with colorimetric assay application to the determination of phenolic acids and recognition of Fe3+

Xia Xiang a, Zhen Zhang b, Jianbin Shi c and Fenghong Huang *a
aDepartment of Product Processing and Nutriology, Institute of Oil Crops Research, Chinese Academy of Agricultural Sciences, Hubei Key Laboratory of Lipid Chemistry and Nutrition, Ministry of Agriculture Key Laboratory of Oil Crops Biology, Wuhan 430062, China. E-mail: xiangshi19850130@163.com; Fax: +86-27-68754067; Tel: +86-27-86711526
bKey Laboratory of Analytical Chemistry for Biology and Medicine (Ministry of Education), College of Chemistry and Molecular Sciences, Wuhan University, Wuhan 430072, China
cInstitute of Agro-Products Processing and Nuclear-Agricultural Technology, Hubei Academy of Agricultural Sciences, Wuhan, 430064, Hubei Province, China

Received 13th November 2014 , Accepted 1st December 2014

First published on 1st December 2014


Abstract

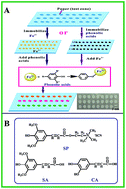
Considering the fact that phenolic acids (PAs) have a versatile activity in vivo and are found to be the most abundant antioxidants in our diet, their detection and quantification is very important for a healthy diet. Herein, we first propose a paper-based analytical device (PAD) for colorimetric detection of PAs and recognition of Fe3+. The PAD is fabricated based on a simple microarray. Specific probes are placed in the test zones on the PAD, followed by the introduction of assay targets. Color response and intensity measurements are directly conducted in the test zones after the completion of the probe-to-target reactions, avoiding the time-consuming integration of external devices and the involvement of chromophoric reagents. The PAD features easy fabrication and operation, low cost, and satisfied sensitivity, which is beneficial for the simple and fast detection of biomolecules.


1. Introduction

Phenolic acids (PAs) are secondary metabolites in plants, which have gained enormous attention in analytical chemistry and nutrition fields due to their important health properties and antioxidant activity.1–5 There has been interest for the detection of PAs, using for example chromatography,6,7 capillary electrophoresis,8 mass spectrometry,9,10 electrochemical analysis11 and optical spectroscopy.12 However, these methods require expensive instruments or a time-consuming experimental process. It is significant to establish a simple, fast, and sensitive detection method for PAs.

The attention in paper analytical devices (PADs) has increased rapidly in recent years as a result of their attractive features, including low cost, ease of use (without the need of an external fluid-driving facility), low consumption of reagents and samples, and so on. PADs have been widely exploited in medical diagnosis,13 environmental monitoring14 and food quality control.15 Accordingly, a variety of analytical techniques have been developed on PADs, such as colorimetry,16,17 absorbance,18 fluorescence,19 chemiluminescence (CL),20 electrochemistry,21,22 electro-generated chemiluminescence (ECL),23,24 surface-enhanced Raman scattering,25 localized surface plasmon resonance26 and photoelectrochemistry.27,28 However, it is relatively difficult to perform spectrometric and electronic measurements directly on PADs due to the rather serious background luminescence of additives and integration of signal-output equipment, which leads to the extremely demanding requirements of high cost and a complex experimental process. As such, a colorimetric strategy remains to be commonly used on PADs because of its simplicity, low cost, easy operation and straightforward signal read-out.

To develop a simple and effective strategy for a PA assay, we made an effort to embed the detection of PAs in a PAD. Herein, we report a PAD as an assay platform for the colorimetric detection of PAs and the recognition of Fe3+. Due to the diversity of PAs, we select three important bioactive phenolic acids both as model analytes (sinapine (SP), sinapine acid (SA) and caffeic acid (CA)) and recognition probes for Fe3+. The principle is illustrated in Scheme 1. For the detection of PAs, the primary Fe3+-based PAD is formed by the addition of Fe3+ on the surface of the PAD with a negligible color background. When PAs are added in the test zones of the PAD, the PAs react with Fe3+, along with significant color responses for a visual read-out. In this way, the concentrations of the PAs are quantitatively determined by recording the color change. However, with the formation of a PA-PAD, the colorimetric recognition of Fe3+ is performed based on the change in color and intensity generated from the addition of Fe3+ added to the PA-PAD. The important merits of this proposed PAD platform for PAs are its simplicity and portability, avoiding the integration of external equipment and chromophore reagent due to the simple device fabrication and direct color reaction involved, which will greatly promote the development of PADs for plant-derived molecules.


image file: c4ra14465a-s1.tif
Scheme 1 (A) Schematic diagram of the PAD with a colorimetric assay for the detection of phenolic acids and recognition of Fe3+. (B) The structures of the phenolic acids.

2. Experimental

2.1 Chemicals and reagents

PbCl2, MgSO4, CaCl2, CdCl2·2H2O, CoCl2·2H2O, HgCl2, ZnSO4·7H2O, MnCl2·4H2O, FeSO4·7H2O, FeCl3·6H2O, CrCl3, NiCl2·6H2O, CuCl2 were purchased from Sinopharm Chemical Reagent Co. Ltd., China. Sinapine thiocyanate was obtained from the National Institutes for Food and Drug Control, China. Sinapine acid, caffeic acid, MOPS, CuSO4·5H2O and NaCl were obtained from Sigma-Aldrich Co. Ltd., USA. The other reagents were all analytically pure and used without further purification. Sinapine thiocyanate, sinapine acid and caffeic acid were dissolved with methanol as stock solutions.

2.2 Instrumentation

Images were acquired by a Nikon camera (COOLPIX 5400) and the ChemiDoc XRD system (Bio-Rad). A vertical full-temperature incubator (HZQ-F160) and an electric blast oven (DHG-9055A, Shanghai Yiheng Scientific Instrument Co. Ltd., China) were used to accelerate the solvent evaporation. A G-17 lithography machine (Chengdu Xinnan Co. Ltd., China), a PDC-M Plasma cleaning machine (Chengdu Mingheng Scientific Instrument Co. Ltd., China), and a KW-4H-350 hot plate (Shanghai KMT functional ceramics Co. Ltd., China) were used in the fabrication of the paper devices.

2.3 Preparation of the paper-based analytical device

The paper-based analytical device was fabricated according to ref. 29. Firstly, a piece of Whatman paper was entirely soaked in 5 mL SU-8 2010 photoresist in a container for 10 min. Secondly, the paper was taken out and the redundant photoresist was removed. Then, it was baked at 130 °C for 10 min to remove the solvent. Finally, the paper was exposed at 405 nm UV light for 50 s through an array mask with a dot array (2 mm diameter), which was designed with the CorelDraw software. After exposure, the paper was baked at 130 °C for 5 min again to remove the unpolymerized photoresist. For the PAD, the test zones were hydrophilic and the other areas were hydrophobic. For our detection system, the baked paper was tailored in a PAD (3 × 10 array) with 4.5 cm length and 1.5 cm width.

2.4 Preparation of the practical sample

The extraction of SP: 0.1 g rapeseed meal was ultra-sonicated for 20 min after addition of 4 mL methanol–water mixture (50/50, v/v). The mixture was stirred in a vortex and centrifuged at 5000 rpm for 10 min. Then, the methanol layer was separated and the extraction was repeated twice. After that, it was kept at −20 °C overnight and passed through a 0.45 µm Millipore filter. The filtrate was collected for colorimetric analysis.

The extraction of SA: 1.25 g rapeseed oil was extracted by 1.5 mL of n-hexane and 1.5 mL of methanol–water mixture (80/20, v/v), after mixing for 5 min. The mixture was stirred in a vortex and centrifuged at 5000 rpm for 10 min. Then, the methanol layer was separated and the extraction was repeated twice. After that, it was kept at −20 °C overnight and passed through a 0.45 µm Millipore filter. The filtrate was collected for colorimetric analysis.

2.5 Sensing and recognition procedure for PAs and Fe3+

Due to the diameters of all the zones being 2 mm, the sample of 2 µL could fill the zone. For PA sensing, a FeCl3 solution, dissolved in pure water, was first placed in the test assays of the PAD with 2 µL per zone. Then the PAD was incubated at 37 °C for 10 min to make Fe3+ coat the surface of the PAD and form a modified PAD (Fe3+-PAD). With the addition of the PAs and incubation on the Fe3+-PAD for 5 min, the color responses appeared and were immediately imaged by a camera and the ChemiDoc system. The color intensities of the common camera and the ChemDoc images were obtained, using the quantity one software to transfer the images into gray scale, and directly recorded by the Bio-Rad device. For Fe3+ recognition, the PAs, prepared in a MOPS buffer, were first placed on the surface of the PAD to form a PA-PAD. The recognition of Fe3+ was performed according to the above experimental processes.

3. Results and discussion

3.1 The feasibility and mechanism of colorimetric sensing of PAs on the PAD

We first investigated the viability of our strategy. On the Fe3+-PAD, there were no color responses in the absence of PAs. The addition of PAs (SP, SA and CA) to the Fe3+-PAD caused the test zones to show orange, pink, and green (Fig. 1A). The results demonstrated specific color responses between PAs and Fe3+, implying the feasibility of the colorimetric detection of PAs on the PAD. The UV-vis spectra of the PAs showed obvious changes in the peak position and width of the absorption spectra in the presence of Fe3+ (Fig. 1B). It verified that an interaction existed between PAs and Fe3+. The different color responses for the PAs could be ascribed to the differences in structures and functional groups of the PAs.
image file: c4ra14465a-f1.tif
Fig. 1 (A) A photograph of the Fe3+-PAD with different PAs: (1) blank; (2) SP; (3) SA; (4) CA. The concentrations of the PAs were 2 mM. The concentration of Fe3+ was 35 mM. (B) UV-vis absorption spectra of the PAs in the absence (1) and presence of Fe3+ (2). (C) A photograph of the different PAs with different metal ion solutions: (1) Fe3+; (2) Fe3+–SA; (3) Fe3+–SP; (4) Fe3+–CA; (5) Fe2+; (6) Fe2+–SA; (7) Fe2+–SP; (8) Fe2+–CA. (D) A photograph of the different PAs with different K3[Fe(CN)6] solutions: (1) Fe3+–K3[Fe(CN)6]; (2) Fe2+–K3[Fe(CN)6]; (3) SA–K3[Fe(CN)6]; (4) SA–Fe3+–K3[Fe(CN)6]; (5) SP–K3[Fe(CN)6]; (6) SP–Fe3+–K3[Fe(CN)6]; (7) CA–K3[Fe(CN)6]; (8) CA–Fe3+–K3[Fe(CN)6].

Considering the antioxidant property of the PAs and coordination interaction between Fe3+ and the phenolic hydroxyl group, there are two possible factors to influence the color reaction of PAs and Fe3+ on the PAD: complexation interaction and redox process. Fig. 1C showed the color responses of Fe2+ and Fe3+ solutions in the absence and presence of PAs. Obviously, all solutions of PA–Fe3+ showed color responses, however, a color response was only found for the CA–Fe2+ solution, which was consistent to the responses on the PAD. Furthermore, K3[Fe(CN)6], which is a classical reagent for identifying Fe2+, was used to explore the color reaction between Fe3+ and the PAs. It can obviously seen from Fig. 1D that the PA–K3[Fe(CN)6] solutions showed a characteristic blue color in the presence of Fe3+, which presented similar color responses as the Fe2+–K3[Fe(CN)6] solution. However, no blue colors were found for the PA–K3[Fe(CN)6] and Fe3+–K3[Fe(CN)6] solutions. According to the property of Fe2+ and Fe3+, we concluded that a redox process could be involved in the colorimetric reaction of PAs and Fe3+, in which Fe3+ was reduced into Fe2+ by the PAs.

3.2 Optimization of the variables

The effects of the Fe3+ concentration and pH of the buffer on the detection system were evaluated (Fig. S1 and S2). It was worthy to notice that an obvious pink color response appeared when the Fe3+ concentration was 35 mM. The color was shown to be orange with an increase in the Fe3+ concentration, which may suffer from a color response overlap between SA and SP with Fe3+. The color responses of the PAs had no big differences at different pH values (in 10 mM MOPS buffer, 150 mM NaCl). In order to prevent the generation of iron hydroxide, the parameters of 35 mM and pH 6.5 were chosen for the colorimetric assay in the following experiments.

3.3 The determination of the PAs on the Fe3+-PAD

To evaluate the detectable minimum concentration of the PAs, different concentrations of the PAs were added to the test zones of the Fe3+-PAD (Fig. 2). With an increase in the PA concentrations, a series of dramatic increase in the color intensity was observed. In Fig. 2b and c, the color intensity was analysed by the quantity one software and the ChemDoc system. Six calibration curves were obtained. For the camera imaging, with the aid of the quantity one software, the detection limits (LODs) ((ΔY + 3σ)/S, where ΔY was the difference value between the mean value of the blank solution and the intercept, σ was the relative standard deviation of the blank solution, n = 10, and S is the slope of the calibration curve) were 0.12, 0.10 and 0.18 mM for SP, SA and CA, respectively. With the ChemDoc system, the LODs were 0.04, 0.04 and 0.05 mM for SP, SA and CA, respectively. Although the sensitivity of the camera system was lower than that of the ChemDoc system, the camera system still had some important advantages, such as low detection cost, simplicity and convenience, which would be more suitable for a rapid and point-of-care detection. Compared to the low sensitivities of conventional reported methods,6,11,30 this PAD strategy offered a simple, portable and low cost method. More importantly, the PAD-based colorimetric assay could provide a long-distance data assay by sending pictures to professional operators in resource-limited environments. In addition, the PAD-based colorimetric assay applied for PA detection laid a foundation for extending the PAD platform to plant-derived biomolecules.
image file: c4ra14465a-f2.tif
Fig. 2 (a) A photograph of the Fe3+-PAD with different concentrations of PAs (0.06–8 mM). (b) The linear relationship between the color intensity and the concentrations of the PAs based on the quantity one software. The liner ranges for the PAs were 0.2–2 mM (SP), 0.2–4 mM (SA) and 0.2–2 mM (CA). (c) The linear relationship between the color intensity and the concentrations of the PAs based on the ChemDoc system. The liner ranges for the PAs were 0.06–1 mM (SP), 0.06–4 mM (SA) and 0.06–1 mM (CA).

3.4 The recognition and detection of Fe3+ on the PA-PAD

This PAD was also applied for the recognition of Fe3+. As shown in Fig. 3, obvious color responses were found in the all test zones of the two PA-PADs after the addition of Fe3+. While no color responses were simultaneously found with the addition of other metal ions. Moreover, a green color was found in the CA test zones with the addition of Fe2+, but no color responses were observed on the SP and SA test zones. The absorption spectrum (Fig. S3) showed that the color response was caused by the binding interaction of Fe2+ and CA. The results implied the potential use of the PAD for the specific identification for Fe3+ by the naked eye, and the discrimination ability for Fe2+ and Fe3+.
image file: c4ra14465a-f3.tif
Fig. 3 A photograph of the PA-PAD with different metal ions: (1) Pb2+; (2) Mg2+; (3) Ca2+; (4) Cd2+; (5) Co2+; (6) Hg2+; (7) Zn2+; (8) Mn2+; (9) Fe2+; (10) Fe3+; (11) Cr3+; (12) Ni2+; (13) Cu2+; (14) Fe3+. The concentrations of the PAs were 2 mM. The concentrations of the metal ions were 35 mM.

The assay of Fe3+ on the PA-PAD was carried out with fixed PA concentrations. Fig. 4 shows the color responses of the PAD in the presence of different concentrations of Fe3+ and the calibration curves for the Fe3+ detection based on the software analysis and the ChemDoc imaging. With the software system, the LODs were 1.4 mM and 0.27 mM for the SP-PAD and the SA-PAD, respectively. With the ChemDoc imaging system, the LODs for Fe3+ were estimated to be 0.09 mM for the SP-PAD and 0.08 mM for the SA-PAD, which are comparable to the reported methods.31,32


image file: c4ra14465a-f4.tif
Fig. 4 (a) Photograph of the PA-PADs with different concentration of Fe3+ (1.4–9 mM and 0.12–7 mM); (b) the linear relationship between the color intensity and the concentration of Fe3+, based on the quantity one software. The linear ranges for the PAs were 2.1–7 mM (SP) and 0.35–3.5 mM (SA). (c) The linear relationship between the color intensity and the concentration of Fe3+, based on the ChemDoc system. The linear ranges for the PAs were 1.4–7 mM (SP) and 0.14–3.5 mM (SA).

3.5 Application with the practical samples

Due to the high content and significant bioactivity of SP and SA, the potential application of the PAD was evaluated with a recovery test of SP and SA in rapeseed extracts (Table S1). The rapeseed samples were extracted and diluted before spiking. Different samples were added to the Fe3+-PAD. The recovery percent of SP detected in rapeseed meal ranged from 90.0% to 103.3% of the samples, and the recovery percent of SA detected in rapeseeds oil ranged from 92.5% to 102.0% of the samples, which is satisfactory for quantitative assays performed in biological samples, thereby proving the efficiency of the proposed PAD in detecting plant-derived biomolecules.

3.6 The preserve time of the detection kit

In the experiment, the used PADs have been placed at room temperature for at least six months after they are fabricated, implying a good stability for the PAD itself. Then, we explored the preserve time of the Fe3+-PAD. The Fe3+ solution was first placed on the surface of the PAD to form the Fe3+-PAD as a detection kit, and it was preserved at room temperature. In order to figure out the preservation period, a standard CA solution with the concentration of 2 mM was employed to evaluate the effective color response of the detection kit in half a month. The color responses were recorded based on three different imaging modes (Nikon camera, Xiaomi smartphone camera and ChemiDoc system), and the plot of the intensity of the CA detection kits is shown in Fig. S4. Apparently, the intensity showed no obvious change with an increase in preserve time. Furthermore, the intensity had a trend to preserve the stability for a long period. Therefore, the detection kit could be preserved for more than 15 days, which is long enough for transportation and storage. Moreover, stable signal outputs are found with the portable and low-cost common camera and smartphone camera, which will be beneficial for the development of more low-cost PAD-based analytical platforms.

4. Conclusions

In summary, we have developed a simple PAD with a colorimetric assay for the detection of bioactive phenolic acids and recognition of Fe3+. With the addition of phenolic acids or Fe3+ on the PAD, the interaction of phenolic acids with Fe3+ is produced along with a significant color response for a visual read-out. Compared to reported methods for phenolic acids and Fe3+, the PAD with the color assay is portable and has a long preserve time, effectively avoiding the integration of complicated and time-consuming instruments, the use of chromogenic reagents, and saving a lot of time and cost, which is beneficial for the development of convenient and effective analytical platforms for plant-derived biomolecules.

Acknowledgements

This work was supported by the National Natural Science Foundation of China (31271856), the China Postdoctoral Science Foundation (2014M550898), the Earmarked Fund for China Agriculture Research System (CARS-13), and the Director Fund of Oil Crops Research Institute (1610172014006).

Notes and references

  1. H. K. Obied, Y. Song, S. Foley, M. Loughlin, A.-u. Rehman, R. Mailer, T. Masud and S. Agboola, J. Agric. Food Chem., 2013, 61, 9176–9184 CrossRef CAS PubMed.
  2. C. Engels, A. Schieber and M. Gänzle, Eur. Food Res. Technol., 2012, 234, 535–542 CrossRef CAS.
  3. M. Zhang, J. Zhou, L. Wang, B. Li, J. Guo, X. Guan, Q. Han and H. Zhang, Biol. Pharm. Bull., 2014, 37, 347–354 CAS.
  4. B. Kim, J. E. Kim and H. S. Kim, J. Pharm. Pharmacol., 2014, 66, 84–92 CrossRef CAS PubMed.
  5. C. W. Hsiao and L. B. Julia, in Oxidative Stress: Diagnostics, Prevention, and Therapy, American Chemical Society, 2011, pp. 99–175 Search PubMed.
  6. R. Khattab, M. Eskin, M. Aliani and U. Thiyam, J. Am. Oil Chem. Soc., 2010, 87, 147–155 CrossRef CAS PubMed.
  7. S. Vuorela, A. Meyer and M. Heinonen, Eur. Food Res. Technol., 2003, 217, 517–523 CrossRef CAS PubMed.
  8. H. Franquet-Griell, A. Checa, O. Núñez, J. Saurina, S. Hernández-Cassou and L. Puignou, J. Agric. Food Chem., 2012, 60, 8340–8349 CrossRef CAS PubMed.
  9. U. Thiyam, P. Claudia, U. Jan and B. Alfred, Eur. Food Res. Technol., 2009, 229, 825–831 CrossRef CAS PubMed.
  10. D. Huang, L. Luo, C. Jiang, J. Han, J. Wang, T. Zhang, J. Jiang, Z. Zhou and H. Chen, J. Agric. Food Chem., 2011, 59, 2148–2156 CrossRef CAS PubMed.
  11. H. Zhou, Y. Huang, T. Hoshi, Y. Kashiwagi, J.-i. Anzai and G. Li, Anal. Bioanal. Chem., 2005, 382, 1196–1201 CrossRef CAS PubMed.
  12. S. X. Wang, B. D. Oomah and D. I. McGregor, J. Agric. Food Chem., 1998, 46, 575–579 CrossRef CAS PubMed.
  13. M. Li, J. Tian, M. Al-Tamimi and W. Shen, Angew. Chem., Int. Ed., 2012, 51, 5497–5501 CrossRef CAS PubMed.
  14. A. Apilux, W. Dungchai, W. Siangproh, N. Praphairaksit, C. S. Henry and O. Chailapakul, Anal. Chem., 2010, 82, 1727–1732 CrossRef CAS PubMed.
  15. S. M. Z. Hossain, R. E. Luckham, M. J. McFadden and J. D. Brennan, Anal. Chem., 2009, 81, 9055–9064 CrossRef CAS PubMed.
  16. D. M. Vykoukal, G. P. Stone, P. R. C. Gascoyne, E. U. Alt and J. Vykoukal, Angew. Chem., Int. Ed., 2009, 48, 7649–7654 CrossRef CAS PubMed.
  17. X. Chen, J. Chen, F. Wang, X. Xiang, M. Luo, X. Ji and Z. He, Biosens. Bioelectron., 2012, 35, 363–368 CrossRef CAS PubMed.
  18. E. Carrilho, S. T. Phillips, S. J. Vella, A. W. Martinez and G. M. Whitesides, Anal. Chem., 2009, 81, 5990–5998 CrossRef CAS PubMed.
  19. F. Zhou, M. O. Noor and U. J. Krull, Anal. Chem., 2014, 86, 2719–2726 CrossRef CAS PubMed.
  20. L. Ge, S. Wang, X. Song, S. Ge and J. Yu, Lab Chip, 2012, 12, 3150–3158 RSC.
  21. H. Liu and R. M. Crooks, Anal. Chem., 2012, 84, 2528–2532 CrossRef CAS PubMed.
  22. H. Liu, Y. Xiang, Y. Lu and R. M. Crooks, Angew. Chem., Int. Ed., 2012, 51, 6925–6928 CrossRef CAS PubMed.
  23. J. L. Delaney, C. F. Hogan, J. Tian and W. Shen, Anal. Chem., 2011, 83, 1300–1306 CrossRef CAS PubMed.
  24. L. Ge, J. Yan, X. Song, M. Yan, S. Ge and J. Yu, Biomaterials, 2012, 33, 1024–1031 CrossRef CAS PubMed.
  25. W. W. Yu and I. M. White, Analyst, 2013, 138, 1020–1025 RSC.
  26. L. Tian, J. J. Morrissey, R. Kattumenu, N. Gandra, E. D. Kharasch and S. Singamaneni, Anal. Chem., 2012, 84, 9928–9934 CrossRef CAS PubMed.
  27. G. Sun, P. Wang, S. Ge, L. Ge, J. Yu and M. Yan, Biosens. Bioelectron., 2014, 56, 97–103 CrossRef CAS PubMed.
  28. Y. Wang, L. Ge, P. Wang, M. Yan, S. Ge, N. Li, J. Yu and J. Huang, Lab Chip, 2013, 13, 3945–3955 RSC.
  29. C. M. Cheng, A. W. Martinez, J. Gong, C. R. Mace, S. T. Phillips, E. Carrilho, K. A. Mirica and G. M. Whitesides, Angew. Chem., Int. Ed., 2010, 49, 4771–4774 CrossRef CAS PubMed.
  30. S. X. Wang, B. D. Oomah and D. I. McGregor, J. Agric. Food Chem., 1998, 46, 575–579 CrossRef CAS PubMed.
  31. Q. Mei, C. Jiang, G. Guan, K. Zhang, B. Liu, R. Liu and Z. Zhang, Chem. Commun., 2012, 48, 7468–7470 RSC.
  32. S. P. Wu, Y. P. Chen and Y. M. Sung, Analyst, 2011, 136, 1887–1891 RSC.

Footnote

Electronic supplementary information (ESI) available. See DOI: 10.1039/c4ra14465a

This journal is © The Royal Society of Chemistry 2015
Click here to see how this site uses Cookies. View our privacy policy here.