
Microstructure and properties of carbon nanosheet/copper composites processed by particle-assisted shear exfoliation
Lidong Wangab,
Ye Cuia,
Shuai Yanga,
Bin Lia,
Yuanyuan Liua,
Pei Dongb,
James Bellahb,
Guohua Fana,
Robert Vajtai*b and
Weidong Fei*ac
aSchool of Materials Science and Engineering, Harbin Institute of Technology, Harbin, 150001, China. E-mail: wdfei@hit.edu.cn; Tel: +86 451 86418647
bDepartment of Materials Science and Nano Engineering, Rice University, Houston, 77005, Texas, USA. E-mail: Vajtai@rice.edu; Tel: +1 713 348 5904
cSchool of Mechanical Engineering, Qinghai University, Xining, 810016, China
First published on 28th January 2015
Abstract
The aim of this work is to demonstrate a facile and scalable method to produce carbon nanosheet (CNS) based composites. CNSs and copper composite powders were produced directly from graphite and copper particles in liquids using a high shear rotor–stator mixer, the method is called particle-assisted shear exfoliation (PASE). CNS reinforced copper composites were produced with the composite powders by spark plasma sintering (SPS). High strengthening efficiencies of CNSs in copper matrix composites were found, which are similar to those of carbon nanotubes. The interfacial microstructure of the composites was studied; a close contact between carbon and copper was obtained in the composite, which contributes to the mechanical property of the composites. PASE is also promising to produce many other kinds of composites by choosing numerous other layered crystals and nanomaterial particles.
Introduction
Carbon nanosheets (CNSs, which includes single-layer graphene, few-layer graphene (FLG) and graphite nanosheets with a thickness less than 100 nm) are promising to revolutionize the research and applications of nano carbon based materials in the near future,1–3 due to their outstanding chemical, mechanical, electrical and thermal properties.4,5 Many methods have been developed to produce graphene and CNS, such as micromechanical cleavage of graphite,1 chemical vapor deposition (CVD),6 epitaxial growth on SiC,7,8 exfoliation by sonication,9 chemical oxidation and reduction methods,10,11 self-propagating high-temperature synthesis,12 conventional calcination,13 reduction of CO14 and CO2 (dry ice),15 unzipping of carbon nanotubes16,17 and laser reduction of graphene oxide.18–21 The excellent properties of graphene make it an excellent candidate as the reinforcement for different kinds of composites,22,23 which could be used in a wide range of fields such as catalysis,24 batteries,25 supercapacitors26 and nanocomposites.2CNS reinforced polymer matrix composites have attracted more attention since 2006; their properties, such as electrical conductivity, Young's modulus and tensile strength, were remarkably improved by a low loading of CNS.2,27–29 CNSs also show dramatically effects on the enhancement of the fracture toughness and conductivity of the CNS reinforced ceramic matrix composites.30–32 Recently, graphene reinforced metal matrix composites demonstrate extraordinary reinforcement ability; Kim et al.33 produced nanolayered graphene reinforced metal composites with ultra-high strength up to 1.5 GPa for copper matrix composite and 4.5 GPa for nickel matrix composite. Hwang et al.34 fabricated successfully CNS/Cu composites with the help of a molecular-level mixing method (MLM), remarkably improvement of the composite strengths was found. Consequently, different kinds of graphene and CNS based composites have shown great improvements on the multiple properties of the composites.
Generally speaking, the production of CNS/metal composites is not as easy as the polymer matrix composites. Because graphene oxide usually used in polymer matrix composites is easy to be produced in large scale, distributed homogeneously in solution and decorated with different groups which help to link with the groups of polymer and adjust the properties of the composites. However, the techniques used in CNS/metal composites are more difficult compared with those used for polymer matrix composites. For example, the nanolayered metal matrix composites have strict requirements for equipment and process;33 the production of the composites by MLM method needs a long process including the production of graphene oxide, the distribution of graphene oxide into the solution of copper salt, drying, reducing and sintering processes of the composite powder.34 So it is still a great challenge to develop simple and mass production methods for CNS/metal composites. However, there are few studies on this field, new methods should be developed for CNS based composites with practical value.
Shear mixing has already shown a broad application prospects in nanomaterials field. It is usually used to disperse nanoparticles in liquids by breaking up the nanoparticle agglomerates.35 Recently, Paton et al.36 pointed out that high-shear mixing can also be used to exfoliate graphite into graphene in liquids. Shear mixing is useful to exfoliate directly untreated layered crystals in liquids using only high-shear mixer, which is different from the methods mentioned in a number of references for the exfoliation of graphite or layered compounds that incorporated shear mixing because treated layered crystal was first produced by intercalation to weaken the interlayer binding strength in these ref. 2, 32, 33 and 37.
Based on the ref. 36 and our technique,38 we produced successfully CNS/Cu composite powder directly from graphite and copper particles in liquids using shear mixing; since copper particles play an important role in the exfoliation process, the method is called particle-assisted shear exfoliation (PASE). The CNS/Cu composite powder was then consolidated into CNS/Cu composite by spark plasma sintering (SPS). High strengthening effect of CNS, high compressive strengths and good electrical conductivity were obtained simultaneously in the CNS/Cu composites. In our knowledge, it is the first time to produce CNS reinforced copper matrix composite with good properties from graphite and copper with 100% use of the starting materials.
Experimental
Sample preparation
CNS/Cu composite powders were produced in our lab by mixing graphite and copper particles in liquid using a rotor–stator mixer. Commercial flake graphite (50 μm, >98%, Tianjin Bodi chemical holding Co., Ltd.), two kinds of copper particles (particle size 50 nm, Jiaozuo Banlu Nano Material Engineering Co., Ltd and particle size 500 nm, Guangbo New Nanomaterials Stock Co., Ltd.) were dispersed in a solvent (ethyl alcohol, 1,3-propanediol or 1,3-butanediol) to obtain a slurry (the compositions were listed in Table 1). A rotor–stator mixer (BME200L, Shanghai Weiguang Machine Co. Ltd.) was used to treat the slurry in a vessel as shown in Fig. 1. The mixing head is a 4-blade rotor with a diameter of 35 mm that sits within a fixed screen known as the stator (the rotor–stator gap is ∼100 μm). The mixing speed is 3000 rpm. The treated slurry was centrifuged for 1 h with a speed of 8000 rpm to separate the composite powders from the solvent using a TG16G centrifuge (Hunan Kaida Technology Co. Ltd.). The composite powders were further heated at 200 °C in air to remove the residual solvent after centrifugation.| Sample | Graphite [g] | Cu (50 nm) [g] | Cu (500 nm) [g] | Solvent [ml] |
|---|---|---|---|---|
| A | 0.9375 | 0 | 150 | 500 (ethyl alcohol) |
| B | 0.9375 | 0 | 150 | 500 (1,3-propanediol) |
| C | 0.9375 | 0 | 150 | 500 (1,3-butanediol) |
| D | 0.9375 | 50 | 100 | 500 (1,3-butanediol) |
 | ||
| Fig. 1 Schematic illustration of experimental set-up. | ||
The composite powder D was reduced by H2 in a furnace at 200 °C for 30 min. The composite, denoted as CNS/Cu(D), with a diameter of 20 mm and a length of 5 mm was sintered by SPS method from the H2-reduced powder D in a graphite mold with an inside diameter of 20 mm at 600 °C in the vacuum of 0.1 Pa under a die head pressure of 40 MPa for 5 min with a heating rate of 100 °C min−1. The weight percent of CNS in the composite is 0.6 wt% and the volume fraction is 2.5 vol%. As a comparison, a pure copper sample was also produced by SPS in the same preparation conditions as the CNS/Cu composites.
Characterization
Scanning electron microscopy (SEM) images of the composite powders were obtained on an FEI Quanta 200FEG SEM. Transmission electron microscopy (TEM) and high resolution transmission electron microscopy (HRTEM) images were obtained on an FEI Tecnai G2 F30 TEM operated at 300 kV. The TEM samples of the powders were prepared by dripping the dilute slurry of the composite powder on a micro grate. The TEM samples of the composites had a thickness of 30 micrometers and a diameter of 3 mm; an electron transparent thin area was obtained by making a small hole in the middle of the samples using an argon ion milling (Gatan 691 Precision Ion Polishing System). X-ray photoelectron spectroscopy (XPS) measurements were conducted with a K-alpha (Thermo Fisher) system for XPS measurement. Non-monochromatic Al Kα radiation was operated under vacuum 1.0 × 10⁻⁸ mbar; the constant-pass energy mode is 50 eV with a step size of 0.1 eV for the C1s photoelectron line. Raman spectroscopy (532 nm excitation) was performed on a BWS435-532SY Raman spectroscopy. The phases of the composite powders and the composites were analyzed by X-ray diffraction (XRD) on a Philips X'Pert X-ray diffractometer with Cu Kα radiation. Compressive test was performed by using an Instron 5500R All-purpose Electronic Tester with a crosshead speed of 0.5 mm min−1 in room temperature. The compressive samples have a cylindrical disc shape, with 3 mm in height and 3 mm in diameter. The loading directions are parallel to the squeezing direction of the specimens. The conductive property was tested by four probe method with a 2512B Low DC Resistance Tester (Suzhou Changsheng Electronic Technology Co., Ltd.). The samples for conductivity tests were cut into sheets, 17 mm in length, 5 mm in width and 0.2 mm in thickness. The direction of conductivity tests is vertical to the pressing direction of the specimens.Result and discussion
In order to investigate semi-quantitatively the influence of solvent on the thinning effect of graphite, the value of the intensity ratio of graphite (002) peak verse Cu (111) peak (Igraphite(002)/ICu(111)) is used as an index, according to the XRD spectra of the composite powders. The reasons are as follows. (1) The intensity of copper is considered as a reference based on the fact that the contents of copper in composite powders are same before and after mixing. We measured the diameters of 100 spherical copper particles randomly in the SEM images before and after 16 h mixing, respectively; the mean sizes of spherical copper particles before and after mixing were calculated and were 579.4 nm and 545.9 nm, respectively. The average size of the copper particles after mixing is 6% less than that of the particles before mixing, which is caused by the friction between particles during the mixing process. The result indicates that the diameter of copper particles were not changing much during the mixing process. (2) The peaks corresponding to graphite (002) and Cu (111) are the strongest peaks among the peaks of crystal graphite (PDF no. 41-1478) and copper (PDF no. 04-0836), respectively, which can give us more accurate information about the thickness of CNS sheets.Fig. 2a shows the XRD curves of composite powders of A–C produced with different solvents treated at 3000 rpm for 8 h by the rotor–stator mixer. The viscosities of ethyl alcohol, 1,3-propanediol and 1,3-butanediol are 1.1,39 47.4 (ref. 39) and 96 (ref. 40) mPa s, respectively. It is clear that the values of Igraphite(002)/ICu(111) shown in Fig. 2b corresponding to sample A–C decrease with the increase of solvent viscosity. It is surprising to find that the value of Igraphite(002)/ICu(111) is very weak for sample C, which means that graphite has been exfoliated so effectively that the peak of graphite (002) can hardly be detected by the XRD. This result indicates that 1,3-butanediol is the best solvent for graphite exfoliation among the three solvents. The XRD spectrum of sample D treated at 3000 rpm for 8 h is also shown in Fig. 2a, which is similiar with that of sample C. The (002) peak of graphite for sample D is also invisible, which indicates that the exfoliation effect of graphite for sample D is similiar with that for sample C. As a result, the regular layered structure of graphite is destroyed efficiently during the shear mixing process.
 | ||
| Fig. 2 (a) XRD spectra of composite powders corresponding to sample A–D; (b) histogram of Igraphite(002)/ICu(111) corresponding to sample A–C. | ||
Representative SEM images of the composite powder D treated for 16 h are shown in Fig. 3a and b. Fig. 3a indicates that graphite has been exfoliated into thin graphite sheets like ruffled pages, representing that the method has a distinct exfoliation effect on flake graphite. Fig. 3b shows a transparent, crumpled and veil-like sheet with a diameter of ∼10 μm, which suggests the PASE method could produce sheets with a large size. Part of the sheet embeds in the copper powder, suggesting that the copper particles can prevent CNSs from restacking.
 | ||
| Fig. 3 (a) Representative SEM image of some sheets look like ruffled pages; (b) SEM image of a sheet like crumpled silk veil; (c) TEM of the composite powder D with an insert SADPs (white lines were added to demonstrate the hexagonal structure of the diffraction pattern); (d) HRTEM image of the CNS edges; (e) statistical chart of the sheets with different thickness, the “N” in image is the piece number of the sheets observed; (f) representative raman spectra of composite powder D treated for 8 h and graphite. The inset is XPS of C1s spectrum of the composite powder D treated for 72 h. | ||
Fig. 3c is the TEM image of the composite powder D, in which many stacked thin sheets can be seen. The selected area diffraction patterns (SADPs) of the multilayer sheets in the inset of Fig. 3c show sets of patterns, one of them is demonstrated by white lines with a hexagonal structure, which illustrates that the sheets have good crystal structure.
HRTEM image of the composite powder D in Fig. 3d exhibits a thin CNS, which is about 8 layers and 2.84 nm in thickness. The interplanar distance is ∼0.36 nm, which is similiar with that of graphite. Several pieces of graphene can be found just pointed by a white arrow in Fig. 3d, which offers a proof indicates that graphene could be exfoliated from the surface of graphite by PASE.
HRTEM is also used to classify the thickness of CNS in the composite powders. The thickness distribution of CNS edge was obtained by large number of HRTEM observations of the composite powder D treated for 8–72 h as shown in Fig. 3e. The number (N) of CNSs for the observations is 24. The thicknesses of CNSs are mainly within 20 nm, which are less than 60 layers of graphene, while around 61% of them are within 10 nm.
The Raman spectrum of the composite powder D in Fig. 3f demonstrates three primary features: a D band at ∼1347 cm−1, a G band at ∼1578 cm−1 due to the two-fold degenerate E2g mode at the zone centre, and a second-order D (2D) band at ∼2710 cm−1. It is generally accepted that the intensity ratio of the D bond to G bond (ID/IG) in Raman reflects the defect concentration of carbonaceous materials, the lower the ratio, the less the defect concentration.41 According to Fig. 3f, the ID/IG ratio for sample D is 0.14, which is much lower than that of reduced graphene oxide (RGO) (ID/IG = 1.1)42 and that of FLG produced by mild ball milling (ID/IG ≈ 0.62),43 but higher than those of produced by CVD6 and liquid-phase exfoliation9 (ID/IG ≈ 0). As a result, the defect concentration in CNSs is much lower than those in RGO and FLG produced by mild ball milling, but higher than those produced by CVD and liquid-phase exfoliation. This result is consistent with reference, in which high quality graphene has been produced from graphite in liquid by shear mixing.
Fig. 3f compares the Raman spectra of the composite powder and bulk graphite. It is interesting to see that the shape of 2D peak of the composite powder is different from that of graphite. For the 2D peak of graphite, the main peak is at 2713 cm−1 and there is a clear “shoulder” on its left because two components (2D1 and 2D2) exist in bulk graphite.44 However, for the powder sample, the 2D peak is more symmetric and no obvious “shoulder” can be found. In addition, the full width at half maximum (FWHM) of 2D peak for the composite powder is ∼75 cm−1 which is much larger than that of graphite (∼33 cm−1).
In our opinion, the disappearance of the “shoulder” and the wider FWHM of 2D peak are the result of the existence of CNSs in the composite powder. It is noted the 2D peak for graphene (especially less than 5 layers) is more symmetric than that of graphite. The 2D peak also shifts to lower wavenumber with the decrease in layer numbers of few-layer graphene.45 According to TEM results, CNSs are composed of many sheets with thickness mainly less than 20 nm. The 2D peaks of CNSs with less layer numbers appear at lower wavenumber, which overlap with the peaks of CNSs with higher thickness and produce a wider 2D peak. They also cover the “shoulder” of the 2D peaks produced by thicker sheets (which is similar to graphite) in the CNSs. As a result, the “shoulder” of 2D peak of the composite powder almost disappears and its FWHM is wider than that of graphite.
The inset in Fig. 3f is the XPS spectrum of C1s for the composite powder D treated for 72 h, the sample was etched by Ar for 120 s before XPS measurement. The peaks located at 284.5 and 288.9 eV originate from the sp2 C–C and –O–C![[double bond, length as m-dash]](https://www.rsc.org/images/entities/char_e001.gif) O structure, respectively. The higher relative intensity of peak at 284.5 eV suggests that the sp2 C–C structure is well preserved after a long time shear exfoliation. And very small amount of carboxyl group (–O–CO) appeared after 72 hours' mixing. The oxygen-containing groups of the functionalities existed in CNS produced by PASE is about 2%, which is smaller than that of RGO in Cu matrix composite after H2 reducing at 550 °C (12.9%).46
O structure, respectively. The higher relative intensity of peak at 284.5 eV suggests that the sp2 C–C structure is well preserved after a long time shear exfoliation. And very small amount of carboxyl group (–O–CO) appeared after 72 hours' mixing. The oxygen-containing groups of the functionalities existed in CNS produced by PASE is about 2%, which is smaller than that of RGO in Cu matrix composite after H2 reducing at 550 °C (12.9%).46
These results indicate that graphite is successfully exfoliated to CNSs by PASE. The production and the dispersion of CNSs into copper particles are fulfilled in one step. The exfoliation process of graphite can be illustrated in Fig. 4. Firstly, the slurry before treatment is prepared by distributing graphite and copper particles in a solvent, as shown in Fig. 4a. Secondly, the slurry is treated in a rotor–stator mixer (Fig. 4b). The high speed rotation of the rotor sucks materials into the narrow gaps between the precision-engineered stator–rotor assembly, where graphite and copper particles are subjected to mechanical and hydraulic shear. When the rotating speed is 3000 rpm, the line speed of the rotor vs. the stator is ∼5.5 m s−1. As the rotor moves quickly, the slurry is forced to go through the narrow gap (∼100 μm) between the rotor and the stator. During this process, the friction and impact from copper particles, the shear stress and the possible cavitation in solvent act on graphite particles as demonstrated in Fig. 4b. The higher the solvent viscosity, the higher the shear stress of solvent on graphite, that is why the exfoliation effect of 1,3-butanediol is better than those of ethyl alcohol and 1,3-propanediol. The friction, impact and shear stress on graphite help to exfoliate graphite to CNSs. Graphite, CNSs and copper particles can go through the gaps for thousands of times. Thirdly, CNSs can be separated simultaneously by copper particles when they are exfoliated in solvent during PASE, so we not only produce CNSs from graphite but also solve the problem of distributing one nanomaterial into another one. This is the main advantage of PASE different from other methods for the production of the CNS/Cu composite powder. Finally, CNS/Cu composite powder (as shown in Fig. 4d) can be eventually obtained after centrifugation and heating.
 | ||
| Fig. 4 Schematic illustration of PASE process: (a) slurry before mixing treatment; (b) mixing treatment; (c) slurry after mixing treatment; (d) photograph of CNS/Cu composite powder. | ||
We illustrated the potential of this method by using the CNS/Cu composite powders to produce CNS/Cu composites. The composite powders were consolidated by SPS method into CNS/Cu composites which are shown as the inset in Fig. 5a. The volume fraction of CNSs in the composites is 2.5%, assuming that there is no loss of carbon during PASE and SPS processes. The relative densities of CNS/Cu(D)-8 h and CNS/Cu(D)-32 h are 98.5% and 99.3%, respectively, suggesting that the composites are dense. High relative density means less concentration of macro pores or cracks, which is beneficial to improve the mechanical and electrical properties of the composites.
 | ||
| Fig. 5 (a) SEM morphology of the surface of the CNS/Cu(D) composite eroded in 5% HF for 5 minutes, the inset shows the composite produced by SPS method; (b) XRD pattern of CNS/Cu(D) composite, the inset shows the C1s XPS of CNS/Cu(D) composite; (c) fractography micrograph of the CNSs/Cu(D) composite. | ||
SEM of the surface of the CNS/Cu(D) composite eroded in 5% HF for 5 minutes is shown in Fig. 5a. It can be found that many translucent thin sheets (marked by white arrows) distributed randomly in the composite. Because most of the copper on the surface is removed, and the image in Fig. 5a is a superposition image of the CNSs, so it seems that the content of CNS is far more than the actual content.
Fig. 5b shows the XRD spectra of the composites. The intensity of graphite (002) peak at 26.7 degree appears after sintering, which is invisible for composite powder after 8 h treatment (Fig. 2c). The result suggests that some of the thinner CNSs have recovered and become thicker ones during the process of SPS sintering. The little peak of Cu2O (200) plane indicates weak oxidation happens in the composite. The inset in Fig. 5b shows the XPS spectrum of C1s for CNS/Cu(D) composite treated for 32 hours. The peak located at 284.5 eV originates from the sp2 carbon, illustrating that sp2 carbon is the main type of carbon in the composite.
The fractography was shown in Fig. 5c. The sample for the fractography was prepared by breaking a thin sheet (about 0.5 in thickness, 2 in width, 4 in length) with tensile stress. A lot of CNSs were pulled out from the copper matrix. This result implies that plenty of CNSs exist in the composite, which could bear the load from copper matrix and be used to reinforce the copper composite.
High-Angle Annular Dark-Field (HAADF) was used to analyze the structure of the composite. The thin and dark crystal boundaries in Fig. 6a illustrate that materials with lower atomic number exist between the copper grains, as the contrast of HAADF image depends strongly on the average atomic number. The result of HAADF strongly suggests that carbon distributes in the grain boundary of copper, since only copper, carbon and trace of oxide exist in the composite according to XRD result of the composite (Fig. 5b).
 | ||
| Fig. 6 Structure of CNS/Cu(D) composite treated for 32 hours: (a) HAADF image; (b) TEM image; (c) and (d) enlarged images from (b); (e) and (f) HRTRM images of interfaces between carbon and copper. | ||
Fig. 6b shows the TEM of CNS/Cu(D) composite treated for 32 hours, Fig. 6c and d are the enlarged images of the red and green frame areas in Fig. 6b, respectively. Some carbon sheets and particles can be found among copper grains, especially, in triple grain boundary junctions in Fig. 6b–d; the thicknesses of the sheets are less than 10 nm as shown in Fig. 6c–f; the particles existing between grain boundaries are indicated by black arrows as shown in Fig. 6d. The HRTEM of the interface of copper and carbon are shown in Fig. 6e and f, there are no gaps or holes on the interface, indicating that the interface combination of copper and CNS is very good.
According to SEM and TEM observations, two types of CNS exist in the CNS/Cu composite. One is the isolated sheets with the size of several ten micrometers, which can be observed conveniently through SEM, as shown in Fig. 5a. The other is the smaller sheets existing in the copper grain boundary, especially, at the triple grain boundary junction, as shown in Fig. 6, which can only be found through TEM observation.
The compact structure of the interface could contribute to the understanding of the interfacial bonding between CNS and copper. Hwang et al. have measured the adhesion energy between the graphene and Cu prepared by SPS, which is 164 ± 28.47 J m−2, and much greater than the adhesion energy of 0.72 ± 0.07 J m−2 for as-grown graphene on a Cu.34 The origin of enhanced bonding strength between the graphene and metal was explained by the existence of native oxygen on Cu. However, no microstructure information was given in their work. Our work offers the microstructure information of the interface between CNS and copper, which suggests that beside the reason given in the ref. 34 the compact structure of the interface may also contribute to the bonding strength of copper and CNS by mechanic occlude, beside the reason given in ref. 34.
The formation of the close integration interface may be related to the following factors. Firstly, a process of carbon diffusion–precipitation may happen during the process of SPS. Some of the carbon atoms at grain boundaries may diffuse into copper when the grain boundaries reach a higher temperature by the joule heat produced at the contact area during the process of SPS, and then they precipitate during the cooling process of the rapid multiple pulse cycle processes. Secondly, SPS has certainly shown the ability to achieve highly compacted bulk materials,47–49 and the physical factors, such as the pulsed DC current and plasma, may facilitate the formation of the integration interface although the sintering mechanism of SPS has not been clearly understood thus far.50–52
The mechanical properties of the CNS/Cu composite were characterized using compressive tests. The compressive stress–strain curves of the composites and pure copper produced by SPS in the same preparation conditions are shown in Fig. 7a. The error bars were calculated by two specimens for each material. The compressive behaviors of the CNS/Cu(D)-8 h and CNS/Cu(D)-32 h composites are similar, which indicates that 8 h is long enough to peel graphite into CNS.
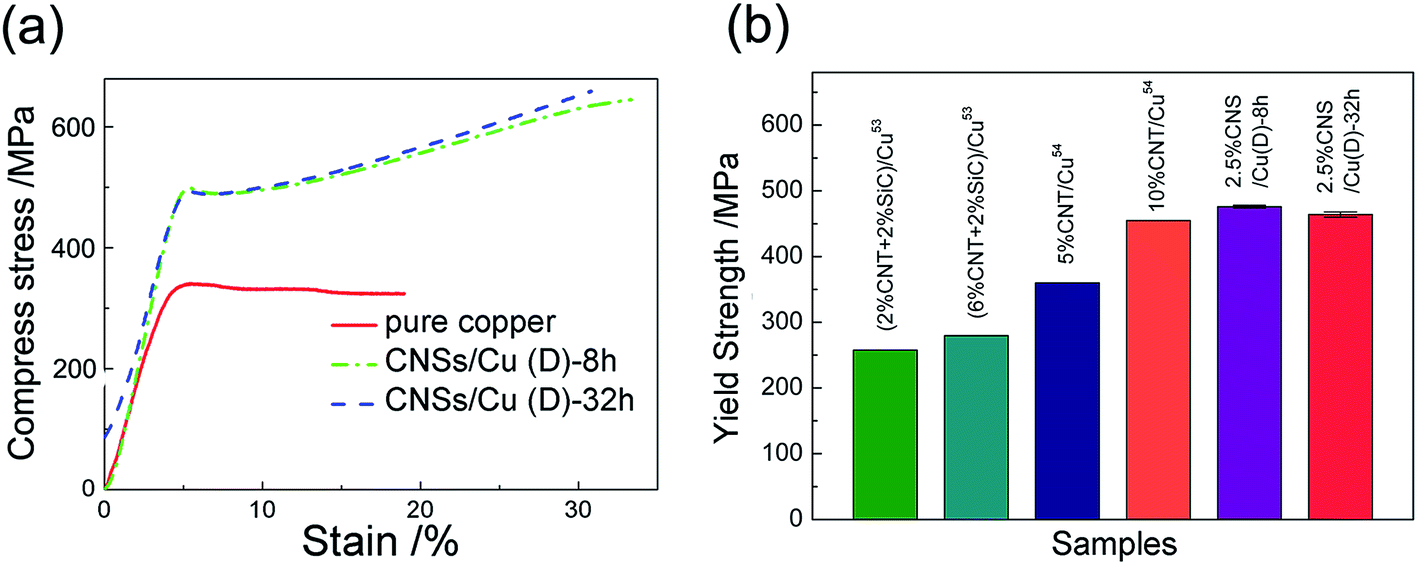 | ||
| Fig. 7 (a) The compressive stress–strain curves of the composites and pure copper produced in the same conditions; (b) comparison of yield strength of CNS/Cu(D) composite with 4 samples in ref. 53 and 54. | ||
It is worth noting that the CNS/Cu composites exhibit excellent mechanical properties. The yield strengths of several different kinds of copper composites are shown in Fig. 7b. It can be found that the yield stress of CNS/Cu(D) (476 MPa) is more than 1.7 times higher than that of pure copper (275 MPa) and also higher than those of copper composites enhanced by hybrided SiC and CNTs.53,54
It is interesting to see that an obvious strain hardening happened after yielding for the composites, while no obvious strain hardening could be found for pure copper (see shown in Fig. 7a). In our opinion, the strain hardening after yielding of the composites may be caused by the following reasons. Firstly, the dislocations produced during yielding process in the copper matrix can be repulsed by the boundary containing CNS when they move to the boundary, the repulsive force is called the image force and produced by the high modulus of CNS in the boundary.55 The repulsive force blocks the dislocation motion. Secondly, when the dislocation pile-up takes place, it can be pinned effectively by the CNS in the grain boundary, as a result of high strength and modulus of the CNS. In addition, the deformation twins may also be restricted by hard CNS and high strength interfacial bounding. As a result, the strain hardening happened after yielding for the composites because of the existence of CNS in the grain boundary.
The strengthening efficiency of reinforcement R is an important parameter used to evaluate the effect of reinforcement in metal matrix, defined as the ratio of the amount of yield strength increase of the composite to the actual yield strength of the matrix.35 R is expressed as
| R = (σc − σm)/Vfσm | (1) |
Four factors may play important roles for the improvement of the compressive strengths of the composites. Firstly, the successful fabrication of CNSs from graphite and the homogeneous distribution of CNSs in the composite guarantee the mechanical properties of the composites. Secondly, fine-grain strengthening may contribute to the strength of the composites according to the Hall–Petch relation, since the grain sizes of the composites are as small as several hundred nanometers. Thirdly, as indicated in ref. 34, the interfacial bonding of CNS and copper would be strong, which contribute to the stress transformation from the matrix to CNSs; so the strong interface benefits the strength of the composites. In addition, due to the high strength and flexibility, CNS can act as both the obstacle for dislocation propagation and the dislocation absorber for preventing dislocation pile-up, which can improve the strength of the composites.
The electrical conductivity values of the composites were measured and expressed as percent IACS. Here, IACS means International Annealed Copper Standard, a unit of electrical conductivity for metals and alloys relative to a standard annealed copper conductor; an IACS value of 100% refers to a conductivity of 58.0 MS m−1 at 20 °C. The conductivity value of CNS/Cu(D)-8 h (81.0% IACS) is higher than that of CNS/Cu(D)-32 h (40.5% IACS), this may be due to the impurities introduced during the longer production process.
Our work demonstrates that the PASE method can be successfully used to produce CNS/Cu composite with excellent mechanical and electrical properties directly from graphite and copper powder. It is reasonable to deduce that the method used in this work is promising to produce many other kinds of composites by choosing numerous other layered crystals (such as h-BN, MoS2, MoSi2, MoSe2 and MoTe2) and matrix particles (including nano or submicro particles such as Ni, Fe, Al, Ti, Pt, Pd, MnO2, Ni2O3, Fe2O3, TiO2, Al2O3, MgO).
Conclusions
CNS/Cu composite powders were produce by PASE from graphite and copper powder. The synthesis of CNSs with lower defect concentration and the dispersion of CNSs into copper particles are achieved simultaneously with 100% use of the starting materials of graphite and copper powder. CNS/Cu composites were produced by SPS with the composite powders. Microstructure study demonstrated that close contact between CNS and copper was formed. High strengthening efficiencies of CNSs, high strength and good electrical conductivity were obtained in the composites. In addition, PASE is promising to produce many kinds of composites by choosing numerous layered crystals and nanomaterials particles.Acknowledgements
The authors gratefully acknowledge the support from the National Basic Research Program of China (no. 2011CB612200), China Scholarship Council (no. 201206125006) and Harbin Key Technologies R&D Programme (2012DB2CP029). Robert Vajtai specially acknowledges funding from the DOD: Air Force Office of Scientific Research for the Project MURI: Synthesis and Characterization of 3D Carbon Nanotube Solid Networks, Award no. FA9550-12-1-0035.References
- K. S. Novoselov, A. K. Geim, S. V. Morozov, D. Jiang, Y. Zhang, S. V. Dubonos, I. V. Grigorieva and A. A. Firsov, Science, 2004, 306, 666–669 CrossRef CAS PubMed.
- S. Stankovich, D. A. Dikin, G. H. B. Dommett, K. M. Kohlhaas, E. J. Zimney, E. A. Stach, R. D. Piner, S. T. Nguyen and R. S. Ruoff, Nature, 2006, 442, 282–286 CrossRef CAS PubMed.
- S. H. Song, K. H. Park, B. H. Kim, Y. W. Choi, G. H. Jun, D. J. Lee, B. S. Kong, K. W. Paik and S. Jeon, Adv. Mater., 2013, 25, 732–737 CrossRef CAS PubMed.
- M. Segal, Nat. Nanotechnol., 2009, 4, 611–613 Search PubMed.
- M. T. Hung, O. Choi, Y. S. Ju and H. T. Hahn, Appl. Phys. Lett., 2006, 89, 023117 CrossRef PubMed.
- X. S. Li, W. W. Cai, L. Colombo and R. S. Ruoff, Nano Lett., 2009, 9, 4268–4272 CrossRef CAS PubMed.
- T. Ohta, A. Bostwick, T. Seyller, K. Horn and E. Rotenberg, Science, 2006, 313, 951–954 CrossRef CAS PubMed.
- C. Virojanadara, M. Syvajarvi, R. Yakimova, L. I. Johansson, A. A. Zakharov and T. Balasubramanian, Phys. Rev. B: Condens. Matter Mater. Phys., 2008, 78, 245403 CrossRef.
- Y. Hernandez, V. Nicolosi, M. Lotya, F. M. Blighe, Z. Y. Sun, S. De, I. T. McGovern, B. Holland, M. Byrne, Y. K. Gun'ko, J. J. Boland, P. Niraj, G. Duesberg, S. Krishnamurthy, R. Goodhue, J. Hutchison, V. Scardaci, A. C. Ferrari and J. N. Coleman, Nat. Nanotechnol., 2008, 3, 563–568 CrossRef CAS PubMed.
- W. S. Hummers and R. E. Offeman, J. Am. Chem. Soc., 1958, 80, 1339 CrossRef CAS.
- D. Li, M. B. Muller, S. Gilje, R. B. Kaner and G. G. Wallace, Nat. Nanotechnol., 2008, 3, 101–105 CrossRef CAS PubMed.
- L. D. Wang and W. D. Fei, Cn. Pat., 201210344115.3, 2012.
- J. Zhao, Y. Guo, Z. Li, Q. Guo, J. Shi, L. Wang and J. Fan, Carbon, 2012, 50, 4939–4944 CrossRef CAS PubMed.
- C.-D. Kim, B.-K. Min and W.-S. Jung, Carbon, 2009, 47, 1610–1612 CrossRef CAS PubMed.
- A. Chakrabarti, J. Lu, J. C. Skrabutenas, T. Xu, Z. Xiao, J. A. Maguire and N. S. Hosmane, J. Mater. Chem., 2011, 21, 9491 RSC.
- P. Kumar, L. S. Panchakarla and C. N. R. Rao, Nanoscale, 2011, 3, 2127–2129 RSC.
- D. V. Kosynkin, A. L. Higginbotham, A. Sinitskii, J. R. Lomeda, A. Dimiev, B. K. Price and J. M. Tour, Nature, 2009, 458, 872–875 CrossRef CAS PubMed.
- P. Kumar, RSC Adv., 2013, 3, 11987–12002 RSC.
- U. Maitra, H. S. S. R. Matte, P. Kumar and C. N. R. Rao, Chimia, 2012, 66, 941–948 CrossRef CAS PubMed.
- P. Kumar, K. S. Subrahmanyam and C. N. R. Rao, Mater. Express, 2011, 1, 252–256 CrossRef CAS PubMed.
- P. Kumar, B. Das, B. Chitara, K. S. Subrahmanyam, K. Gopalakrishnan, S. B. Krupanidhi and C. N. R. Rao, Macromol. Chem. Phys., 2012, 213, 1146–1163 CrossRef CAS.
- A. K. Geim and K. S. Novoselov, Nat. Mater., 2007, 6, 183–191 CrossRef CAS PubMed.
- Z. P. Chen, W. C. Ren, L. B. Gao, B. L. Liu, S. F. Pei and H. M. Cheng, Nat. Mater., 2011, 10, 424–428 CrossRef CAS PubMed.
- M. Y. Yen, C. C. Teng, M. C. Hsiao, P. I. Liu, W. P. Chuang, C. C. M. Ma, C. K. Hsieh, M. C. Tsai and C. H. Tsai, J. Mater. Chem., 2011, 21, 12880–12888 RSC.
- X. Zhao, C. M. Hayner, M. C. Kung and H. H. Kung, Adv. Energy Mater., 2011, 1, 1079–1084 CrossRef CAS.
- Y. M. He, W. J. Chen, X. D. Li, Z. X. Zhang, J. C. Fu, C. H. Zhao and E. Q. Xie, ACS Nano, 2013, 7, 174–182 CrossRef CAS PubMed.
- T. Ramanathan, A. A. Abdala, S. Stankovich, D. A. Dikin, M. Herrera-Alonso, R. D. Piner, D. H. Adamson, H. C. Schniepp, X. Chen, R. S. Ruoff, S. T. Nguyen, I. A. Aksay, R. K. Prud'homme and L. C. Brinson, Nat. Nanotechnol., 2008, 3, 327–331 CrossRef CAS PubMed.
- K. M. F. Shahil and A. A. Balandin, Nano Lett., 2012, 12, 861–867 CrossRef CAS PubMed.
- H. J. Salavagione, G. Martinez and M. A. Gomez, J. Mater. Chem., 2009, 19, 5027–5032 RSC.
- Y. C. Fan, L. J. Wang, J. L. Li, J. Q. Li, S. K. Sun, F. Chen, L. D. Chen and W. Jiang, Carbon, 2010, 48, 1743–1749 CrossRef CAS PubMed.
- L. S. Walker, V. R. Marotto, M. A. Rafiee, N. Koratkar and E. L. Corral, ACS Nano, 2011, 5, 3182–3190 CrossRef CAS PubMed.
- J. Liu, H. X. Yan and K. Jiang, Ceram. Int., 2013, 39, 6215–6221 CrossRef CAS PubMed.
- Y. Kim, J. Lee, M. S. Yeom, J. W. Shin, H. Kim, Y. Cui, J. W. Kysar, J. Hone, Y. Jung, S. Jeon and S. M. Han, Nat. Commun., 2013, 4, 2114 Search PubMed.
- J. Hwang, T. Yoon, S. H. Jin, J. Lee, T. S. Kim, S. H. Hong and S. Jeon, Adv. Mater., 2013, 25, 6724–6729 CrossRef CAS PubMed.
- R. Wengeler and H. Nirschl, J. Colloid Interface Sci., 2007, 306, 262–273 CrossRef CAS PubMed.
- K. R. Paton, E. Varrla, C. Backes, R. J. Smith, U. Khan, A. O'Neill, C. Boland, M. Lotya, O. M. Istrate, P. King, T. Higgins, S. Barwich, P. May, P. Puczkarski, I. Ahmed, M. Moebius, H. Pettersson, E. Long, J. Coelho, S. E. O'Brien, E. K. McGuire, B. M. Sanchez, G. S. Duesberg, N. McEvoy, T. J. Pennycook, C. Downing, A. Crossley, V. Nicolosi and J. N. Coleman, Nat. Mater., 2014, 13, 624–630 CrossRef CAS PubMed.
- D. W. Murphy and G. W. Hull, J. Chem. Phys., 1975, 62, 973 CrossRef CAS PubMed.
- L. D. Wang and W. D. Fei, Cn. Pat., 20101079119.1, 2010.
- J. A. Dean, in Lange's Handbook of Chemistry, McGraw-Hill, Inc., 15th edn, 1998, vol. 5, pp. 92–93 Search PubMed.
- N. J. Rahway, in The Merck Index–Encyclopedia of Chemicals, Drugs and Biologicals, Merck and Co., Inc., 1989, p. 239 Search PubMed.
- A. Eckmann, F. Alexandre, V. Ivan, D. Rebecca and C. Cinzia, Phys. Rev. B: Condens. Matter Mater. Phys., 2013, 88, 035426 CrossRef.
- I. K. Moon, J. Lee, R. S. Ruoff and H. Lee, Nat. Commun., 2010, 1, 73 Search PubMed.
- J. Y. Huang, H. Yasuda and H. Mori, Chem. Phys. Lett., 1999, 303, 130–134 CrossRef CAS.
- R. P. Vidano, D. B. Fischbach, L. J. Willis and T. M. Loehr, Solid State Commun., 1981, 39, 341–344 CrossRef CAS.
- A. C. Ferrari, J. C. Meyer, V. Scardaci, C. Casiraghi, M. Lazzeri, F. Mauri, S. Piscanec, D. Jiang, K. S. Novoselov, S. Roth and A. K. Geim, Phys. Rev. Lett., 2006, 97, 187401–187404 CrossRef CAS.
- L. D. Wang, Y. Cui, R. Y. Li, G. J. Cao, B. Li and W. D. Fei, Acta Metall. Sin., 2014, 27, 924–929 CrossRef.
- M. Kubota, J. Alloys Compd., 2007, 434, 294–297 CrossRef PubMed.
- O. Ohashi, J. Jpn. Weld. Soc., 2000, 69, 91 Search PubMed.
- G. Q. Xie, O. Ohashi, T. Yoshioka, M. H. Song, K. Mitsuishi, H. Yasuda, K. Furuya and T. Noda, Mater. Trans., 2001, 42, 1846–1849 CrossRef CAS.
- M. Omori, Mater. Sci. Eng., A, 2000, 287, 183–188 CrossRef.
- G. Q. Xie, O. Ohashi, K. Chiba, N. Yamaguchi, M. H. Song, K. Furuya and T. Noda, Mater. Sci. Eng., A, 2003, 359, 384–390 CrossRef.
- M. Zadra, F. Casari, L. Girardini and A. Molinari, Powder Metall., 2007, 50, 40–45 CrossRef CAS PubMed.
- M. R. Akbarpour, E. Salahi, F. A. Hesari, A. Simchi and H. S. Kim, Mater. Sci. Eng., A, 2013, 572, 83–90 CrossRef CAS PubMed.
- S. I. Cha, K. T. Kim, S. N. Arshad, C. B. Mo and S. H. Hong, Adv. Mater., 2005, 17, 1377–1381 CrossRef CAS.
- K. F. Ha, in Micro-Theory of Mechanical Properties of Metals, Scientific Press, Beijing, 1982, vol. 2, ch. 12, pp. 91–92 Search PubMed.
| This journal is © The Royal Society of Chemistry 2015 |