Curcumin associated poly(allylamine hydrochloride)-phosphate self-assembled hierarchically ordered nanocapsules: size dependent investigation on release and DPPH scavenging activity of curcumin

Mai Mouslmania, Jessica M. Rosenholmb, Neeraj Prabhakarb, Markus Peurlac, Elias Baydound and Digambara Patra*a
aDepartment of Chemistry, American University of Beirut, Beirut, Lebanon. E-mail: dp03@aub.edu.lb; Fax: +961 1365 217; Tel: +961 1350 000 ext. 3985
bLaboratory for Physical Chemistry, Åbo Akademi University, Turku, Finland
cLaboratory of Electron Microscopy, University of Turku, Turku, Finland
dDepartment of Biology, American University of Beirut, Beirut, Lebanon

Received 21st October 2014 , Accepted 9th February 2015

First published on 9th February 2015


Abstract

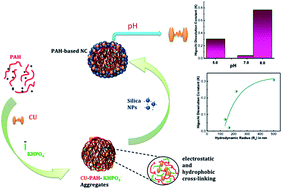
Combination of a cationic polyamine with a multivalent anionic salt results in the spontaneous generation of ionically crosslinked capsules. Here we report curcumin associated poly(allylamine hydrochloride) crosslinks with dipotassium phosphate and subsequently congregates with silica nanoparticles to form hierarchically ordered nanocapsule structures. The capsule sizes vary depending on the concentration of dipotassium phosphate. SEM data ascertain the spherical shape of the nanocapsules and TEM analysis demonstrates that the outer layer made up of silica has a thickness of ∼50–250 nm. The fluorescence images confirm that curcumin are present all over the capsules. Strong interaction between nanocapsules and curcumin is evident from spectroscopic analysis and TGA data. Release of curcumin from the nanocapsules is found to be triggered by pH where basic environment trigger the maximum release compared to acidic and neutral conditions. The drug release profile of curcumin from the nanocapsules follows the Higuchi model and depends on the size of the nanocapsules. 2,2-Diphenyl-1-picrylhydrazyl (DPPH) scavenging activity of the encapsulated curcumin decreases exponentially with a decrease in size of the nanocapsules, suggesting not only weight percentage of curcumin in the nanocapsules plays a role but also availability of β-diketone group of curcumin for H-donation is vital. Thus, in larger nanocapsules more curcumin per surface area of the nanocapsules are exposed on the outside for scavenging activity, compared to smaller sized nanocapsules where a substantial percentage of curcumin are buried/encapsulated inside the capsules without exposing themselves for scavenging activity.


1. Introduction

At present, material chemists widely use hard and soft-templating synthesis methods for capsule structure preparations. However, drawbacks related to long synthetic steps and high cost, have limited their use in practical applications.1 To solve these difficulties, a relatively new concept of capsule formation via polyamine-salt aggregate or ‘PSA’ has been developed.2,3 This technique was originally termed as ‘tandem self-assembly’ (see Fig. 1). It involves combination of a cationic polyamine with a multivalent anionic salt, resulting in the spontaneous generation of ionically crosslinked PSAs.4,5 The capsule is formed through further addition of negatively charged shell material on PSAs that serves as the capsule template.6,7 For further use, the polyamine-salt template can remain in the capsule's core; however, after shell formation it can spontaneously disassemble, depending on polymer and salt types, leaving a capsule with a water filled core. As the polymer part participates in shell formation and is a main shell constituent, the PSA is not strictly a soft or hard templating method.8
image file: c4ra12831a-f1.tif
Fig. 1 Illustration of CU interacting with PAH, dipotassium phosphate and SiO2 NPs to form NCs.

Curcumin, bis(4-hydroxy-3-methoxyphenyl)-1,6-diene-3,5-dione,9 is a natural diphenolic yellow orange pigment extracted from the dried rhizome of turmeric Curcuma longa, a perennial herb that is widely cultivated in southeast and south tropical Asia.10 Chemically curcumin (CU) is a β-diketone that tautomerizes between its enol and keto structures (see Scheme 1). The diketo form is favoured in solid phase of CU, while enol form in solution.11 CU is a major component of curry spice, and it is extensively used in traditional Arabic and Indian cooking. For industrial applications, CU is used as a dye for the conservation and colouring of food, as well in cosmetics. Concerning its therapeutic efficiency, CU has been applied as a house-hold drug since the ancient times,12,13 where its anti-inflammatory and healing properties are even reported in the books of ayurveda. In the last 20 years, a large number of publications have shown that CU depicts effective therapeutic properties not only as an anti-inflammatory drug,14 but also as a chemo-preventive,15,16 chemotherapeutic,17,18 anti-oxidant,15,19 antiamyloid,20 antiarthritic,21 anti-HIV,22 hepatoprotective,20 antimicrobial23,24 and thrombosuppressive25 agent. In addition, CU is being used in the treatment of cystic fibrosis26 and Alzheimer disease.27 Research over the last few decades has proven that CU owes a strong therapeutic potential against numerous types of cancer. CU has been shown to inhibit the proliferation, metastasis and transformation of tumours; where it has been demonstrated that it arrests the cancer cells in various phases of the cell cycle and induces apoptosis (programmed cell death).10


image file: c4ra12831a-s1.tif
Scheme 1 Chemical structures of curcumin tautomers.

Although CU has numerous medicinal benefits with high safety profiles, even at doses as high as 8 g per day, the administration of CU to patients has a serious practical limitation.28 Wahlstrom et al.29 reported that when rats were administrated CU at a dose 1 g kg−1, about 3/4th of CU was excreted in the feces, whereas negligible amounts of CU were present in the urine. Blood plasma levels and biliary excretions measurements showed that CU is poorly absorbed in the gut; moreover, the CU's quantity that reaches tissues outside the gut is pharmacologically insignificant. Hence, to reach the therapeutic effects of CU in the human body, a person must ingest between 12 to 20 g of CU daily.30 The low bioavailability and poor water solubility (i.e. 0.0004 mg mL−1 at pH 7.3) of CU can be solved by applying nanotechnological delivery approaches.31 CU has been encapsulated in bovine serum albumin, chitosan,32 liposomes,33 polymeric nanoparticles and silica particles.34–39 It has also been complexed with phospholipids and cyclodextrin.33 The synthesis of curcumin-encapsulated polymeric nanoparticles of N-isopropylacrylamide with N-vinyl-2-pyrrolidone and poly(ethyleneglycol)monoacrylate has recently been reported.30 CU has been encapsulated in poly(L-lysine) termed as Micro-curcumin.40 The later approach is based on polymer block self-assembly on the surfaces of nanoparticles using citrate salt. The formed microcapsules are spherical with a core/shell structure.41,42 Zhang et al.43 have recently adopted this procedure2,40–42 by replacing poly(L-lysine) with poly(allylamine hydrochloride) and using two fluorescence markers for pH sensing.43 These capsules are hollow and large. We have also found that excited state intra-molecular hydrogen transfer could be revoked depending on the size of the nanocapsules using (allylamine hydrochloride) (PAH).44 In the present study, we prepared and investigated PAH nanocapsules for the release of curcumin in different pH. The aim is to encapsulate CU in PAH (see Scheme 2) based nanocapsules; where CU associated PAH crosslink with dipotassium phosphate and consequently congregates SiO2 nanoparticles to form hierarchically ordered nanocapsule (NC) structures of 100–1000 nm size depending on the concentration of dipotassium phosphate. The advantages of the present method are: (i) the ease of preparation and purification of the nanocapsules; (ii) unlike earlier delivery systems with silica particles, the formation of template is in situ, hence no need for a performed template and polymerization/hydrolysis under acidic condition; (iii) finally, it is fast and doesn't require long hours of preparation steps.


image file: c4ra12831a-s2.tif
Scheme 2 Chemical structure of poly(allylamine hydrochloride) (PAH).

2. Materials and methods

2.1 Materials

CU was obtained from Acros Organics and directly used without further purification. CU is poorly soluble in water and degrades in aqueous medium, so the stock solution of CU was prepared in 10% acetone/de-ionized water. Poly(allylamine hydrochloride) and Silica LUDOX® HS-40 Colloidal Silica, 40 wt% suspension in water, were obtained from Sigma-Aldrich. PAH stock solution was prepared in de-ionized water of pH 4.4 to ensure the formation of PAH–dipotassium phosphate aggregates. Dipotassium phosphate used was obtained from SOLAR LABORATORIES and its stock solution was prepared in de-ionized water.

2.2 Preparation of nanocapsules

Nanocapsules were prepared by mixing 1.3 mL of 3 mg mL−1 poly(allylamine hydrochloride), PAH (pKa = 8.6), with 0.5 mL of 1 mg per mL of CU. Then, self-assembly of the mixture solution was achieved by cross-linking the CU–PAH chains with 7.8 mL of 2.5 mM dipotassium phosphate in aqueous media at pH 4.4 and aged for 30 minutes. Afterwards, 7.8 mL of 40 wt% suspension of silica nanoparticles (SiO2 NPs) at pH ∼9.8 was added to this aggregated solution. The cloudy solution was kept for 2 hours, and then centrifuged at a speed of 4450 rpm for 20 minutes. The NCs formed were washed 3 times in de-ionized water. For preparation of different size nanocapsules, concentration of dipotassium phosphate was varied accordingly, for example, 3.14 mM of dipotassium phosphate used for NC1; 1.8 mM for NC2; 960 μM for NC3 and 10 μM for NC4.

2.3 Morphological characterization

Scanning electron microscopy (SEM) analysis was done using Tescan, Vega 3 LMU with Oxford Edx detector (Inca XmaW20) SEM, where 3 mg of the NC were dissolved in 5 mL of de-ionized water, and few drops of the nanocapsule suspension were mounted on an aluminium stub, coated with carbon adhesive. After being dried the sample was ready for the SEM analyses. Transmission electron microscopy (TEM) measurement was carried out with a JEOL JEM-1400Plus, operating at 120 kV. TEM samples were prepared by casting a drop of the nanoparticle suspension onto copper grids covered with carbon films. The fluorescence image was recorded using a high sensitive STED confocal set up consisted of confocal microscope (Leica TCS SP5 STED, Leica Microsystem), an Argon laser with 430 nm excitation wavelength and APD detector. CU was excited by a wavelength of 430 nm and emission was collected using a band filter in the range of 460–600 nm. The particle size distribution was analyzed using DLS (Brookhaven Instruments Corps) technique; with a laser source of 658 nm and a PMT detector (HAMAMATSU, HC120-30). The software used was 90Plus Particle Sizing Software Ver. 5.23 and the dust was set at 40.

2.4 Spectroscopic measurements

The absorption spectra were recorded using a JASCOV-570 UV-VIS-NIR Spectrophotometer at room temperature. The steady-state fluorescence spectra (excitation and emission) were recorded at room temperature using Jobin–Yvon–Horiba Fluorolog III fluorometer and the FluorEssence program where the excitation and emission slits width were 5 nm. The source of excitation was a 100 W xenon lamp, and the used detector was R-928 operating at a voltage of 950 V. FT-IR-Raman spectrometer (Thermo-Nicolet, Nexus 870) was used to record the Raman spectra in the range of 4000 to 400 cm−1.

2.5 Other measurements

The apparent zeta potential was measured using a Malvern Zetasizer Nano ZS (M3-PALS) using the Non-Invasive Back Scatter technique. The instrument was equipped with a monochromatic red laser operating at 632.8 nm and the data were analyzed with the Malvern Dispersion technology software. Z-average values for three measurements were recorded. The Thermogravimetric Analysis (TGA) and Differential Scanning Calorimetry (DSC) measurements were done using a Netzsch TGA 209 in the temperature range 0 to 800 °C with an increment of 30 K per 10 minutes in a N2 atmosphere.

2.6 Measurement of curcumin release

The nanocapsules were dissolved in 3 mL of the desired pH solution (5, 7 or 8) and aged for a given interval of time before centrifugation. The samples were centrifuged for 20 minutes at 4450 rpm. The precipitate was left and the solution was collected to measure the absorbance of CU for quantification.

2.7 Testing biological activity of curcumin

The 2,2-diphenyl-1-picrylhydrazyl (DPPH) (see Scheme 3) scavenging activity of curcumin could be simply measured by following the change in absorbance of DPPH at 520 nm and biological activity of curcumin embedded in the nanocapsules can be understood. Therefore, we adopted a similar procedure reported earlier45,46 where curcumin samples were mixed with DPPH in the double distilled de-ionized water. The concentration of DPPH was kept constant through out the experiment. The changes in absorption of DPPH at 520 nm were recorded at room temperature. Lower in change in the absorbance (ΔA) at 520 nm refers to higher DPPH scavenging activity. Similarly, higher value of 1/ΔA indicates higher scavenging activity.
image file: c4ra12831a-s3.tif
Scheme 3 The proposed 2,2-diphenyl-1-picrylhydrazyl (DPPH) scavenging mechanism of curcumin.45

3. Results and discussion

Nanocapsules were prepared by mixing poly(allylamine hydrochloride), (pKa = 8.6), with CU. The interaction of CU with PAH was found to be strong due to electrostatic as well as hydrophobic interaction between them; it has been reported that such interactions play a crucial role in the encapsulation chemistry.2,41 Then, self-assembly of the mixture solution was achieved by cross-linking the CU–PAH chains with dipotassium phosphate in aqueous media at pH 4.4. It is worth to mention that the ionic-crosslinking of polyamines by anionic salts occurs when both have their respective charge, where the latter depends on the pKa values of the salt and polymer.2 Therefore, a pH of 4.4 maintains the positive and negative charge of PAH (pKa = 8.6) and dipotassium phosphate (pKa1 = 2.15, pKa2 = 6.82 and pKa3 = 12.38) respectively. Afterwards, silica nanoparticles (SiO2 NPs) at pH ∼9.8 was added to this aggregated solution. It should be noted that the pH of the colloidal solution increased to 9.5 while adding silica solution. In this course, it has been reported2 that the capsule shell formation depends on the isoelectric point (IEP) of the nanoparticle (NP) material, where it determines if the NPs will be negatively charged at the pH of the final solution of the polyamine/salt-NP mixture. Before depositing within the shell region, the shell material diffuses through the outer portion of the polyamine/salt aggregate via charge interaction with the positively charged polyamine. Herein, the final pH (9.5) of our capsule mixture ensures the diffusion and deposition of silica NPs (IEP ∼ 3.5) on the surface of PAH–dipotassium phosphate aggregates. Due to their overall net positive charge, these aggregates of CU–PAH–dipotassium phosphate could assist the assembly of negatively charged silica nanoparticles, which then shape into hierarchically ordered nanocapsule structures41 as illustrated in Fig. 1.

The SEM images depicted in Fig. 2a and b, show that the NCs are spherical. The SEM image of the CU–PAH–dipotassium phosphate mixture, before silica nanoparticles were added suggests that smaller size spherical aggregates are formed before the silica nanoparticles are added.44 The particle size distribution of the nanocapsules was analyzed by a dynamic light scattering (DLS) method, and was found to have an effective hydrodynamic radius (Rh) of 480 nm for 2.5 mM of dipotassium phosphate. The TEM image, Fig. 3a and b of NCs confirms that the silica particles are at the surface. The thickness of the silica layer was about 50–250 nm. The fluorescence image, Fig. 3c and e, indicates that the fluorescence is originating from all over the capsules, suggesting that CU is homogeneously distributed throughout the capsules. The 3D orientation of Fig. 3b (after rotating 180 degrees) is shown in Fig. 3c, which further confirms fluorescence is coming from all over the sphere (nanocapsules) rather from one side of the sphere, thus, curcumin is located all around the spherical nanocapsules. The fluorescence of curcumin was further established by fluorescence spectroscopic measurements as reported earlier.44


image file: c4ra12831a-f2.tif
Fig. 2 SEM images of NCs; (a) 10 μm resolution (b) 5 μm resolution.

image file: c4ra12831a-f3.tif
Fig. 3 (a and b) TEM image of nanocapsules, NC1, scale bar is 500 nm for (a) and 20 nm for (b); (c and e) confocal fluorescence microscope images of curcumin encapsulated microcapsules; (d) 3D orientation of the image of aggregated NCs in (c).

PAH has a strong binding affinity with curcumin, which was confirmed by the high value of their association constant (K = 1.44 × 10⁴ M−1). The latter was found by measuring the fluorescence emission spectra of CU at constant concentration (3.33 × 10⁻³ mg mL−1) with various PAH (polymer) concentration from 0 to 3 mg mL−1; where the excitation wavelength was 350 nm. The association constant was calculated using the following equation:47

image file: c4ra12831a-t1.tif
where K and n are the binding constant and the number of binding sites, respectively. F and F0 are the fluorescence intensity of curcumin at 450 nm in the presence and absence of PAH. Based on the later equation the plot of [PAH] vs. (FF0)/F0 (Fig. 4a) demonstrated an excellent linear relationship with linear regression R2 = 0.99424, n = 0.91 and K = 1.44 × 10⁴ M−1. This value is similar to association constant obtained for curcumin with albumin.48


image file: c4ra12831a-f4.tif
Fig. 4 (a) Plot of [PAH] vs. (FF0)/F0. The concentration of curcumin was fixed at 9.0 μM whereas the concentration of PAH ranged between 0 and 3 mg mL−1. F and F0 are the fluorescence intensities of CU in the presence and absence of PAH respectively. The excitation wavelength was 355 nm and the emission wavelength was 440 nm. (b) Apparent zeta potential distribution of nanocapsules.

The apparent zeta potential provides information related to the effective (net) surface charge. Curcumin is known to be found in enolic form in solution. The zeta potential measurement of curcumin in double distilled deionized water (pH 7) showed a value close to −40 mV whereas that of silica NPs used in this study was found to be −37 mV in water. Zeta potential distribution of PAH in water gave a value of +7 mV. When we measure the zeta potential of PAH and curcumin mixture, this value was found to be +47 mV. This value suggests that interaction of PAH and curcumin is electrostatic and association of curcumin with PAH increases the positive surface charge. This latter increase in surface charge can be explained by the interaction of N+ of PAH and enol oxygen of curcumin, as also confirmed by the FT-IR spectra later on. On the other hand, when PAH was mixed with K2HPO4 in the same ratio as the experimental conditions used for synthesizing nanocapsules, this value was close to zero. This value did not change appreciably for the mixture of K2HPO4 and PAH in the presence of curcumin with a zeta potential value close to 0 mV. However, when silica was added and the nanocapsules were formed, the apparent zeta potential value was found to be −38 mV (see Fig. 4b). This means that our synthesized nanocapsules is similar to that of the pristine silica particles.

The hydrodynamic diameter size distribution was found to be 0.2–1 μm. Increasing the concentration of dipotassium phosphate to 5 mM increased the Rh value to 610 nm. As depicted in Fig. 5a and b, 3.14 mM of dipotassium phosphate gave a Rh value of 500 nm (designated as NC1); similarly, decreasing the salt concentration to 1.8 mM had a Rh value of 218 nm (designated as NC2). 960 μM and 10 μM of dipotassium phosphate produced with Rh of 164 nm (designated as NC3) and 133 nm (designated as NC4), respectively. However, the SEM images show that the NCs were found to be much smaller (Rh = ∼60 nm) at the low salt concentration. The high effective hydrodynamic radius is due to the further aggregation of smaller size NCs in solution. The initial size of the core depends on the number of PAH chains that are ionically crosslinked by dipotassium phosphate. This, in turn, is dependent on the amount of salt added.2,43 At low salt concentrations, fewer counter-ions are displaced still keeping PAH rigid with fewer sites to crosslink with other chains. The increase in the concentration of dipotassium phosphate increases the negative charges of the salt per positive charge of PAH, which encourages the formation of larger aggregates, thus, increasing the size of the core as well as the hydrodynamic radius of the NC.2,44 Such an aggregation was also noticed when NCs were prepared in solution and dried on a carbon adhesive before recording the SEM images. The aggregated form of NCs were also noticed in the fluorescence images (Fig. 3c). The absorption spectrum of NCs were found to be similar to that of CU (see Fig. S1(a)), however, the S0 → S2 transition of CU at ∼266 nm was not well resolved in NC. The absorption spectra of NCs did not change in the spectral shape and position for various sizes, however, the change in absorbance could be linked with the amount of curcumin present in the capsules, which was estimated using TGA data as discussed subsequently.


image file: c4ra12831a-f5.tif
Fig. 5 Characterization of different nanocapsules based on change in salt concentration (a), hydrodynamic radius (b), SFS maximum (c) and (d) Resonance Rayleigh scattering spectra were measured in synchronous fluorescence spectroscopic (SFS) mode with a Δλ = 0 nm, thus, λSFS (max) and SFS intensity correspond to RRS maximum and RRS intensity respectively. NC1, NC2, NC3 and NC4 represent nanocapsules (NCs) with Rh values of 500 nm, 218 nm, 164 nm and 133 nm, respectively. CU: curcumin in double distilled water.

Nanoparticles often possess novel physical and chemical properties. Resonance Rayleigh Scattering (RRS) or surface Plasmon resonance (SPR) are widely used in the field of probes and sensors.49 The principles behind these phenomena is elastic scattering.50 RRS is produced when the wavelength of Rayleigh scattering is located at or close to the molecular absorption band. When the analyte interacts with the probe, the intensity of RRS is greatly increased. This is a simple technique and has been used for nanoparticles earlier.51 RRS can be measured by applying synchronous fluorescence spectroscopy (SFS) by keeping the wavelength interval (Δλ) at 0 nm. The SFS spectra of CU and NCs are shown in Fig. S1(b). CU gave a major and broad peak at around ∼550 nm along with small peaks at ∼280 nm, ∼370 nm and ∼450 nm in the resonance Rayleigh scattering spectrum. Interestingly, the small peak at ∼288 nm got remarkably enhanced in the NCs (>10 times). The maximum at ∼288 nm obtained for NC1 was blue shifted to ∼277 nm for the smallest sized nanocapsules, NC4 (Rh = ∼60 nm) but this change in SFS maximum was not remarkable among nanocapsules but was appreciable compared to curcumin alone (see Fig. 5c). Subsequently, increase in the size of the NCs reduced the fluorescence intensity marginally by slightly showing a red shift in the maximum (see Fig. 5d). Noticeably, the peak at ∼370 nm in CU was completely abolished NCs and the CU peak at ∼550 nm was well resolved in all the NCs. The enhancement of RRS intensity at ∼288 nm is due to formation of nanocapsules which increases the scattering intensity.

TGA data of raw curcumin indicated that the weight-loss occurs around 260 °C and continues till 550 °C. DSC curve gave a major peak at around 500 °C. However, in the case of nanocapsules, the weight-loss started much earlier at around 120 °C and continued to 550 °C. The early weight loss is due to presence of PAH in the nanocapsules as depicted in Fig. 6a. Similarly, in DSC curve a sharp peak appeared at 300 °C and the peak at 500 °C found in raw curcumin was found as hump. TGA was further used to estimate percentage of curcumin present in these capsules as shown in Fig. 6b. It was found that nanocapsules having the largest size had the highest percentage of curcumin, about 7%, whereas the rest of the capsules showed about 4% mass loss during thermal degradation that could be related to combustion of CU. However, the concentration of curcumin measured from spectrophotometric measurements gave 6% of CU in NC1, 3% for NC2, NC3 and NC4. The ∼1% difference in values obtained from both the measurements could be due to degradation of other organic materials along with curcumin and/or due to difference in methodology. Nevertheless, the trend was similar in both the methods and such minor difference in curcumin estimation does not play any significant role during its release.


image file: c4ra12831a-f6.tif
Fig. 6 (a) Thermogravimetric analysis of nanocapsule. TG: thermogravimetric; DSC: differential scanning calorimetry; DDSC: derivative of differential scanning calorimetry. (b) Comparison of thermogravimetric analysis of different nanocapsules. NC1, NC2, NC3 and NC4 represent nanocapsules (NCs) with Rh values of 500 nm, 218 nm, 164 nm and 133 nm, respectively.

As shown in Fig. S2, the observed Raman shift of curcumin at around 3200 cm−1 might be due to an OH band, which is reported to appear at 3545 cm−1 in CCl3 and this band downshifted strongly to 3374 cm−1 in acetonitrile.52 Since aqueous environment heightens the possibilities of hydrogen bonding between curcumin and water (solvent) molecules much more than acetonitrile (solvent), the downshift of OH band is much more expected, thus our observation of 3200 cm−1 in Raman spectra for curcumin in water is not surprising. However, we did not find this peak in the nanocapsules. The obtained Raman spectra at around 3060 and 3010 cm−1 for curcumin are assigned to aromatic C–Hstretching. These peaks were noticed in nanocapsules. PAH gave a strong Raman spectrum at around 2930 cm−1 which is assigned to strong aliphatic CH band, this band is also found in the nanocapsules. Absence of peaks in the region of 1650–1800 cm−1 in Raman spectra of curcumin further suggest that curcumin largely exists in enol form rather than keto form, hence, corroborating earlier findings. The band at 1630 cm−1 is due to phenolic OH group. These peaks were predominantly present in the nanocapsules. However, the Raman shift at 1626 cm−1 is due to νC[double bond, length as m-dash]C and νC[double bond, length as m-dash]O of curcumin, which is the same as reported experimental value and close to computed values 1630 cm−1 and 1615 cm−1 respectively.52 The band at 1601 cm−1 and 1492 cm−1 is due to aromatic vibration νC[double bond, length as m-dash]C ring of curcumin. The δCH3 band at 1456 cm−1, δPhCCHOH enol band at 1314 cm−1 and the band at 1247 cm−1 are due to δCOH enol of curcumin and were present in nanocapsules' spectra. Earlier44 it is found from FT-IR spectral data that the phenolic O–H vibration of CU was observed at ∼3509 cm−1 and 3400 cm−1 whereas the peaks found in the range 3392–3033 cm−1 in PAH is associated with the N–H stretch. All these prominent peaks in the control samples were not visible in NCs instead of a major peak found at 3448 cm−1. Similarly the peak at 2972 cm−1 due to enolic O–H vibration could be detected in CU, but was not clear in NCs. Further, the control peaks at 1627 cm−1 and 1603 cm−1 for CU are associated with the C[double bond, length as m-dash]O and C[double bond, length as m-dash]C vibrations. C[double bond, length as m-dash]O vibration has another peak at 1510 cm−1. On the other hand for PAH, the peaks at 1608 cm−1 and 1457 cm−1 are associated with the N–H asymmetric bending and C–H bending. In NCs in these regions only a prominent peak was obtained at 1636 cm−1 confirming a strong involvement –NH2 of PAH and enol form of CU inside the NCs.

The release of drug from the NCs is very important for their application as drug delivery vehicles. Delivery of curcumin in different environments was investigated by changing the pH of the solution and the degree of CU release from the nanocapsules was estimated by absorption spectrophotometry. It was found that the CU was released from the nanocapsules in acidic (pH = 5.0), basic (pH = 8.0) and neutral (pH = 7.0) conditions as shown in Fig. 7a. However, release of CU was triggered faster in basic environment than acidic (∼42% relative to basic environment) and neutral (∼20% relative to basic environment).


image file: c4ra12831a-f7.tif
Fig. 7 (a) Release of curcumin measured in absorbance scale from NC1 in different pH condition. Data were fitted with Higuchi model53 for drug release. (b) Comparison of Higuchi dissolution constant in different pH.

Furthermore, it was found that there is a linear relationship between the amounts of CU released vs. time studied. An equation was proposed by Higuchi53 where the rate of drug release is related to physical constants based on simple diffusion laws as R = KHt1/2 where R is the amount of drug released, KH is the Higuchi dissolution constant and t is the time. We applied the equation for CU release from NC1 in different pH environments (see Fig. 7b) and as expected Higuchi dissolution constant (KH) was found to be 2.5 times higher in basic environment compared to in acidic medium and 8 times higher compared to neutral condition. Many studies have suggested that cancerous cells are acidic; therefore, the release of CU was studied for different nanocapsules in acidic environment (see Fig. 8a). Moreover, it was found that the Higuchi dissolution constant is related to the particle size, where it increases exponentially with the increase in the NCs hydrodynamic radius (Rh) (see Fig. 8b).


image file: c4ra12831a-f8.tif
Fig. 8 (a) Release of curcumin measured in absorbance scale from different nanocapsules in pH 5.0. Data were fitted with Higuchi model53 for drug release. (b) Higuchi dissolution constant (KH) versus particle size. NC1, NC2, NC3 and NC4 represent nanocapsules (NCs) with Rh values of 500 nm, 218 nm, 164 nm and 133 nm, respectively.

Apart from drug delivery, biological activity of the drug molecule within the delivery system has immense importance. Fig. 9 gives the values of absorbance of DPPH at 520 nm in the presence of 0.5 mg mL−1 curcumin and for different nanocapsules under investigation. The low absorbance change of DPPH in the presence of curcumin suggests a strong scavenging ability of curcumin which is attributed to the donation of H from the β-diketone group of curcumin to DPPH.45 DPPH radical scavenging mechanism is depicted in Scheme 3.46 However, the change in absorbance increased 17 fold for the largest nanocapsules under study compared to the same amount of curcumin. This low value is not surprising, as curcumin content in these microcapsules (NC1) is about 6 or 7%, therefore, a 15 fold decrease in DPPH scavenging activity is expected as per percentage of availability of curcumin over total weight of the nanocapsules. The further 2 fold decreases could be due to decrease in H-donation ability from the β-diketone group of curcumin to DPPH because of interaction between PAH/silica nanoparticles and curcumin. When the DPPH scavenging activity was compared with other smaller sized nanocapsules, the scavenging activity decreased exponentially with the size of the capsules, as shown in plot of 1/ΔA vs. Rh in Fig. 9b. Although based on weight percentage, it was expected to have similar scavenging activity for three other smaller size capsules, which is about 2 fold lower than that of NC1; the exponential reduction indicates that not only the weight percentage of curcumin in the nanocapsules plays a role, but also the availability of β-diketone group of curcumin for H-donation is important. As the size of the nanocapsules are larger, more curcumin per surface area of the nanocapsules are exposed outside for scavenging activity compared to small size nanocapsules where a substantial percentage of curcumin are buried/encapsulated inside the capsules without exposing themselves for scavenging activity.


image file: c4ra12831a-f9.tif
Fig. 9 (a) Change in DPPH absorption at 520 nm in the presence of curcumin and nanocapsules of different sizes in de-ionized water at room temperature. The concentration of curcumin and nanocapsules was fixed at 0.5 mg mL−1 and that of DPPH at 100 μM. (b) 1/ΔA of DPPH at 520 nm vs. Rh of nanocapsules indicating exponential increase in DDPH scavenging activity of CU. NC1, NC2, NC3 and NC4 represent nanocapsules (NCs) with Rh values of 500 nm, 218 nm, 164 nm and 133 nm, respectively. CU: curcumin.

4. Conclusion

In summary, the interaction of silica nanoparticles with CU–PAH–dipotassium phosphate aggregates to produce spherical nanocapsules of sizes ranging between 100 and 1000 nm. The size of the capsule is controlled by the concentration of dipotassium phosphate where the plot of the hydrodynamic radius with different salt concentrations has showed an excellent linear relationship. Silica nanoparticles are concentrated at the peripheries whereas curcumin is distributed all over the capsule. The high value of the binding constant (K = 1.44 × 10⁴ M−1) for CU and PAH proves the strong interaction between these constructs. The nanocapsules are negatively charged. The percentage of CU for the largest NCs is 7% while its 4% for smaller capsules. In the capsule, CU is found in its enol form. The delivery of CU from the NCs is favoured under basic conditions. Moreover, the drug release profile fits the Higuchi model. The DPPH scavenging activity of CU is decreased in the capsule. The reduction in the scavenging activity is related to the percentage by weight of CU in the capsule and the availability of the β-diketone group for H-donation. Thus, larger sized nanocapsules have more curcumin per surface area of the nanocapsules, which are exposed outside for scavenging activity compared to small sized nanocapsules where a substantial percentage of curcumin are buried/encapsulated inside the capsules without exposing themselves for scavenging activity.

Acknowledgements

We appreciate the help of Tina Gulin (for TGA) and Didem Sen Karaman (for TGA) during our measurements. Financial support provided by Lebanese National Council of Scientific Research (NCSR), Lebanon and American University of Beirut, Lebanon through URB and Long-term development grants (DP) as well as Kamal A. Shair Central Research Laboratory (KAS CRSL) facilities to carry out this work is greatly acknowledged.

References

  1. H. C. Zeng, J. Mater. Chem., 2006, 16, 649 RSC.
  2. R. K. Rana, V. S. Murthy, J. Yu and M. S. Wong, Adv. Mater., 2005, 17, 1145 CrossRef CAS.
  3. G. C. Kini, S. L. Biswal and M. S. Wong, Non-Layer-by-Layer Assembly and Encapsulation Uses of Nanoparticle-Shelled Hollow Spheres, in Modern Techniques for Nano-and Microreactors/-reactions, Springer, Berlin, Heidelberg, 2010, pp. 89–114 Search PubMed.
  4. V. S. Murthy, R. K. Rana and M. S. Wong, J. Phys. Chem. B, 2006, 110, 25619 CrossRef CAS PubMed.
  5. G. C. Kini, J. Lai, M. S. Wong and S. L. Biswal, Langmuir, 2010, 26, 6650 CrossRef CAS PubMed.
  6. J. Yu, V. S. Murthy, R. K. Rana and M. S. Wong, Chem. Commun., 2006, 10, 1097 RSC.
  7. H. G. Bagaria, M. R. Dean, C. A. Nichol and M. S. Wong, J. Chem. Educ., 2011, 88, 609 CrossRef CAS.
  8. H. G. Bagaria and M. S. Wong, J. Mater. Chem., 2011, 21, 9454 RSC.
  9. L. Nardo, A. Andreoni, M. Bondani, M. Másson and H. Hjorth Tønnesen, J. Photochem. Photobiol., B, 2009, 97, 77 CrossRef CAS PubMed.
  10. S. Shishodia, M. M. Chaturvedi and B. B. Aggarwal, Curr. Probl. Canc., 2007, 31, 243 CrossRef PubMed.
  11. D. Patra and C. Barakat, Spectrochim. Acta, Part A, 2011, 79, 1823 CrossRef CAS PubMed.
  12. R. N. Chopra, I. C. Chopra, K. L. Honada and L. D. Kapur, Indigenous Drugs of India, Duhr, Calcutta, 2nd edn, 1958 Search PubMed.
  13. A. Krishnamoorthy, The Wealth of India: A Dictionary of Indian Raw Materials and Industrial Products, CSIR, New Delhi, 1950, vol. 2, p. 402 Search PubMed.
  14. J. T. Mague, W. L. Alworth and F. L. Payton, Acta Crystallogr., Sect. C: Cryst. Struct. Commun., 2004, 60, 608 Search PubMed.
  15. A. Khafif, S. P. Schantz, T. C. Chou, D. Edelstein and P. G. Sacks, Carcinogenesis, 1998, 19, 419 CrossRef CAS PubMed.
  16. M. T. Huang, R. C. Smart, C. Q. Wong and A. H. Conney, Cancer Res., 1988, 48, 5941 CAS.
  17. J. Woo, Y. Kim, Y. Choi, D. Kim, K. Lee, J. H. Bae, D. S. Chang, Y. J. Jeong, Y. H. Lee, J. Park and T. K. Kwon, Carcinogenesis, 2003, 24, 1199 CrossRef CAS PubMed.
  18. M. J. Van Erk, E. Teuling, Y. C. M. Staal, S. Huybers, P. J. van Bladeren, J. M. M. J. G. Aarts and B. van Ommen, J. Carcinog., 2004, 3, 1 CrossRef PubMed.
  19. R. C. Srimal and B. N. Dhawan, J. Pharm. Pharmacol., 1973, 25, 447 CrossRef CAS PubMed.
  20. Y. Kiso, Y. Suzuki, N. Watanabe, Y. Oshima and H. Hikino, Planta Med., 1983, 49, 185 CrossRef CAS PubMed.
  21. S. D. Deodhar, R. Sethi and R. C. Srimal, Indian J. Med. Res., 1980, 71, 632 CAS.
  22. W. C. Jordan and C. R. Drew, J. Natl. Med. Assoc., 1996, 88, 333 CAS.
  23. R. De, P. Kundu, S. Swarnakar, T. Ramamurthy, A. Chowdhury, G. B. Nair and A. K. Mukhopadhyay, Antimicrob. Agents Chemother., 2009, 53, 1592 CrossRef CAS PubMed.
  24. Y. Wang, Z. Lu, H. Wu and F. Lv, Int. J. Food Microbiol., 2009, 136, 71 CrossRef CAS PubMed.
  25. R. Srivastava, M. Dikshit, R. C. Srimal and B. N. Dhawan, Thromb. Res., 1985, 40, 413 CrossRef CAS.
  26. F. Yang, G. P. Lim, A. N. Begum, O. J. Ubeda, M. R. Simmons, S. S. Ambegaokar, P. Chen, R. Kayed, C. G. Glabe, S. A. Frautschy and G. M. Cole, J. Biol. Chem., 2004, 280, 5892 CrossRef PubMed.
  27. M. E. Egan, M. Pearson, S. A. Weiner, V. Rajendarn, D. Rubin, J. Glochner-Pagel, S. Canney, K. Du, G. L. Lukacs and M. F. Caplan, Science, 2004, 304, 600 CrossRef CAS PubMed.
  28. A. L. Cheng, C. H. Hsu, J. K. Lin, M. M. Hsu, Y. F. Ho, T. S. Shen, J. Y. Ko, J. T. Lin, B. R. Lin, W. Ming-Shiang, H. S. Yu, S. H. Jee, G. S. Chen, T. M. Chen, C. A. Chen, M. K. Lai, Y. S. Pu, M. H. Pan, Y. J. Wang, C. C. Tsai and C. Y. Hsieh, Anticancer Res., 2001, 21, 2895 CAS.
  29. B. Wahlstrom and G. Blenow, Acta Pharmacol. Toxicol., 1978, 43, 86 CrossRef CAS PubMed.
  30. R. K. Basniwal, H. S. Buttar, V. K. Jain and N. Jain, J. Agric. Food Chem., 2011, 59, 2056 CrossRef PubMed.
  31. P. Anand, H. B. Nair, B. Sung, A. B. Kunnumakkara, V. R. Yadav, R. R. Tekmal and B. B. Aggarwal, Biochem. Pharmacol., 2010, 79, 330 CrossRef CAS PubMed.
  32. R. K. Das, N. Kasoju and U. Bora, Nanomedicine, 2010, 6, 153 CrossRef CAS PubMed.
  33. D. Wang, M. S. Veena, K. Stevenson, C. Tang, B. Ho, J. D. Suh, V. M. Duarte, K. F. Faull, K. Mehta, E. S. Srivatsan and M. B. Wang, Clin. Cancer Res., 2008, 14, 6228 CrossRef CAS PubMed.
  34. N. W. Clifford, K. S. Iyer and C. L. Raston, J. Mater. Chem., 2008, 18, 162 RSC.
  35. S. Bisht, M. Mizuma, G. Feldmann, N. A. Ottenhof, S.-M. Hong, D. Pamanik, V. Chenna, C. Karikari, R. Sharma, M. G. Goggins, M. A. Rudek, R. Ravi, A. Maitra and A. Maitra, Mol. Cancer Ther., 2010, 9, 2255 CrossRef CAS PubMed.
  36. S. Bisht, G. Feldmann, S. Soni, R. Ravi, C. Karikar, A. Maitra and A. Maitra, J. Nanobiotechnol., 2007, 5, 3 CrossRef PubMed.
  37. M. M. Yallapu, B. K. Gupta, M. Jaggi and S. C. Chauhan, J. Colloid Interface Sci., 2010, 351, 19 CrossRef CAS PubMed.
  38. R. K. Bhawana, H. S. Basniwal, V. K. Buttar and N. Jain, J. Agric. Food Chem., 2011, 59, 2056 CrossRef CAS PubMed.
  39. K. Maiti, K. Mukherjee, A. Gantait, B. P. Saha and P. K. Mukherjee, Int. J. Pharm., 2007, 330, 155 CrossRef CAS PubMed.
  40. D. Patra and F. Sleem, Anal. Chim. Acta, 2013, 795, 60 CrossRef CAS PubMed.
  41. D. Patra, A. J. Amali and R. K. Rana, J. Mater. Chem., 2009, 19, 4017 RSC.
  42. A. J. Amali, N. H. Awwad, R. K. Rana and D. Patra, Anal. Chim. Acta, 2011, 708, 75 CrossRef CAS PubMed.
  43. P. Zhang, X. Song, W. Tong and C. Gao, Macromol. Biosci., 2014, 14, 1495 CrossRef CAS PubMed.
  44. M. Mauslmani and D. Patra, RSC Adv., 2014, 4, 8316 Search PubMed.
  45. S. V. Jovanovic, S. Steenken, C. W. Boone and M. G. Simic, J. Am. Chem. Soc., 1999, 121, 9677 CrossRef CAS.
  46. B. Ozcelik, J. H. Lee and D. B. Min, J. Food Sci., 2003, 68, 487 CrossRef PubMed.
  47. K. A. Connors, Binding Constants: The measurements of molecular complex stability, Wiley, New York, 1987 Search PubMed.
  48. C. Barakat and D. Patra, Luminescence, 2013, 28, 179 CrossRef PubMed.
  49. C. A. Mirkin, R. L. Letsinger, R. C. Mucic and J. J. Storhoff, Nature, 1996, 382, 607 CrossRef CAS PubMed.
  50. R. F. Pasternack, C. Bustamante, P. J. Collings, A. Giannetto and E. J. Gibbs, J. Am. Chem. Soc., 1993, 115, 5393 CrossRef CAS.
  51. C. Xie, F. G. Xu, X. Y. Huang, C. Q. Dong and J. C. Ren, J. Am. Chem. Soc., 2009, 131, 12763 CrossRef CAS PubMed.
  52. T. M. Kolev, E. A. Velcheva, B. A. Stamboliyska and M. Spiteller, Int. J. Quantum Chem., 2005, 102, 1069 CrossRef CAS.
  53. T. Higuchi, J. Pharm. Sci., 1963, 52, 1145 CrossRef CAS.

Footnote

Electronic supplementary information (ESI) available. See DOI: 10.1039/c4ra12831a

This journal is © The Royal Society of Chemistry 2015