Investigation on the optimization, design and microwave absorption properties of reduced graphene oxide/tetrapod-like ZnO composites

Long Zhanga, Xiaohui Zhanga, Guangjie Zhanga, Zheng Zhanga, Shuo Liua, Peifeng Lia, Qingliang Liao*a, Yanguang Zhaoa and Yue Zhang*ab
aDepartment of Materials Physics and Chemistry, University of Science and Technology Beijing, Beijing 100083, People's Republic of China.. E-mail: liao@ustb.edu.cn
bState Key Laboratory for Advanced Metals and Materials, University of Science and Technology Beijing, Beijing 100083, People's Republic of China.. E-mail: yuezhang@ustb.edu.cn

Received 17th October 2014 , Accepted 5th January 2015

First published on 5th January 2015


Abstract

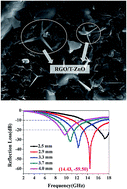
A novel microwave absorption composite was fabricated by mixing reduced graphene oxide (RGO) and tetrapod-like ZnO (T-ZnO). The microwave absorption properties of the fabricated composites with different components were investigated. The effects of RGO mass fractions and thickness of composites on microwave absorption properties were studied in the range from 2 to 18 GHz. The electromagnetic parameters showed that the RGO/T-ZnO composites were mainly dependent on dielectric loss. The composites with 5 wt% RGO and 10 wt% T-ZnO had the optimum microwave absorption properties at the thickness of 2.9 mm, and the corresponding minimum reflection loss was −59.50 dB at 14.43 GHz. The bandwidth corresponding to the reflection loss below −20 dB was 8.9 GHz (from 9.1 GHz to 18.0 GHz) when the thickness was in the range of 2.5–4.0 mm. Thus, the composite has a low reflection loss value and wide effective absorption bandwidth in X-band (8–12 GHz) and Ku-band (12–18 GHz), which has great potential for military stealth. The excellent microwave absorption properties were mainly attributed to dielectric relaxation and polarization of RGO, electronic polarization from the needle-like tips of T-ZnO, electrical conduction loss and multiple scattering.

1. Introduction

In recent decades, microwave absorption materials have been broadly studied for their applications in both military and civil aspects such as security protection and microwave darkrooms. According to the mechanism of microwave absorption, most microwave absorbing materials are composed of dielectric loss materials such as carbon nanotubes,1,2 conduction polymers3 and magnetic loss materials such as ferrite,4 ultrafine metal powder.5 Much effort have been devoted to the design of ideal microwave absorbing materials with lightweight, thin thickness, high absorption rate and wide absorption band. Compared with magnetic loss materials, dielectric loss materials comparatively have higher complex permittivity values and corrosion resistance, and lower density, which can improve microwave absorption properties and the scope of application.

Graphene, two-dimensional planar sheets composed by sp2-bonded carbon atoms, has attracted much attention owing to its unique electrical, mechanical, and thermal properties. These unique features offer great promise for microwave absorber and many researches have been carried out recently.

Ternary reduced graphene oxide (RGO)/Cu2O/Cu composites possessed a minimum reflection loss (RL) (−51.8 dB at 14.6 GHz) and a wide absorption band (less than −10 dB from 12.1 to 16.2 GHz).6 Chemically reduced graphene/poly(ethylene oxide) composites showed minimum RL was −38.8 dB.7 Tetrapod-like ZnO is widely used as microwave absorber due to advantages in respect of unique three-dimensional structure, lightweight and semiconductive properties. The microwave absorbing composites were prepared using carbon black (CB) and T-ZnO as absorbents and epoxy resin (EP) as binder, and the CB/T-ZnO/EP composites had the minimum RL which was −19.31 dB with thickness at 3 mm.8 The minimum RL of CNTs/T-ZnO composites mixing by 4 wt% CNTs and 10 wt% T-ZnO was −37.03 dB at a thickness of 2.0 mm.9 Previous reports indicate that composites based on T-ZnO could be used as microwave absorption materials with good absorption properties.

Until now, few works have been carried out on the study of the microwave absorption properties of RGO/T-ZnO composites, which might exhibit good microwave absorption properties owing to the combination of the excellent electrical conductivity of RGO and unique structure of T-ZnO. In this work, RGO/T-ZnO composites were fabricated with different components. The microwave absorption properties and possible mechanisms of RGO/T-ZnO composites were investigated. The minimum RL of RGO/T-ZnO composites reached −59.50 dB with a thickness of only 2.9 mm. The absorption bandwidth with RL < −10 dB was up to 6.8 GHz. Moreover, the addition amount of the RGO/T-ZnO composites into the paraffin was only 15 wt%. Thus, RGO/T-ZnO composites were very promising as lightweight microwave absorption materials.

2. Experimental

The RGO was prepared by chemically reduction of graphene oxide (GO) which was obtained by the modified Hummers method.10 T-ZnO nanostructures were synthesized with a tube furnace by the thermal evaporation of Zn powder.11 The RGO/T-ZnO composites were fabricated through an aqueous mixing method in ethanol. Firstly, different amounts of RGO were dispersed in ethanol by means of ultrasonicating for 30 min. Then, adequate amount of T-ZnO was added into the dispersive RGO solution. The solution was then ultrasonicated less than 5 min to avoid the destruction of T-ZnO. Finally, the solution was dried in oven at 80 °C for 6 h under stirring gently. The dried product obtained from the solution was mixed with molten paraffin and compressed to a standard ring of 7.0 mm × 3.0 mm × 2.0 mm (outer diameter × inner diameter × thickness) for electromagnetic parameters measurement. The mixture proportions of measured samples are illustrated in Table 1.
Table 1 Samples with different contents for electromagnetic parameters measurement
Samples 1# 2# 3# 4# 5#
RGO (wt%) 0 3 5 10 15
T-ZnO (wt%) 10 10 10 10 10


The samples were characterized by field emission scanning electron microscopy (FESEM) (FEI, Quanta 3D FEG), X-ray diffraction (XRD) (Rigaku DMAX-RB), X-ray photoelectron spectroscopy (XPS) (Axis Ultra DLD), and Raman spectrometer (Jobin-Yvon, JY-HR800). The electromagnetic parameters of samples were measured by a vector network analyzer system (HP722ES) from 2 to 18 GHz. Reflectivity loss values were calculated by Matlab software according to the complex permittivity and complex permeability.

3. Results and discussion

The SEM images and Raman spectra of the absorbers and composites are shown in Fig. 1. Fig. 1(a) and (b) are the SEM images of RGO sheets and T-ZnO. Fig. 1(a) shows that RGO sheets appeared transparent and rough, with some wrinkles and stacks on the surface and edge. Fig. 1(b) shows that the T-ZnO has the tetrapod shape. The length and the diameter of T-ZnO are about 19 and 2.5 μm, respectively. Fig. 1(c) demonstrates that T-ZnO whiskers are decorated by RGO and most remain the tetrapod shape. The T-ZnO whiskers are evenly distributed and constitute network in the composites, which may improve microwave absorption properties of the composites.
image file: c4ra12591f-f1.tif
Fig. 1 The SEM images and Raman spectra of absorbers and composites: (a) and (b) typical SEM images of RGO and T-ZnO, (c) fractured cross-section of RGO/T-ZnO/paraffin composites with 5 wt% RGO and 10 wt% T-ZnO whiskers.

XRD measurements are employed to investigate the phase composition and crystalline structure of the synthesized samples. Fig. 2(a) showed the XRD patterns of RGO/T-ZnO composites. All the observed peaks of T-ZnO shown in Fig. 2(a) match with the standard XRD pattern (JCPDS no. 89-0511), which can be indexed to wurtzite structure with constants of a = 0.325 nm, c = 0.521 nm. The diffraction peak of RGO is observed at 2θ = 24.7°, indicating the d-spacing between atomic layers of graphite (002) is 0.37 nm. The data confirm the recovery of an ordered graphitic crystal structure. No peaks from other phases are observed, indicating the successful synthesis of the RGO/T-ZnO composites.


image file: c4ra12591f-f2.tif
Fig. 2 Structure characterization of RGO/T-ZnO composite. (a) X-ray diffraction pattern; (b) Raman spectra of RGO and RGO/T-ZnO; (c) XPS spectrum (C1s) of RGO and RGO/T-ZnO.

The structural changes from RGO to RGO/T-ZnO composites are reflected in the Raman spectra, which shown in Fig. 2(b). The Raman spectrum shows the interaction between RGO and T-ZnO. For the spectrum of RGO, it can be observed that two prominent peaks of the D and G bands are located at 1359 and 1580 cm−1, respectively. Here, the D-band is attributed to the presence of sp3 defects in the graphene sheets, while G-band corresponding to the first order scattering of E2g mode.12 For RGO/T-ZnO composite, the D band red shifts to 1354 cm−1 and G band blue shifts to 1587 cm−1, suggesting the presence of charge transfer between RGO and T-ZnO. Besides, the intensity ratio of D and G peaks (ID/IG) is enhanced from 0.93 to 0.99 compared with RGO, indicating increasing numbers of defects have been generated due to the interfacial interaction between RGO and T-ZnO, which may influence the microwave absorption properties of the RGO/T-ZnO composite.13

XPS spectrum supports the results of Raman spectra, which is shown in Fig. 2(c). The C1s spectrum of RGO shows two peaks located at 284.8 eV and 285.9 eV, which refers to the C–C bond of sp2 hybrid and carboxyl groups, respectively.14,15 Compared to the RGO, the C1s spectrum of RGO/T-ZnO is split into three parts. C–C bond (284.8 eV) and C–OH (285.9 eV) are remained, while C–OH decreases obviously implying the further reduction during the synthesis process. A weak peak at 289.1 eV emerged, which relates to the carbonyl group.16 It is convinced that the more defects were introduced with addition of T-ZnO.

Various contents of RGO and 10 wt% T-ZnO are mixed with paraffin. The relative complex permittivity (εr = ε′ − ′′) and complex permeability (μr = μ′ − ′′) are measured in the range of 2–18 GHz. Both RGO and T-ZnO are non-magnetic, whose composites exhibit μ′′ ≈ 0 and μ′ ≈ 1. Fig. 3(a) and (b) show the real part (ε′) and the imaginary part (ε′′) of relative complex permittivity of the RGO/T-ZnO composites. It demonstrates that ε′ and ε′′ of the composites increase significantly with the proportion of RGO increasing. The ε′ and ε′′ of composites are much higher than that of T-ZnO. In the range of 2–18 GHz, RGO/T-ZnO composite with 5 wt% RGO had a ε′ decline from 7.32 to 3.38 and a ε′′ decline from 5.25 to 1.90. However, pure T-ZnO had a ε′ fluctuation between 2.16 and 2.25, a ε′′ fluctuation between 0.01 and 0.07. Fig. 3(a) and (b) show that the dielectric constant decreases with the frequency increasing, and the dielectric response has obvious frequency-dependent properties. The frequency-dependent dielectric response can be explained by the presence of electric dipoles. When the frequency of the applied field is increased, the dipoles present in the system cannot reorient themselves fast enough to respond to the applied electric field and as a result, dielectric constant decreases.17


image file: c4ra12591f-f3.tif
Fig. 3 Dielectric characteristics of RGO/T-ZnO composites in the range of 2–18 GHz: (a) real part of permittivity, (b) imaginary part of permittivity, and (c) dielectric loss tangent.

Fig. 3(c) shows frequency dependence of the dielectric loss tangent (tan[thin space (1/6-em)]δE = ε′′/ε′) of the RGO/T-ZnO composites, which indicates the inherent dissipation of electromagnetic energy for dielectric materials. It is observed that with the increase proportion of RGO, tan[thin space (1/6-em)]δE increases remarkably. The results demonstrate that RGO can increase the dielectric loss of the composite remarkably. The composite with 5 wt% RGO have a tan[thin space (1/6-em)]δE range from 0.73 to 0.55, while the value of tan[thin space (1/6-em)]δE is nearly 0 for pure T-ZnO. When the proportion of RGO increases to 10 wt%, tan[thin space (1/6-em)]δE > 1 is in the range of 2–5.6 GHz. Moreover, tan[thin space (1/6-em)]δE > 1 is over 2–18 GHz once the proportion of RGO increase to 15 wt%. The results demonstrate that RGO/T-ZnO composite is a kind of material with strong dielectric loss.

To clarify the microwave absorption properties, the reflection loss (RL) can be calculated according to the transmission line theory with the relative complex permittivity and permeability data,18 as follows:

 
image file: c4ra12591f-t1.tif(1)

While the normalized input impedance (Zin) is calculated by:

 
image file: c4ra12591f-t2.tif(2)
where, f is the frequency of electromagnetic waves, c is the velocity of electromagnetic waves in free space, and d is the thickness of the absorber.

The calculated RL curves of RGO/T-ZnO composites with different proportion of RGO at the thickness of 3 mm are shown in Fig. 4(a). The RL of pure T-ZnO is very poor and there is no bandwidth under −2 dB. With the proportion of RGO increasing, the absorption peaks increase firstly then decrease, and shift toward the low frequency regions. When RGO reaches 5 wt%, the minimum RL reaches −46.30 dB at 13.75 GHz for the RGO/T-ZnO composite. The bandwidth corresponding to RL < −10 and RL < −20 dB can reach 7.3 (from 10.7 to 18 GHz) and 2.4 GHz (from 12.7 to 15.1 GHz), respectively. The microwave absorption properties of the RGO/T-ZnO composite originate from two main key factors. On the one hand, the two-dimensional sheets of RGO with a large specific surface area and three-dimensional tetrapod structures of T-ZnO constitute conduction network within the composite, resulting in high conduction loss. In addition, the residual defects and groups in RGO not only can improve the impedance match characteristic but also introduce the transition from contiguous states to Fermi level, defect polarization relaxation, and groups' electronic dipole polarization relaxation, which are all in favor of electromagnetic wave penetration and absorption.19 On the other hand, when RGO increase beyond 10 wt%, the over high permittivity of RGO is harmful to the impedance match and result in strong reflection and weak absorption.20 Thus, the minimum RL of the composite with 10 and 15 wt% RGO was only −12.85 and −8.95 dB, respectively.


image file: c4ra12591f-f4.tif
Fig. 4 Microwave absorption properties of RGO/T-ZnO composites with (a) different amount of RGO, (b) different thickness when the loading of RGO is 5 wt%, and (c) frequency dependence of absorption bandwidth and coating thickness.

Fig. 4(b) shows the RL curve of RGO/T-ZnO composite with 5 wt% RGO and 10 wt% T-ZnO in the thickness of 2.5–4.0 mm. It is found that the absorption peaks shifted toward the low frequency regions with the layer thickness increased. When the thickness is 2.9 mm, the minimum RL can reach −59.5 dB at 14.43 GHz. The bandwidth corresponding to the RL < −10 and RL < −20 dB are 6.8 (from 11.2 to 18.0 GHz) and 2.4 GHz (from 13.2 to 15.6 GHz), respectively. Fig. 4(c) shows the frequency dependence of absorption bandwidth and coating thickness of RGO/T-ZnO composite with 5 wt% RGO and 10 wt% T-ZnO. It can be seen the composite has a broad bandwidth at the thickness of 2.9 mm. Moreover, the absorption bandwidth with the RL < −20 dB is up to 8.9 GHz (from 9.1 to 18 GHz) for the composite with the thickness changing in 2.5–4.0 mm. Thus, good microwave absorption properties at specific frequency can be obtained by adjusting the coating thickness.

Compared with other composites, the RGO/T-ZnO composite in this work exhibited better microwave absorption properties, as shown in Table 2. Besides, the amount of the absorbers into the paraffin was more than 20 wt%, while RGO/T-ZnO composite is only 15 wt%. Thus, RGO/T-ZnO composite has great potential application as the microwave absorption materials with outstanding properties and lightweight.

Table 2 Comparison of RL between other materials and RGO/T-ZnO composite. C denotes the added amount of composites in the paraffin matrix
Materials RLmin (dB) Absorption bandwidth (GHz) (RL < −10 dB) C (wt%) Reference
Pure RGO −7 0 16
RGO/Cu2O/Cu −51.8 4.1 50 6
G/Fe3O4@Fe/ZnO −38.4 3.1 20 21
NiFe2O4 nanorod–graphene −29.2 4.4 60 4
Fe3O4/carbon core/shell nanorods −27.9 5.0 55 22
RGO/T-ZnO −59.5 6.8 15 This work


Above electromagnetic parameters showed that the RGO/T-ZnO composites were mainly dependent on dielectric loss, so the Debye dielectric relaxation plays an important role in the mechanism of electromagnetic microwave absorption. According to,23 the relative complex permittivity can be expressed by the following equation,

 
image file: c4ra12591f-t3.tif(3)
where, f, εs, ε and τ are frequency, static permittivity, relative dielectric permittivity at the high-frequency limit, and polarization relaxation time, respectively. Thus, ε′ and ε′′ can be deduced by:
 
image file: c4ra12591f-t4.tif(4)
 
image file: c4ra12591f-t5.tif(5)

According to eqn (4) and (5), the relationship between ε′ and ε′′ can be deduced,

 
image file: c4ra12591f-t6.tif(6)
 
image file: c4ra12591f-t7.tif(7)

Based on eqn (6), it is not hard to find that the plot of εversus ε′′ would be a single semicircle, which is usually denoted as the Cole–Cole semicircle. Each semicircle corresponds to one Debye relaxation process. Fig. 5(a) shows εversus ε′′ curve of the RGO/T-ZnO composite over the 2–18 GHz frequency range, which presents an obvious segment of three semicircles. The results indicate the existence of multi-dielectric relaxation processes. Fig. 5(b) shows εversus ε′′ curve of pure RGO, which can be seen that the multi-dielectric relaxation processes also exist in the RGO. The comparison of Fig. 5(a) and (b) indicate the presence of RGO introduces relaxation processes, which significantly improve microwave absorption properties of the RGO/T-ZnO composite. Furthermore, according to eqn (7), the curve of εversus ε′′/f should be a straight line if the dielectric loss is associated with only one physical phenomenon, and a fixed relaxation time can be obtained from the slope of the line (k = 1/(2πτ)).24 Fig. 5(c) shows the plot of εversus ε′′/f for RGO/T-ZnO composite based on eqn (7), with the fit lines being obtained at the assistance of linear regression analysis. The curve can be fitted into three linear functions with different slopes, which are consistent with the three Cole–Cole semicircles. The calculated relaxation times are 5.23 × 10⁻¹¹, 1.45 × 10⁻¹⁰ and 9.08 × 10⁻¹⁰ s, respectively.


image file: c4ra12591f-f5.tif
Fig. 5 Cole–Cole semicircles for (a) the RGO/T-ZnO composite with 5 wt% RGO and 10 wt% T-ZnO, (b) pure RGO, and (c) the plot of εversus ε′′/f for RGO/T-ZnO composite with 5 wt% RGO and 10 wt% T-ZnO.

The excellent absorption properties of RGO/T-ZnO composite can be explained as follow (shown in Fig. 6). Firstly, when electromagnetic waves arrive, the directional motion of charge carriers on RGO formed oscillatory current, and boundary charges induced dielectric relaxation and polarization.25 Secondly, the needle-like tips of T-ZnO also can cause strong electronic polarization. The charge concentrating effect at the needles' tips of T-ZnO is distinct when the material is under an electric field because of the large aspect ratio and the limited conductivity of the T-ZnO.26 So, the concentrated tips will act as multipoles that will be tuned with the incident microwaves and contribute to strong absorption.27 Thirdly, the uniformly-distributed T-ZnO with special three-dimensional tetrapod-structure and RGO with high aspect ratio can form conduction network and the energy will be induced into dissipative current, which can cause high electrical conduction loss. Finally, there are many interfaces between T-ZnO and RGO would generate multiple scattering and interfacial electric polarization, and thereby increase absorption.


image file: c4ra12591f-f6.tif
Fig. 6 Schematic illustration showing how the microwave dissipated in three-dimensional network of RGO/T-ZnO composite.

4. Conclusions

RGO/T-ZnO microwave absorption composites were obtained by mixing RGO with T-ZnO. With the content of RGO increased, dielectric loss increased remarkably. However, the absorption peaks increased firstly then decreased. The optimum microwave absorption properties of composites were obtained with 5 wt% RGO and 10 wt% T-ZnO. The minimum RL of RGO/T-ZnO composites reached −59.50 dB at the thickness of 2.9 mm. The bandwidth with RL < −20 dB was 8.9 GHz (from 9.1 GHz to 18.0 GHz) with the thickness in the range of 2.5–4.0 mm. The excellent microwave absorption properties were mainly attributed to dielectric relaxation and polarization of RGO, electronic polarization from the needle-like tips of T-ZnO, electrical conduction loss and multiple scattering. The RGO/T-ZnO composites with strong absorption properties are expected to have practical applications in microwave absorption field with lightweight.

Acknowledgements

This work was supported by the National Major Research Program of China (2013CB932602), the Major Project of International Cooperation and Exchanges (2012DFA50990), NSFC (51172022, 51232001, and 51372020), the Fundamental Research Funds for Central Universities, State Key Lab of Advanced Metals and Materials (2014Z-11), Program for New Century Excellent Talents in University, Beijing Higher Education Young Elite Teacher Project, the Programme of Introducing Talents of Discipline to Universities (B14003), and Program for Changjiang Scholars and Innovative Research Team in University.

Notes and references

  1. Y. Qing, W. Zhou, F. Luo and D. Zhu, Carbon, 2010, 48, 4074–4080 CrossRef CAS PubMed.
  2. Y. Liu, X. Yin, L. Kong, X. Liu, F. Ye, L. Zhang and L. Cheng, Carbon, 2013, 64, 537–556 CrossRef PubMed.
  3. A. Ohlan, K. Singh, A. Chandra and S. K. Dhawan, ACS Appl. Mater. Interfaces, 2010, 2, 927–933 CAS.
  4. M. Fu, Q. Jiao and Y. Zhao, J. Mater. Chem. A, 2013, 1, 5577–5586 CAS.
  5. T. Wang, H. Wang, X. Chi, R. Li and J. Wang, Carbon, 2014, 74, 312–318 CrossRef CAS PubMed.
  6. M. Zong, Y. Huang, H. Wu, Y. Zhao, P. Liu and L. Wang, Mater. Lett., 2013, 109, 112–115 CrossRef CAS PubMed.
  7. X. Bai, Y. Zhai and Y. Zhang, J. Phys. Chem. C, 2011, 115, 11673–11677 CAS.
  8. H. Qin, Q. Liao, G. Zhang, Y. Huang and Y. Zhang, Appl. Surf. Sci., 2013, 286, 7–11 CrossRef CAS PubMed.
  9. G. Liu, L. Wang, G. Chen, S. Hua, C. Ge, H. Zhang and R. Wu, J. Alloys Compd., 2012, 514, 183–188 CrossRef CAS PubMed.
  10. W. S. Hummers Jr and R. E. Offeman, J. Am. Chem. Soc., 1958, 80, 1339 CrossRef.
  11. Y. Dai, Y. Zhang, Q. Li and C. Nan, Chem. Phys. Lett., 2002, 358, 83–86 CrossRef CAS.
  12. F. Tuinstra and J. L. Koenig, J. Chem. Phys., 1970, 53, 1126–1130 CrossRef CAS PubMed.
  13. A. Ferrari and J. Robertson, Phys. Rev. B: Condens. Matter Mater. Phys., 2000, 61, 14095–14107 CrossRef CAS.
  14. X. Zhang, Q. Liao, S. Liu, W. Xu, Y. Liu and Y. Zhang, Anal. Chim. Acta, 2014 DOI:10.1016/j.aca.2014.12.007.
  15. X. Zhang, Y. Zhang, Q. Liao, Y. Song and S. Ma, Small, 2013, 9, 4045 CrossRef CAS PubMed.
  16. D. Yang, A. Velamakanni, G. Bozoklu, S. Park, M. Stoller, R. D. Piner, S. Stankovich, I. Jung, D. A. Field, C. A. Ventrice and R. S. Ruoff, Carbon, 2009, 47, 145–152 CrossRef CAS PubMed.
  17. A. P. Singh, P. Garg, F. Alam, K. Singh, R. B. Mathur, R. P. Tandon, A. Chandra and S. K. Dhawan, Carbon, 2012, 50, 3868–3875 CrossRef CAS PubMed.
  18. P. Miles, W. Westphal and A. Von Hippel, Rev. Mod. Phys., 1957, 29, 279–307 CrossRef CAS.
  19. C. Wang, X. Han, P. Xu, X. Zhang, Y. Du, S. Hu, J. Wang and X. Wang, Appl. Phys. Lett., 2011, 98, 072906 CrossRef PubMed.
  20. R. Che, L. M. Peng, X. F. Duan, Q. Chen and X. Liang, Adv. Mater., 2004, 16, 401–405 CrossRef CAS.
  21. Y. L. Ren, H. Y. Wu, M. M. Lu, Y. J. Chen, C. L. Zhu, P. Gao, M. S. Cao, C. Y. Li and Q. Y. Ouyang, ACS Appl. Mater. Interfaces, 2012, 4, 6436–6442 CAS.
  22. Y.-J. Chen, G. Xiao, T.-S. Wang, Q.-Y. Ouyang, L.-H. Qi, Y. Ma, P. Gao, C.-L. Zhu, M.-S. Cao and H.-B. Jin, J. Phys. Chem. C, 2011, 115, 13603–13608 CAS.
  23. H. Yu, T. Wang, B. Wen, M. Lu, Z. Xu, C. Zhu, Y. Chen, X. Xue, C. Sun and M. Cao, J. Mater. Chem., 2012, 22, 21679–21685 RSC.
  24. Y. Duan, Z. Liu, H. Jing, Y. Zhang and S. Li, J. Mater. Chem., 2012, 22, 18291 RSC.
  25. D. Micheli, C. Apollo, R. Pastore and M. Marchetti, Compos. Sci. Technol., 2010, 70, 400–409 CrossRef CAS PubMed.
  26. Z. Zhou, L. Chu, W. Tang and L. Gu, J. Electrost., 2003, 57, 347–354 CrossRef CAS.
  27. Z. Zhou, L. Chu and S. Hu, Mater. Sci. Eng., B, 2006, 126, 93–96 CrossRef CAS PubMed.

This journal is © The Royal Society of Chemistry 2015
Click here to see how this site uses Cookies. View our privacy policy here.