Dianmiao Cuiab,
Jiao Liu*a,
Jian Yua,
Junrong Yuea,
Fabing Sua and
Guangwen Xu*a
aState Key Laboratory of Multi-phase Complex Systems, Institute of Process Engineering, Chinese Academy of Sciences, Beijing 100190, China. E-mail: liujiao@ipe.ac.cn; gwxu@ipe.ac.cn; Fax: +86-10-82544886; Tel: +86-10-82544429
bUniversity of Chinese Academy of Sciences, Beijing 100049, China
First published on 6th January 2015
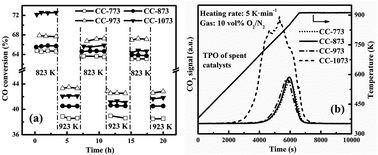
This article investigates the necessary metal-support interaction in the Ni–Mg–Zr–La/Al2O3 catalyst for high-temperature syngas methanation through varying the calcination and reduction temperatures during catalyst preparation. Atmospheric syngas methanation was conducted continuously but at 823 K and 923 K alternatively. Raising the calcination temperature increased the interaction between the nickel and alumina support but lowered the surface area of the catalyst. The catalyst calcined at the higher temperature such as 1073 K exhibited the highest initial activity in spite of its least active sites. However, only those catalysts with moderate interaction, such as that calcined at 973 K, showed stable activity of methanation above 823 K. Too small surface area of the catalyst calcined at too high temperatures, such as 1073 K, would lead to serious aggregation of nickel particles and thus cause carbon deposition during methanation. Varying the reduction temperature for the catalyst demonstrated that the excessive reduction of the nickel species such as that reduced at 1073 K almost removed all the nickel aluminates to cause the catalyst to have low activity, quick nickel aggregation and carbon deposition. This further justified the claim that moderate metal-support interaction is necessary to ensure the high activity and stability of the Ni/Al2O3 catalyst for syngas methanation at high temperatures.
On the other hand, catalytic performance of the nickel-based catalysts strongly depends not only on the nature and structure of active nickel but also on the chemical and physical property of supporting materials. Various materials, such as Al2O3, TiO2, SiO2 and SiC, have been investigated as support for Ni catalysts,14,26–28 but Al2O3 is still the most widely applied.29,30 The Al2O3 support could weaken the interaction among Ni particles to stabilize the NiO particles against sintering. At high calcination temperatures, nickel oxide and nickel aluminates are formed. Nickel aluminates render the reduction of the nickel oxide more difficult and lead to a decrease in the number of active sites and thus catalytic activity of the catalyst. Meanwhile, a relatively strong interaction between the nickel species and alumina support could result in finely dispersed nickel particles on the catalyst surface and thereby prevent the coke formation.31 Ma et al.32 found that the formation of a few NiAl2O4 will favor high activity of Ni/Al2O3 catalyst during methanation, and having an optimum ratio of the easy-reducing NiOx to the difficult-reducing nickel species may be one of the reasons for the good activity of the studied catalyst. Comparison of methanation performances over Ni–Mg/Al2O3 catalysts prepared with the methods of co-precipitation, homogeneous precipitation and acid–base pairing have clarified that the dispersed NiO interacting with support would prevent the agglomeration of Ni crystallites, and this was likely to improve the activity and stability of the catalyst at high temperatures (up to 973 K).33
Nonetheless, it is not fully understood how the catalyst activity and stability are influenced by the different nickel species and their interactions with support. The present paper devises the studies of such issues through varying the calcination and reduction temperatures by clarifying their influences on the properties and methanation performances (activity and stability) of the Ni/Al2O3 catalyst.
In preparing the catalyst, aqueous solutions of NaAlO2 and metal nitrates including Ni(NO3)2·6H2O, Mg(NO3)2·6H2O, ZrOCl2·8H2O, La(NO3)3·6H2O and Al(NO3)3·9H2O were first added dropwise into a reaction vessel with 200 mL water in advance kept at 313 K and under continuous mechanical stirring. The addition rate of the solutions and the ratio of Al(NO3)3·9H2O to NaAlO2 were controlled to maintain the condition of pH = 11. Then the solution of the precursor was transferred to a stainless steel autoclave which was in turn sealed and maintained at 473 K for 10 h and cooled in turn to room temperature naturally in air. The resulting precipitate was, in succession, aged, washed, filtered, dried at 353 K for 10 h and finally calcined at one of four particularly selected different temperatures (773 K, 873 K, 973 K and 1073 K) for 4 h. The obtained catalysts were all crushed and sieved into particles of 180–230 μm and denoted as CC-773, CC-873, CC-973 and CC-1073 according to their calcination temperatures, respectively.
The CO conversion and CH4 concentration referred to herein are defined as
Catalyst | Surface areaa | Pore volumeb | Average pore sizec | Carbon amountd |
---|---|---|---|---|
a Calculated with the BET equation from the N2 physisorption isotherms, m2 g−1.b Referring to the BJH desorption pore volume from the N2 physisorption isotherms, cm3 g−1.c Referring to the BJH desorption average pore size from the N2 physisorption isotherms, nm.d Measured via an infrared carbon–sulfur analyzer (CS-344, US) for spent catalysts, wt%. | ||||
CC-773 | 118 | 0.32 | 8.3 | 4.3 |
CC-873 | 93 | 0.25 | 9.2 | 4.2 |
CC-973 | 79 | 0.22 | 9.8 | 3.9 |
CC-1073 | 52 | 0.18 | 12.7 | 25.3 |
The XRD patterns of the Ni–Mg–Zr–La/Al2O3 catalysts calcined at different temperatures are shown in Fig. 1(a). The NiAl2O4, MgAl2O4, Ni–Mg solid solution and γ-Al2O3 generally co-presented at 2θ around 37°, 45° and 67° in the calcined samples, while the peaks of NiO appeared at 43° and 63° corresponding to the (200) and (220) planes, respectively. With increasing the calcination temperature, the overlapped diffraction peaks of solid solutions and γ-Al2O3 slightly shifted to the low diffraction angel. This is because the finely dispersed nickel oxide species in the calcined catalysts were obviously incorporated into the lattice of MgO or γ-Al2O3 during the calcination process, resulting in the formation of solid solutions phase.38,39 Meanwhile, the formation of nickel aluminate phases retarded the phase transformation in the catalyst due to the increase in activation energy for crystallization of both alumina and nickel oxide species.40 Therefore, no phase transformation of alumina (γ-Al2O3 to α-Al2O3) occurred by increasing the calcination temperature to 1073 K. Subtracting the diffraction peaks of ZrO2 and La2O3, the peak of NiO at 2θ = 43° shows the highest intensity for CC-773, while in CC-1073 the highest intensity was at 2θ of 37° and 45° corresponding to solid solutions. This indicates that the higher calcination temperature, the higher crystallinity of solid solutions showed.
The H2-TPR measurements were carried out to clarify the interaction between nickel species and support. Fig. 2 shows the TPR profiles of Ni–Mg–Zr–La/Al2O3 catalysts calcined at different temperatures. The catalysts calcined at 773, 873 and 973 K all exhibited only one reduction band corresponding to the reduction of dispersed nickel oxide that would surely interact with the alumina support. With increasing the calcination temperature, the reduction peak shifted to the higher temperature indicated the increasing difficulty for reducing the nickel oxide. As the calcination temperature increased to 1073 K, two reduction peaks were obviously identified. The peak at low temperature referred to the reduction of the dispersed nickel oxide interacting with the support, while that at high temperature was the reduction of solid solutions phase, i.e., NiAl2O4 or Ni–Mg solid solution.41–49
![]() | ||
Fig. 2 H2-TPR profiles of Ni–Mg–Zr–La/Al2O3 catalysts calcined at different temperatures in preparation. |
After reducing by temperature programmed from 393 K to 1073 K at 5 K min−1 in 10 vol% H2 of N2-base, the four catalysts all showed additional diffraction peaks of metallic Ni at 2θ of 44.5°, 51.8° and 76.3° corresponding to its (111), (200) and (220) planes in Fig. 1(b), respectively. However, the intensity of the Ni peaks followed an order of CC-1073 < CC-973 < CC-873 < CC-773, which just corresponds to the above-identified fact that the catalyst had less highly dispersed NiO or the NiO is more difficult to be reduced as calcined at higher temperature.
The variations of CH4 concentration in the product gas shown in Fig. 3(b) demonstrated the same results. The concentration was 18–22 vol% for the first sets of tests at 823 K and followed the same order of CC-1073 > CC-973 > CC-873 > CC-773 from high to low CH4 contents. Alternating the reaction temperature from 823 K to 923 K obviously decreased the CH4 content in the produced gas to 8–10 vol%, showing the hydrodynamic limitation due to equilibrium as well. Lowering the temperature again to 823 K from 923 K did not fully restore the CH4 content for CC-1073, and it was only about 18.5 vol% against 21 vol% for the tests at the first 823 K. As for all the other catalysts, the CH4 content only slightly decreased (less than 1 vol%). These made the order of CH4 content to become CC-973 > CC-1073 > CC-873 > CC-773, the same as the CO conversion in Fig. 3(a). For the following temperature alternations between 823 K and 923 K, such an order of relationship in the CH4 content did not change, while the CH4 content very slightly decreased with extending the reaction time for all catalysts to indicate their slow deterioration (not fully deactivation) with processing of methanation reactions.
In summary, one can see from Fig. 3 that the catalysts calcined at 773, 873 and 973 K did not have dramatic change in activity and selectivity during alternations of the methanation temperature between 823 K and 923 K. The catalyst calcined at 973 K showed the highest activity and selectivity for methanation, while that at 773 K did the lowest. Consequently, the suitable calcination temperature for the tested Ni–Mg–Zr–La/Al2O3 catalyst is possibly about 973 K.
Referring to the previous study,33 at least two types of deposited carbon would be found on the Ni/Al2O3 catalysts. The first assigned to the reactive amorphous carbon (Cα) was oxidized around 550 K or below 680 K, while the oxidation of the second type was at temperatures above 680 K (e.g., 680–930 K) to indicate its nature as the inactive graphitic carbon (Cγ). Fig. 4 shows the TPO curves of all the spent catalysts. It can be seen that the oxidation of the carbon on CC-1073 occurred in a wide temperature range of 530–900 K, while for the other catalysts this occurred between 740 K and 900 K. This indicates that both Cα and Cγ were deposited on the surface of the CC-1073 catalyst, whereas for the other catalysts it was mainly Cγ. Meanwhile, the CC-1073 had a distinctively large peak of released CO2 than all the other three catalysts did. This complies with its highest intensity of diffraction peak for graphite shown in Fig. 1(c) and also the highest carbon amount measured in Table 1 for CC-1073. It has been reported that for high-temperature methanation (e.g., >800 K), the formed reactive carbon (Cα) would convert to inactive graphitic (Cγ) to encapsulate the metal particles and plug micro and meso pores to speed up the deactivation of catalyst.50 Therefore, for high-temperature methanation (>800 K), the catalyst deactivation would be mainly due to the formed inactive carbon (Cγ). The much higher inactive carbon deposition as well as the large amount of active carbon Cα for CC-1073 clarified that it is much easier to form carbon deposition over this catalyst and thus causes catalyst deactivation, as was demonstrated by the methanation tests shown in Fig. 3.
![]() | ||
Fig. 4 TPO profiles of spent Ni–Mg–Zr–La/Al2O3 catalysts after 20 h methanation shown in Fig. 3. |
Fig. 5 shows the TEM images of the Ni–Mg–Zr–La/Al2O3 catalysts calcined at different temperatures. For the reduced catalysts in the first row one can see that the Ni particles (black spots) were uniformly dispersed and the average size based on 50 Ni particles was found to be about 12 nm, 19 nm and 10 nm for the reduced CC-773, CC-973 and CC-1073, respectively. After methanation for about 20 hours in Fig. 3, metal sintering was identified for the CC-773 and CC-1073 samples in Fig. 5(d) and (f). For the spent CC-1073 in Fig. 5(f), the average Ni particle size was estimated to be about 42 nm, and carbon nanofibers obviously presented on the surface of the catalyst, as shown with the dashed-line circle. The carbon deposition requires some adjacent nickel atoms, and the catalyst with the larger nickel particles is more vulnerable to deposit carbon than that with the smaller particles.51,52 Although CC-773 and CC-1073 had the similar nickel particle sizes, the latter had obviously lower surface area to cause its more adjacent nickel atoms to make it easily occur the carbon deposition for higher carbon deposition.
![]() | ||
Fig. 5 TEM images of reduced and spent Ni–Mg–Zr–La/Al2O3 catalysts for (a) reduced CC-773, (b) reduced CC-973, (c) reduced CC-1073, (d) spent CC-773, (e) spent CC-973 and (f) spent CC-1073. |
The possibly weak interaction between nickel oxide and support increased the amount of Ni0 exposing on the surface of the reduced CC-773 catalyst. This in turn accelerated the loss and sintering of the active Ni, as verified in Fig. 5(a) and (d) where the average Ni particle size increased by about 39 nm by the 20 h continuous methanation test. If the interaction between nickel oxide and the support is strong enough, an active site Ni0 formed in catalyst reduction would be surrounded by several Al2O3 molecules.53 This thus hinders the aggregation of Ni0 and improves the catalyst stability. As justified in Fig. 5(e), there was only a slight change in the Ni particle size for the catalyst calcined at 973 K (CC-973) after the 20 h methanation reaction. The average Ni particle size was found to be 25 nm for the spent CC-973, which would be the proper crystal size (about 20–100 nm) for methanation.5,54
The catalyst calcined at high temperature as 1073 K possessed a small surface area (Table 1) but strong interaction between nickel oxide and support (Fig. 2) leading to small dispersed metallic nickel particles (Fig. 5(c)). The realized CO conversion was initially the highest for this catalyst in spite of its least active sites. The surface area was actually too small to disperse the active sites so that the growth and sintering rate of Ni particles was higher. Thus, its larger Ni particles accelerated the carbon deposition. The more deposited carbon and also fewer active surfaces would both deactivate the CC-1073 catalyst. As a consequence, a moderate metal-support interaction in the Ni/Al2O3 catalyst would be necessarily needed for high activity and high stability of a catalyst for syngas methanation.
![]() | ||
Fig. 6 XRD patterns of CC-973 catalyst (a) reduced at different temperatures and (b) after methanation over such catalysts (solid solutions include NiAl2O4, MgAl2O4 and Ni–Mg solid solution). |
Fig. 7(a) shows the H2-TPR diagrams for the preceding catalysts. For the original CC-973 (calcined) catalyst, only one reduction peak was observed above 850 K and at a peak temperature of 997 K. The reduced samples had essentially two peaks, one centering at a temperature below 700 K and the other between 1150 K and 1180 K. The results obviously show that the lower temperature of H2 consumption in Fig. 7(a) should be attributed to the reduction of NiO formed as the reduced catalyst was exposed to air and partially oxidized. Correspondingly, the higher temperature of H2 consumption should be assigned to the reduction of nickel aluminates. In order to further verify the two types of nickel species, the H2-TPR analysis was also conducted for CR-973 and CR-1073 after they experienced a TPO test which is being heated from 373 K to 923 K at a rate of 5 K min−1 in a N2-base gas flow containing 10 vol% O2 and in turn held at 923 K for 60 min. From Fig. 7(b) one can also identify two reduction peaks for both the catalysts. One was at 690–730 K and the other at 1090–1180 K. The former should represent the actually available active sites in the catalyst for syngas methanation that is usually at temperatures below 973 K. Via the base line in Fig. 7(b) one can calculate the ratio S1/S2 of the two reduction peaks in H2-TPR. It shows essentially the amount ratio of the reduced NiO to nickel aluminates, thus quantifying the reduction degree of nickel species. The reduction extent is then higher for CR-1073 than for CR-973 because the values of S1/S2 were 17.4 and 1.6, respectively. In fact, at 1073 K most of nickel aluminate was reduced, as shown by the H2-TPR curve of the original CC-973 sample in Fig. 7(a).
Fig. 8 shows the variations of CO conversion and CH4 concentration in the product gas for atmospheric methanation performances over the catalysts CR-973 and CR-1073 in alternating the reaction temperature between 823 K and 923 K. The adopted conditions were a H2 flow of 240 mL min−1, a CO flow of 80 mL min−1 and a SV of 27 NL g−1 h−1. Overall, the performance was much better over CR-973 than over CR-1073. Although raising the reaction temperature from 823 K to 923 K decreased the CO conversion from 71% to 38% over CR-973, this lowered conversion was still 30% higher than the highest CO conversion realized over CR-1073. In the continuous 25 h test, the CO conversion and also CH4 content in the product gas slightly decreased with reaction time over both the catalysts. This shows that there was slight deactivation of the catalysts. Correlating with Fig. 7(a) shows that the CR-973 had relatively less active NiO sites but obvious nickel aluminates, which made it possess the higher activity in Fig. 8. The too high reduction degree at 1073 K, which removed most nickel aluminates, resulted in obviously lower activity and also lower stability of the catalyst for methanation.
Fig. 6(b) shows the XRD patterns of the spent catalysts after the methanation tests in Fig. 8. An obvious diffraction peak at 2θ = 26.3° revealed the deposition of graphite on the surface of CR-1073 during the atmospheric methanation. The total carbon amount from the infrared carbon–sulfur analysis shows that the CR-1073 catalyst had a distinctively high carbon deposition of 31.9 wt%, whereas the deposited carbon on CR-973 was only 5.0 wt% for the same tested time in Fig. 8. The distinctively different amounts of deposited carbon for both CR-973 and CR-1073 were further demonstrated in the TPO tests shown in Fig. 9. There, the CO2-emission peak appeared around 830 K indicated the inactive graphite carbon Cγ, while the emission peak was distinctively larger for CR-1073 than for CR-973.
![]() | ||
Fig. 9 TPO results of spent CR-973 and CR-1073 after atmospheric methanation tests for 25 h as shown in Fig. 8. |
Fig. 10 shows the TEM images of the different catalysts based on CC-973. The NiO particles were uniformly dispersed in Fig. 10(a) with an average particle size of 7 nm for the original CC-973 (calcination only). After reduction, the average Ni crystal size was about 15 nm in Fig. 10(b) for CR-973 and 24 nm in Fig. 10(d) for CR-1073. Thus, the too high reduction temperature converted most nickel and caused the most serious sintering of Ni0 to lower the methanation activity and its stability. Fig. 10(c) shows that the methanation via Fig. 8 did not significantly affect the morphology of the catalyst CR-973 (versus Fig. 10(b)). For the spent CR-1073 in Fig. 10(e), though its average Ni crystal size was about 25 nm (against Fig. 10(d)), some aggregated large Ni particles were obviously present on the catalyst. This would not only decrease the number of active sites and the active surface but also accelerate the carbon deposition on the catalyst to quickly deactivate the catalyst.
![]() | ||
Fig. 10 TEM images of catalysts (a) CC-773 (calcined only), (b) CR-973, (c) spent CR-973, (d) CR-1073 and (e) spent CR-1073. |
As a consequence, one can conclude from the above tests that certain nickel aluminate in the catalyst is indispensable to the expected activity and also stability of the Ni/Al2O3 catalysts for syngas methanation at high temperatures such as above 823 K. Ruckenstein et al.55 found that the strong metal-support interaction weakens the catalytic activity of nickel but it also hinders the Boudouard reaction which is the major source of carbon deposition in methanation. The nickel crystallites decorated with discontinuous interfacial layer of nickel aluminate is also considered to be critical for high sintering resistance of the Ni/Al2O3 catalyst.56 Overall, it can be seen that it is critically important to optimize the ratio of two types of nickel species in the methanation catalyst for ensuring the good catalytic activity and stability.
The similar methanation tests over the catalyst calcined at 973 K but reduced at different temperatures revealed that the sample with the lower ratio of reduced NiO to nickel aluminates (1.6) from the reduction at 973 K showed the higher activity, better stability and less carbon deposition than that reduced at 1073 K with the higher ratio (17.4) that implies the deep reduction of all Ni species. All of these results show consequently that only the Ni/Al2O3 catalyst with moderate interaction between metal and support leading to the coexistence of NiO and nickel aluminates at suitable ratios, such as the catalyst calcined and reduced at 973 K, can have reasonably good and stable activity for syngas methanation at temperatures above 823 K. Nonetheless, more studies are required to clarify the optimal ratios between such two types of nickel species.
This journal is © The Royal Society of Chemistry 2015 |