DOI:
10.1039/C4RA11684D
(Paper)
RSC Adv., 2015,
5, 5667-5673
A regular rippled pattern formed by the molecular self-organization of polyvinylpyrrolidone encapsulated Ag nanoparticles: a high transmissive coating for efficiency enhancement of c-Si solar cells†
Received
2nd October 2014
, Accepted 8th December 2014
First published on 8th December 2014
Abstract
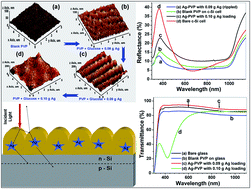
The formation, characterization and application of polyvinylpyrrolidone (PVP) encapsulated silver nanoparticles with a regular rippled pattern is reported. The metal precursor was reduced by an in situ reduction technique, where glucose was used as an organic and mild reducing agent to control the process. In order to create the rippled structured of the film by molecular self organization of the encapsulated Ag nanoparticles, the concentrations of the reactants were optimized. The structural properties of the deposited films were established by X-ray diffraction, transmission electron microscopy, atomic force microscopy and dynamic light scattering techniques. Atomic force microscopy (AFM) revealed a highly ordered ripple structure of the film, which originated due to the self organization of the Ag nanoparticles in the PVP matrix, whereas, transmission electron microscopy (TEM) revealed the core–shell structure of the Ag/PVP unit. UV-vis spectrophotometric analysis resulted in a broad absorption peak between 350 to 500 nm (centered at 418 nm), which is characteristic of Ag nanoparticles. A notable reduction in reflectance and an increase in transmittance, leading to an enhancement in the overall efficiency, were observed when the rippled pattern was spin-coated on a c-Si solar cell.
1. Introduction
Silver nanoparticles (NPs) have attracted the attention of researchers due to their extraordinary size dependent properties and various applications in different fields of cutting edge science and technology over other metal nanoparticles.1 Ag nanoparticles exhibit unique optical properties which may be used in solar photovoltaics for efficiency enhancement and also in Localised Surface Plasmon Resonance (LSPR) based optical biosensors.1 However, the problem with bare Ag-NPs is their instability. Such metal nanoparticles may be stabilized by embedding them in a polymer matrix, which can show unique morphological, structural and optical properties. Zielinska et al.2 and Banerjee et al.3 reported the formation of Ag nanoparticles with different morphologies by reduction with organic and inorganic agents. A number of materials can be used as protecting agents in the synthesis of Ag-NPs, among which polyvinylpyrrolidone (PVP) is one of the best polymers. As reported, PVP can control the aggregation as well as the reduction rate of Ag+ ions3,4 by forming a complex compound with the Ag+ ions. PVP also has longer stability for the protection of silver colloids from agglomeration compared to other available protecting agents. Various reports are available which show that by changing the ratio of PVP and Ag+ ions, the size and shape of the Ag-NPs can be controlled precisely.5 The use of other reducing agents like citrates6,7 and glucose3,8,9 have also been reported. However, the shape and size tenability was not so precise in these cases. For the deposition of Ag-NPs, many synthetic routes like electrochemical, chemical, UV-irradiation, thermal evaporation, sputtering, and hydrothermal processes may be applied.5–7,10 Among them, the chemical route is cost effective and can easily be controlled. The refractive index of PVP falls within 1.552 to 1.518 (within the spectral range 400–1000 nm), which is higher than air (1) but lower than c-Si (∼3.42) within the same spectral range. The extinction coefficient (2.07 × 10⁻³) and absorption coefficient (443.53 cm−1) of PVP also have moderately higher values. These physical parameters indicate that the metal nanocomposite system formed using PVP as the host matrix may be useful for better light trapping.
In our present study, we report the synthesis of PVP encapsulated Ag-NPs by a facile chemical route and a detailed study on their structural, morphological and optical characterization, as well as an application of such a regular rippled pattern for better light harvesting, leading to the enhanced efficiency of c-Si solar cells.
2. Materials and methods
In the experiment, the chemicals used were AgNO3 (99.9% Sigma-Aldrich), PVP K30 (average molecular weight 40
000, Sigma-Aldrich), glucose (anhydrous, 99.5% Sigma-Aldrich). All of the chemicals were of AR grade and used without further purification. Redistilled water was used to prepare all the solutions. For the in situ preparation of Ag colloids, the chemical reduction method was employed using the following scheme and Fig. 1:
Glucose + AgNO3 + PVP → PVP encapsulated Ag colloidal solution. |
 |
| Fig. 1 Reaction mechanism for PVP capped Ag-NP formation. | |
In a typical process, 42 mg of glucose was dissolved in 100 mL of redistilled water and the solution was heated to 80 °C with continuous stirring. To this solution, 5 g of PVP K-30 and 0.09 g AgNO3 were added simultaneously. The mixture was stirred at 500 rpm for 30 minutes at the same temperature to dissolve the PVP completely. The resulting solution was light yellow in colour. The involved chemical reactions may be represented in the following manner:
|
AgNO3(aq)⇄Ag(aq)+ + NO3(aq)−
| (1) |
|
Ag(aq)+ + PVP(aq) → [Ag(PVP)](aq)+
| (2) |
|
[Ag(PVP)](aq)+ + CH2OH–(CHOH)4–CHO(aq) → CH2OH–(CHOH)4–COOH + [Ag(PVP)]
| (3) |
On addition of PVP to the aqueous AgNO3 solution, the complex compound [Ag(PVP)](aq)+ was first formed. Thus, the Ag+ ions were stabilized by the large PVP molecules, which also restrain the reactions favorably. The complex compound [Ag(PVP)]+ was then reduced by the mild reducing agent, viz. glucose as per the chemical reaction (c), giving rise to the Ag–PVP core–shell like structure.
With the introduction of PVP, the Ag+ ions coordinate with the nitrogen (N) end of PVP by electrostatic interaction. Zhang et al.11 have explained the possible mechanism for the Ag–PVP core–shell formation. Though the pyrrolidyl group exerts a steric effect on the coordination between N and Ag+, in PVP, the N atom is a more active donor centre than the double bonded oxygen (O) atom due to the low electronegativity and high donor density of the former. Zhang et al.11 also mentioned that, for the metal nanoparticles/ions with shorter dimensions (nano-range), which is also the case here, the electrostatic interaction predominates over the steric effect. The coordination between the pyrrolidyl N of PVP and the Ag+ ion helps to keep the polymeric alkyl chain outside, thus forming the Ag–PVP core–shell like structure with Ag as the core and PVP as the shell.
Two other solutions were also prepared following the same procedure as above, but with different amounts of AgNO3, that is 0.08 and 0.10 g respectively, to note any change in the structural properties of the Ag–PVP system that might occur due to the varying concentrations of AgNO3. Glass slides with an active area of 2 × 1 cm2 were cleaned using dilute hydrochloric acid (concentration 2 M), rinsed with water, and boiled in methanol to remove any oily substances adhering to the slides. Finally, the slides were rinsed well with redistilled water and dried in air. In order to form films from the colloidal samples, 150 μL of each of the above solutions were taken using a micro-pipette and spin-coated at 120 rpm for 5 minutes on the cleaned glass slides, which were then placed inside a hot air oven at 30 °C for 30 minutes to be dried. On heating, the solution adhered to the glass substrate and the colour of the layer darkened to a yellowish brown.
2.1. Characterization
A JEOL 2100F transmission electron microscope, working at an acceleration voltage of 200 kV with a camera length of 10 cm, was used to acquire the TEM images of the Ag–PVP NPs. The TEM samples were prepared by drying a dispersion of diluted Ag–PVP colloids on carbon coated Cu grids (01813-F, Ted Pella, Inc., USA) overnight at room temperature. The X-ray diffraction (XRD) patterns for the Ag–PVP NPs thin films were recorded using a Bruker (D8) X-ray diffractometer with a Bragg–Brentano goniometer, Cu-Kα radiation (λ = 1.54056 Å) and were scanned at a rate of 2 degree per s over a range of 20° < 2θ < 80°. Atomic force microscopy (AFM) with a semi-contact mode (NT-MDT Solver Next) was used to analyze the topography of the deposited Ag–PVP films. Scans were carried out over a 5 × 5 μm area with a speed of 0.5 Hz. A Perkin Elmer Lambda 25 UV-vis spectrophotometer was used to measure the UV-vis absorption spectra of the Ag–PVP NP colloids at room temperature over a wavelength range of 300–800 nm, taking distilled water (Millipore, 18 MΩ) as the reference. Dynamic light scattering (DLS) experiments were carried out on the Ag–PVP NPs to determine their particle size distribution using a Malvern Laser Particle Size Analyzer – Zetasizer 1000 HS (UK). Successive half dilutions and ultrasonication were carried out before each set of experiments. A Shimadzu made Solid Spec – 3700 UV-vis-NIR spectrophotometer was used to perform the reflectance and transmittance measurements. The current–voltage (I–V) measurements were carried out using an Oriel Sol 3A Solar Simulator (Model-94023A). TEM, XRD, DLS and UV-vis experiments. All experiments were carried out using three different Ag loadings, viz. 0.08 g, 0.09 g and 0.10 g. However, the results for the optimized (for rippled formation) Ag loading, i.e. 0.09 g have been provided here in order to avoid redundancy.
3. Results and discussions
3.1. Structural characterization by TEM and XRD
The PVP encapsulated Ag-NPs (denoted as Ag–PVP) were characterized using TEM and XRD to determine the particle shape and size, along with the crystallinity and phase. The bright-field TEM image (Fig. 2) indicates that the Ag–PVP nanocomposites are almost spherical in shape. The darker region indicates the crystalline Ag core, whereas, the encapsulating amorphous PVP layer/shell is indicated by the brighter outside ring. The particle size distribution (PSD) calculated from the TEM image is shown in the inset (a) of Fig. 2. The average diameter of this core–shell like structure, as determined from the TEM PSD calculations is 21 ± 3.5 nm, in which the thickness of the PVP shell is about 1 to 2 nm. The bright dots and distinct rings in the selected area electron diffraction (SAED) pattern (inset b, Fig. 2) is the fingerprint of the formation of metallic nanoparticles. The distance between the lattice planes (d), considering the brightest dots in the SAED pattern, was calculated to be 2.41 Å, which is in good agreement with the standard ‘d’ value (2.359 Å) for a (111) diffraction plane (2θ = 38.11) with 100% intensity of the cubic Ag system.
 |
| Fig. 2 TEM image of PVP encapsulated Ag-NPs (with 0.09 g Ag(NO)3 incorporation). Insets show (a) particle size distribution (PSD) and (b) SAED pattern. | |
The crystalline structure and phase of the deposited Ag–PVP nanoparticles were characterized by an X–ray diffraction technique (Fig. 3). From the figure, diffractions from Ag (111), (200), (220) and (311) planes could easily be identified, which correspond to the face-centered cubic (fcc) (JCPDS 98-002-1923) lattice structure. A similar phase orientation was also reported by Zhang et al.11 The absence of any other peak confirms the phase purity of the deposited Ag–PVP NPs. The average size of the Ag–PVP NPs was calculated using the Scherrer equation [D = Kλ/(β
cos
θ), where, D is the crystallite size, λ is the wavelength of the X-ray radiation, i.e. 0.154 nm, K is a constant usually taken as 0.89, θ is the Bragg angle and β is the full width at half maximum (FWHM) value of the highest intensity peak, which is the (111) peak here and found to be about 25 nm, having good agreement with the TEM PSD calculations. The microstrain (ε) of the Ag–PVP system was calculated using the equation ε = β
cos
θ/4 and found to be about 1.23 × 10⁻³. Such a high value of microstrain is associated with the formation of encapsulated nanoparticles and indicates the compressive stress of the sample.
 |
| Fig. 3 (a) XRD spectrum of the PVP capped Ag-NPs. The line spectra show the cubic fcc Ag reflections along with their relative intensities. | |
3.2. Dynamic light scattering
To determine the particle size of the Ag–PVP system in a colloid, dynamic light scattering (DLS) measurements were performed with increasing dilutions (Fig. 4). The stock solution was diluted by 4, 8 and 16 times using redistilled water and each sample was ultrasonicated for 60 min before the measurement. Two peaks were observed at around 20 nm and 167 nm, which indicate the presence of particles of different sizes in the as prepared colloid. The increase of peak intensity at 20 nm with a corresponding decrease of the peak intensity at 167 nm with increasing dilution is attributed to the unagglomeration of the Ag–PVP NPs. The unagglomerated part has a diameter of about 20 nm, and the agglomerated counterpart has a diameter around 167 nm. With increasing dilution and ultrasonication, the agglomerates with an average size of 167 nm break up and form single encapsulated NPs with diameters of about 20 nm. The two low intensity and broad peaks at around 167 nm in the DLS spectrum for the 16 times diluted colloid indicate the dissociation of large agglomerates into smaller ones with dilution. Two peaks indicate the presence of two different agglomeration/particle sizes in this range, but with low concentrations, as indicated by the reduced intensities of the peaks. Practically, the complete removal of agglomerations by dilution is not achievable, due to the dispersal/dispersion/scattering of agglomerated states, which is also reflected here. The diameter of the PVP encapsulated Ag-NPs (16 times diluted), as obtained from the TEM and XRD analyses, is in close agreement to the findings from DLS measurements.
 |
| Fig. 4 DLS measurements for the Ag–PVP NPs with increasing dilution. | |
3.3. Optical properties
The UV-vis absorption spectra of blank PVP and Ag–PVP films are shown in Fig. 5. The Ag–PVP system showed a broad absorption peak between 350 to 500 nm (centred at 418 nm), which is characteristic of Ag nanoparticles, whereas, no such peak was observed for the blank PVP film. This again confirms the formation of Ag nanoparticles. The optical properties obtained from UV-visible spectroscopy may also be used to ascertain the size distribution of metal NPs in a composite system. The resonance bands of the plasmonic nanocrystals are mainly dependent on the distribution of the electromagnetic field on the surface of the metal nanocomposites. In other words, metal nanoparticles with different shapes and sizes should have different optical signatures like different absorption bands. In this case, the extinction spectra of PVP encapsulated Ag-NPs have a main resonance peak at 418 nm, exhibiting a blue-shift and an almost uniform size distribution, which corresponds to our experimental results.
 |
| Fig. 5 UV-vis spectra for blank PVP and PVP encapsulated Ag-NPs obtained by the incorporation of 0.09 g Ag(NO)3. | |
The XRD patterns we have obtained were almost the same for the three different Ag loadings. However, minor changes were observed in the TEM, DLS and UV-vis spectra, which are not included in the manuscript to avoid redundancy. For instance, for 0.08 g Ag loading, the TEM and DLS results showed a slightly smaller particle size distribution (19 ± 3 nm), with a peak in UV-vis spectrum at around 414 nm. On the other hand, for 0.10 g Ag loading, the TEM and DLS results showed a greater particle size distribution (25 ± 3 nm) and agglomeration, with a peak in UV-vis spectrum at around 430 nm. This might be related with the concentration change of the Ag reinforcement in the PVP matrix.
3.4. Topography
The topographical analysis of the blank PVP and the Ag–PVP films deposited on glass substrates were carried out using AFM, as shown in Fig. 6. In order to study the effect of Ag incorporation in the PVP matrix, Ag precursors with different weight percentages were introduced, as mentioned earlier. It has been found that, for the formation of a regular rippled pattern of the Ag–PVP film, a particular weight percentage of Ag, i.e. 0.09 g (keeping other parameters fixed), is required.
 |
| Fig. 6 AFM images of the blank PVP film (a) and Ag–PVP films with the same concentration of PVP as in (a) but also with Ag-NPs incorporated into them, giving rise to the rippled patterns, with Ag contents of 0.08 g (b), 0.09 g (c), and 0.10 g (d). | |
The surface morphology of the layers seems to change from flat to rippled structures with an increase in Ag concentration. Fig. 6(a) shows the flat structure of the blank PVP films on glass, while Fig. 6(b) indicates the initiation of the rippled pattern with 0.08 g Ag loading. With 0.09 g of Ag loading into the polymer, the rippled structure became distinct and regular (Fig. 6(c)). The average peak amplitude of such ripples was found to be about 200 nm, with a half wave period of about 1 μm. On further increasing the Ag content to 0.10 g, the rippled pattern was found to get ruptured as shown in Fig. 6(d), which might be attributed to the agglomeration of the Ag-NPs in the PVP matrix. The formation of such a regular grating-like pattern might be attributed to the self organization of the Ag-NPs in the polymer matrix at a particular concentration. Adachi et al.12 reported the formation of similar structures from a suspension droplet and also offered an explanation. According to them, when a suspension droplet dries on a solid substrate, striped patterns of particles are often observed. The droplet contact lines shrink toward the centre of the droplet with an oscillatory motion, causing the generation of a particle-array film at the contact lines. Such a shrinking motion can broadly be classified as the “stick-slip” motion. However, the motion observed in our case for the Ag–PVP colloid is different from the common “stick-slip” motion as described by Adachi et al.12 In general, an object undergoing the stick-slip motion periodically converts its kinetic and internal energy to thermal energy. The periodic energy dispersion is caused by coupling of the friction at the contact surface with the object motion. In addition to the energy dispersion, the motion of the suspension droplet accompanies discharges of suspended particles (here PVP encapsulated Ag) from the inside to the boundary of the droplet. The particles assemble to form a particle-array at the droplet contact line, which is caused by particle flow induced by the evaporation of solvent from the film surface near the receding contact lines. Therefore, this process is called the convective self-assembly of particles, which characteristically occurs in the thin liquid layer of particle suspensions. Since the particle flow is viscous, it impinges on the stick-slip motion of the droplet as a source of friction at the droplet contact line. On the other hand, the shrinking motion influences the self-assembly of the particles. For this reason, such a coupled system shows a definite pattern or structure in the final particle-array of the film.
Grating patterns like these can be useful as plasmonic structures in solar cells for efficiency enhancement. The fabrication process reported here is highly reproducible and controllable.
3.5. Transmittance and reflectance
Both transmittance and reflectance characteristics of the deposited materials should be explored to have an idea about the light harvesting capabilities. The better is the transmittance with lower reflectance, the better will be performance. In order to study the light transmission properties of PVP and Ag–PVP composites with different Ag loading, films were prepared on a transparent base substrate i.e. cleaned glass slides as mentioned in the Section 2. Fig. 7 represents the wavelength vs. transmittance plot of different films. It has been found that the bare glass substrate showed an almost steady transmittance between 85% to 90% within the wavelength range 1100–400 nm (curve a), whereas, for only PVP coating on glass, the transmittance was found to be lowered down in a flat manner throughout the entire wavelength range resulting in an almost linear feature. At 1100 nm, the transmittance was about 80% and at 400 nm, it was about 85% (curve b). On the other hand, the rippled pattern formed on glass by 0.09 g Ag loading in PVP matrix was found to show an enhancement of transmittance than the bare glass within the entire wavelength range i.e. 1100 to 400 nm. At 1100 nm, the transmittance was about 87% and at 400 nm it was 94% for the rippled pattern (curve c). When Ag–PVP film with higher Ag loading (0.10 g) was spin-coated on the glass, transmittance was steady within the wavelength range 1100 to 800 nm, and then a drastic fall in transmittance to 22% (∼400 nm) was observed (curve d). This indicates a huge loss of light that is to be transmitted and hence, this composition will not serve as a good light transmitter. This might be the result of agglomeration of Ag-NPs in the PVP matrix, resulting in some mirror-like nature of the film. The results indicate that, the rippled pattern obtained by self assembly of PVP in presence of 0.09 g Ag incorporation, has the best light transmitting property than bare glass, pure PVP coating and Ag–PVP with higher Ag content. This might be associated with the internal reflections between the ripples and optimum light scattering by the encapsulated Ag-NPs in the PVP matrix.
 |
| Fig. 7 Wavelength vs. transmittance plot for (a) bare glass, (b) blank PVP on glass, (c) Ag–PVP with 0.09 g Ag and (d) Ag–PVP with 0.10 g Ag loading. | |
For the study of light reflectance properties of blank PVP and different Ag–PVP composites, the films were spin-coated on an opaque substrate. In this case, it was a finished c-Si solar cell (SiNx coated) with an active area of about 37 cm2 (6.1 cm × 6.1 cm overall cell dimension), purchased from Bharat Heavy Electricals Limited (BHEL). The spin-coating was done at 120 rpm for 5 minutes by adding four subsequent sets of 150 μL of respective colloids. The films were then dried in a hot air oven at 30 °C for 30 minutes. Fig. 8 represents the wavelength vs. reflectance plot of different films, from which, it is evident that the bare c-Si cell has the highest reflectance of about 39% at ∼400 nm (curve d) and the Ag–PVP composite with 0.09 g Ag content has the lowest reflectance of about 12.9%. At 400 nm, the blank PVP showed a reflectance that was about 7.5% lower than 0.10 g Ag loaded PVP and the trend was maintained up to 450 nm. Within 450 to 1000 nm, the reflectance of blank PVP was 3.5% lower than the 0.10 g Ag loaded PVP. From 1000 nm onwards (up to 1150 nm), i.e. in the longer wavelength range, a sharp rise in reflectance (up to 36.7%) was observed for the 0.10 g Ag loaded PVP, whereas, within this wavelength range, the reflectance of the blank PVP was notably low and almost similar to the 0.09 g Ag loaded PVP. From Fig. 8, it is also evident that, within a broad spectral region (500 to 1500 nm), the reflectance of the 0.10 g Ag loaded PVP was higher than the bare c-Si cell, making this composition less suitable for light harvesting compared to the bare c-Si cell over this broad region. On the other hand, the reflectance of the blank PVP coating was higher than the bare c-Si cell over a comparatively small spectral region of 550 to 800 nm. This means that the blank PVP coating is not so efficient at harvesting most of the visible region of the incident light in comparison to the bare c-Si cell. The lowest reflectance shown by the 0.09 g Ag loaded PVP matrix is attributed to the successive internal reflection and absorption/transmission of the light on the walls of the ripples, which originated due to the self organization of the large PVP molecules in the presence of silver. So, it can be surmised that such a rippled pattern may be useful as a top coating material to enhance the efficiency of solar cells due to their better light transmitting properties with lower reflectance, leading to good light harvesting capabilities.
 |
| Fig. 8 Wavelength vs. reflectance plot for (a) Ag–PVP with 0.09 g Ag, (b) blank PVP on c-Si cell, (c) Ag–PVP with 0.10 g Ag loading and (d) bare c-Si cell. | |
3.6. Current–voltage characteristics
Fig. 9 represents the current–voltage (I–V) characteristics of the bare c-Si cell and the cell with three different top coatings, as mentioned earlier. The bare cell showed an initial efficiency of 14.34% with Voc = 0.601 V and Isc = 0.859 A. When such a cell was coated with the Ag–PVP ripples, the Voc and Isc were found to increase to 0.613 V and 0.878 A, respectively, leading to an increase in the overall efficiency to 14.71%. The increase was about 2.58% with respect to the bare cell efficiency, which has been achieved through a facile route. On the other hand, for the blank PVP and the 0.10 g Ag loaded PVP, we observed a decrease in both the Voc and Isc and the overall cell efficiency as well. The results have been summarized in Table 1. Such enhancement of cell efficiency by the rippled Ag–PVP coating may be principally caused by the simultaneous internal reflection of the incident light from the surface of the ripples, leading to loss minimization of light, as well as the favourable scattering of the absorbed light by the Ag atoms embedded in the PVP matrix, as shown in Scheme 1. Such optical coupling was also reported by Pi et al. for Si quantum dot ink printing on the surface of multicrystalline silicon solar cells.13 However, the reason behind the increase in Voc is not very well understood at present and needs detailed investigation. In a word, such a pattern can significantly act as an anti-reflection coating as well as a plasmonic layer, thus resulting in better light harvesting capabilities.
 |
| Fig. 9 Current–voltage characteristics of the bare c-Si cell (a) and c-Si cells coated with Ag–PVP ripples (b), blank PVP (c), and Ag–PVP with 0.10 g Ag loading (d). | |
Table 1 Comparison of the solar cell efficiencies of different top coatings
Sample |
Voc (V) |
Isc (A) |
Fill factor (%) |
Efficiency (%) |
Bare c-Si cell |
0.601 |
0.859 |
72.25 |
14.34 |
c-Si cell with only a PVP coating |
0.592 |
0.764 |
70.83 |
12.32 |
c-Si cell with rippled structure |
0.613 |
0.878 |
71.07 |
14.71 |
c-Si cell with 0.10 g Ag loaded PVP coating |
0.581 |
0.630 |
68.04 |
9.57 |
 |
| Scheme 1 Schematic for enhanced light harvesting capabilityies shown by the Ag–PVP rippled pattern. Here, p-Si and n-Si indicate p-type and n-type layers of the crystalline Si solar cell obtained by boron and phosphorous doping, respectively. | |
4. Conclusion
PVP encapsulated Ag-NPs have been successfully synthesized using an in situ reduction and encapsulation technique. TEM, XRD and DLS characterization indicated that the sizes of the Ag-NPs are around 20 nm. The presence of well defined peaks in the XRD pattern confirms the presence of a cubic Ag phase. The 418 nm peak in the UV-vis spectra of the Ag–PVP system verifies the presence of silver NPs. A regular grating-like pattern was observed for a particular concentration of Ag in the PVP matrix due to molecular self organization, which was characterized using AFM. The absence of the rippled pattern for films with the same PVP concentration but without the Ag-NPs indicates that they play an active role in the pattern formation. A notable reduction in reflectance and increase in transmittance, leading to an enhancement in the overall efficiency, were observed when such a rippled pattern was spin-coated on a c-Si solar cell.
Acknowledgements
The author Sudarshana Banerjee is thankful to the Department of Science and Technology (DST), Government of India, for providing her Junior Research Fellowship. The authors would like to acknowledge the encouragement and support received from Prof. A. K. Barua of CEGESS, IIEST.
References
- A. J. Haes and R. P. Van Duyne, J. Am. Chem. Soc., 2002, 124, 10596–10604 CrossRef CAS PubMed.
- A. Zielinska, E. Skwarek, A. Zaleska, M. Gazda and J. Hupka, Procedia Chem., 2009, 1, 1560–1566 CrossRef CAS PubMed.
- S. Banerjee, K. Loza, W. Meyer-Zaika, O. Prymak and M. Epple, Chem. Mater., 2014, 26, 951–957 CrossRef CAS.
- Z. Z. Rafiuddin, Colloids Surf., B, 2012, 90, 48–52 CrossRef PubMed.
- K. S. Chou and C. Y. Ren, Mater. Chem. Phys., 2000, 64, 241–246 CrossRef CAS.
- A. Henglein and M. Giersig, J. Phys. Chem. B, 1999, 103, 9533–9539 CrossRef CAS.
- R. Patakfalvi and I. Dekany, J. Therm. Anal. Calorim., 2005, 79, 587–594 CrossRef CAS.
- H. Peng, A. Yang and J. Xiong, Carbohydr. Polym., 2013, 91, 348–355 CrossRef CAS PubMed.
- V. Gopinath and P. Velusamy, Spectrochim. Acta, Part A, 2013, 106, 170–174 CrossRef CAS PubMed.
- J. E. Millstone, S. J. Hurst, G. S. Metraux, J. I. Cutler and C. A. Mirkin, Small, 2009, 5, 646–664 CrossRef CAS PubMed.
- Z. Zhang, B. Zhao and L. Hu, J. Solid State Chem., 1996, 121, 105–110 CrossRef CAS.
- E. Adachi, A. S. Dimitrov and K. Nagayama, Langmuir, 1995, 11, 1057–1060 CrossRef CAS.
- X. Pi, L. Zhang and D. Yang, J. Phys. Chem. C, 2012, 116, 21240–21243 CAS.
Footnote |
† Electronic supplementary information (ESI) available. See DOI: 10.1039/c4ra11684d |
|
This journal is © The Royal Society of Chemistry 2015 |
Click here to see how this site uses Cookies. View our privacy policy here.