L. Liuab,
W. M. Cuiab,
S. W. Zhangab,
F. H. Kongbd,
M. A. Pedersenc,
Y. Wene and
J. P. Lv*ab
aInstitute of Agro-products Processing Science and Technology, Chinese Academy of Agricultural Science, Beijing, 100193, PR China. E-mail: lvjp586@vip.sina.com; Fax: +861062815542; Tel: +861062819421
bKey Laboratory of Agro-Food Processing and Quality Control, Ministry of Agriculture, Beijing, 100193, PR China
cDepartment of Agronomy and Horticulture, University of Nebraska Lincoln, Lincoln, NE 68583-0915, USA
dSchool of Chemical Engineering and Technology, Tianjin University, Tianjin, 300072, PR China
eChinese Academy for Environmental Planning, Beijing, 100193, PR China
First published on 4th December 2014
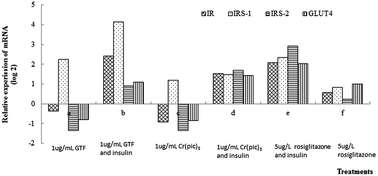
The purpose of this paper was to assess and compare the impact of GTF, CrCl3 and Cr(pic)3 on glucose metabolism and explore the underlying mechanism of GTF in insulin-resistant 3T3-L1 adipocytes. The insulin-resistant 3T3-L1 adipocytes were induced by incubation with insulin for 48 h. Purified GTF from high chromium yeast was used in this study, with a m/z of 769 to 712, and glutamic acid, glycine, and cysteine in an approximate ratio of 1
:
1
:
1. In addition nicotinic acid and Cr(III). GTF, CrCl3, Cr(pic)3 and rosiglitazone (positive control) were applied to the cells. The effective dose of GTF ranged from 0.5 μg mL−1 to 1.5 μg mL−1. GTF decreased cell viability significantly (P < 0.01) at doses of 3 μg mL−1 or higher. Glucose consumption in insulin-resistant 3T3-L1 adipocytes induced by GTF increased significantly (P < 0.05) when incubated with GTF after 12 h. Among GTF, Cr(pic)3 and CrCl3, GTF stimulated glucose consumption is the greatest. In the presence of insulin, the relative expression level of insulin receptor (IR), insulin receptor substrate-1 (IRS-1), insulin receptor substrate-2 (IRS-2) and glucose transporter 4 (GLUT4) mRNA were increased by GTF by 2.4, 4.1, 0.9 and 1.1-fold, respectively, however, only IRS-1 was increased by 2.3-fold in the absence of insulin. GTF affected mRNA levels of IR and IRS-1 significantly (P < 0.01) as compared to the other two. This study not only further demonstrates that chromium containing complexes show promise in reducing insulin resistance in instances of type 2 diabetes, but also that among the chromium complexes, GTF performs the best. Additionally, new mechanistic details of how GTF affects mRNA levels of insulin signalling proteins were revealed.
The best-selling and most studied chromium nutraceutical is chromium picolinate Cr(pic)3. A recent study suggests, however, that when administered intravenously and in the presence of reactive oxygen species, Cr(pic)3 causes damage as it diffuses into cells.2 Compared with Cr(pic)3, organic chromium yeast seems to be a safer form of chromium supplementation. Many studies have reported that supplementation with high-chromium yeast can improve diabetes more efficiently.3–6 When treated with both chromium-enriched yeast and reduced exogenous insulin, type 2 diabetic patients exhibit significantly decreased plasma glucose and glycated haemoglobin when compared to insulin treatment alone.7
GTF is a low molecular weight substance which possesses an ultraviolet absorbance maximum at 260 nm and is comprised of Cr3+, glycine, glutamate, a sulfur-containing amino acid, and nicotinic acid. It stems from the report of Mertz and others on the isolation of brewer's yeast GTF in 1977.8 GTF is named after its original function, stimulating glucose metabolism in fat pad assays, and typically refers to the yeast-derived material. Therefore, the current term GTF may be different from its initial definition or the original composition proposed. Because of the original harsh isolation conditions and a lack of direct structural data, some researchers have suggested that GTF may be an artifact resulting from hydrolysis of porcine low-molecular-weight chromium-binding substance (LMWCr) and that the use of the term GTF should be abandoned.2,9–11 Many experiments have shown that high-chromium yeast enhances the action of insulin and improve diabetes in animals.11–14 In diabetic mice supplemented with high-dose, high-chromium yeast (Cr 1000 μg per kg per day), the number and size of pancreas islet cells decreased in comparison to those in mice supplemented with low-dose high-chromium yeast (Cr 250 μg per kg per day, 500 μg per kg per day) and normal yeast (Cr < 0.1 μg g−1 dry yeast).11
In this study, our previously established mild purification method was used to purify GTF from high chromium yeast.15 It was identified, with mass-to-charge ratios (m/z) of 769 and 712, which included glutamic acid, glycine, and cysteine in an approximate ratio of 1
:
1
:
1, as well as nicotinic acid and Cr(III). Although previous animal experiments have shown that this high chromium yeast could improve type 2 diabetes, especially for pancreas recovery,11 it is not well understood how purified GTF acts directly on the cells, especially 3T3-L1 insulin-resistant adipocytes. Furthermore, the optimum GTF dosage, cytotoxic effect, and differing effects between GTF and other chromium complexes should be determined. To better understand these questions, we applied the purified GTF and other chromium complexes directly on insulin-resistant 3T3-L1 adipocytes and investigated their effect on glucose metabolism. In this study, rosiglitazone, an insulin sensitizer, was used as a positive control to evaluate the ability of GTF and other chromium sources to adjust glucose consumption.
Differentiated cells were then incubated for a period of 48 h in DMEM containing 10% FBS and 100 nM insulin as insulin-resistant cells or in DMEM containing 10% FBS without insulin as the control (normal 3T3-L1 adipocytes), which was used to evaluate the insulin-resistant model. These cells were maintained at 37 °C under a humidified 5% CO2 atmosphere.
The insulin-resistant adipocytes and the control were incubated for a period of 24 h in DMEM with or without 100 nM insulin. Supernatants of these treatments were then collected and the levels of glucose concentration were measured and analysed.
000 r min−1 for 30 min at 4 °C. The supernatants were collected, condensed to the desired volume using vacuum evaporation at 45 °C and then was applied to three chromatography columns (Sephadex G75, Sephadex G25, Sephadex G15) consecutively. The chromium content of the chromatographic effluents was determined by atomic absorption spectrometry using flame atomization. Chromium-containing fractions from these columns were pooled, concentrated, and lyophilized for further cell experiments. All chromatography procedures were carried out in a cold-room maintained at 4 °C.
(A) For the GTF dose response assay, insulin-resistant cells were treated with various concentrations of GTF (calculated as Cr) in the presence or absence of 100 nM insulin for 24 h.
(B) For the GTF time response assay, insulin-resistant cells were treated with GTF (0 μg mL−1, 1 μg mL−1) for a scheduled time in the presence or absence of 100 nM insulin.
(C) For the chromium complex comparison, insulin-resistant cells were treated with 1 μg mL−1 of GTF, Cr(pic)3, and CrCl3 (calculated as Cr) in the presence of 100 nM insulin for 24 h. Rosiglitazone (5 μmol L−1) was set as positive control.
Supernatants of these treatments were collected and glucose concentrations were measured using the glucose assay kit for a quantitative determination. Glucose consumption rates were calculated by subtracting residual glucose in the treated medium from glucose in non-treated medium.
3T3-L1 preadipocytes were plated into a 48-well plate. After following the differentiation and induction protocol, the insulin-resistant cells were exposed to one the following media:
(A) For the dose response assay, cells were treated with medium containing various concentrations (0 μg mL−1, 0.01 μg mL−1, 0.1 μg mL−1, 0.5 μg mL−1, 1 μg mL−1, 1.5 μg mL−1, 3 μg mL−1 and 5 μg mL−1) of GTF (calculated as Cr) in the presence of 100 nM insulin for 24 h.
(B) For the chromium complex comparison, cells were treated with medium containing 1 μg mL−1 of GTF, Cr(pic)3 or CrCl3 (calculated as Cr) in the presence 100 nM insulin for 24 h. Rosiglitazone (5 μmol L−1) was set as positive control.
After incubation for the indicated times, the supernatants were removed. The cells were washed with PBS for three times and replaced with DMEM medium. Then 50 μL of sterile filtered MTT solution (5 mg mL−1) in phosphate buffered saline (PBS, pH 7.4) was added to each well, reaching a final concentration of 0.5 mg mL−1 MTT. After 4 h, the supernatants of cells were removed. Then, formazan crystals formed in the wells were dissolved in 375 μL dimethylsulfoxide (DMSO) and the plates were shaken for 10 min. The absorbance was measured at 490 nm using a Model680 Microplate Reader (BIO-RAD). Cell viability was calculated relative to the untreated control cells: viability (%) = (absorbance of treated sample)/(absorbance of control) × 100.
| Gene | Primes | Tm | Product length | Gene no. |
|---|---|---|---|---|
| β-Actin | GAGACCTTCAACACCCCAGC | 50 °C | 446 bp | NM_007393.3 |
| CCACAGGATTCCATACCCAA | ||||
| Glucose transporter 4 (GLUT4) | ATTGGACGCTCTCTCTCCAA | 50 °C | 168 bp | NM_009204.2 |
| GATTCTGCTGCCCTTCTGTC | ||||
| Insulin receptor (IR) | AAATCGTCAACCTGCTC | 50 °C | 137 bp | NM_010568.2 |
| ATCCAACGGGACATTC | ||||
| Insulin receptor substrate 1 (IRS-1) | GGATCGTCAATAGCGTAA | 50 °C | 232 bp | NM_010570.4 |
| GCTTGGCACAATGTAGAA | ||||
| Insulin receptor substrate 2 (IRS-2) | CATGTCCCTTGACGAGTATG | 50 °C | 225 bp | NM_001081212 |
| TTCCTCAGTCCTCTATCCAG |
As shown in Fig. 1, glucose consumption in insulin-resistant 3T3-L1 adipocytes treated with and without insulin was 6.49 mmol L−1 and 6.19 mmol L−1, respectively. This showed that insulin could not stimulate the insulin-resistant model to consume more sugar. Glucose consumption in normal 3T3-L1 adipocytes treated with and without insulin was 13.8 mmol L−1 and 8.00 mmol L−1, respectively. Glucose consumption in insulin-resistant 3T3-L1 adipocytes and 3T3-L1 adipocytes treated with insulin was significantly different (P < 0.01). This demonstrates that the model of insulin-resistant 3T3-L1 adipocytes was successfully established.
At low doses of GTF (from 0.01 μg mL−1 to 0.1 μg mL−1), there was no significant difference in glucose consumption between 0 nM insulin- and 100 nM insulin-treated cells. As GTF increased (from 0.5 μg mL−1 to 1.5 μg mL−1), the difference in glucose consumption between 0 nM insulin- and 100 nM insulin-treated cells became significant for the 0.5 μg mL−1 treatment and greatly significant for the 1 μg mL−1 and 1.5 μg mL−1 treatments. GTF treatment also increased basal glucose consumption (without insulin) as shown in Fig. 2. At higher doses of GTF, glucose consumption decreased significantly. The difference in glucose consumption between 0 nM insulin- and 100 nM insulin-treated cells was significant (P < 0.05) for 3 μg mL−1 treatment and insignificant at the higher GTF dose.
To further illuminate the effect of GTF on glucose metabolism, insulin-resistant 3T3-L1 adipocytes were exposed to 0 μg mL−1 and 1 μg mL−1 GTF both in the presence and absence of 100 nM insulin, and glucose consumption was evaluated after 2 h, 6 h, 12 h, 24 h, 36 h and 48 h. As shown in Fig. 3, without GTF treatment, no significant difference in glucose consumption was observed for the treatment with and without 100 nM insulin for 48 h. This means that the cell model for insulin resistance in vitro was successfully established. Significant differences in glucose consumption were observed between the treatment with 1 μg mL−1 GTF and without GTF in the presence of 100 nM insulin starting after 6 h of incubation. Interestingly, without insulin treatment, significant differences in glucose consumption between treatment with and without GTF were observed only after 12 h and 24 h of incubation.
As a whole, GTF enhanced glucose consumption significantly in the presence of 100 nM insulin after 6 h and glucose consumption increased to 24.88 mmol L−1 after 48 h. GTF caused a 2.5 and 1.5-fold increase in glucose consumption with and without 100 nM insulin, respectively, after 24 h, and a 2.8-fold and 1.9-fold increase in glucose consumption after 48 h. Considering the glucose consumption rate, half of the glucose in the medium was consumed after 24 h incubation. Almost all glucose in the medium was consumed after 48 h. 24 h incubation periods were used for all further experiments.
In the presence of insulin, rosiglitazone treatment significantly (P < 0.01) increased the level of IR, IRS-1, IRS-2 and GLUT4 mRNA by 2.09, 2.3, 2.9 and 2.04-fold, respectively, whereas, without insulin 0.56, 084, 0.23 and 1-fold changes were observed. Compared with other treatments, rosiglitazone had a greater effect (P < 0.01) on IRS-2 and GLUT4 in the presence of insulin. GTF alone enhanced the level of IRS-1 mRNA much more than rosiglitazone alone (P < 0.01).
The effects of GTF on insulin-resistant 3T3-L1 adipocytes were examined, including its optimal dose and incubation time [Fig. 2 and 3]. Fig. 2 shows that GTF could increase both basal (0 nM insulin) and insulin-stimulated glucose consumption in the insulin-resistant cells to different degrees. However, only when GTF reached 1 μg mL−1, glucose consumption in basal cells was significantly higher than its corresponding control in the absence of insulin. In the presence of insulin, a minimum GTF concentration of 0.1 μg mL−1 increased glucose consumption significantly for insulin-resistant 3T3-L1 adipocytes. It was apparent that there is a potentiation of GTF effect in the presence of insulin. Glucose consumption was significantly higher after GTF treatment in the presence of insulin when compared to GTF treatment without insulin at GTF concentrations between 0.5 and 3 μg mL−1. Yi-qun and Ming-hui reported that a significant difference in glucose uptake was observed for insulin-resistant cells treated with and without Cr(pic)3 in the absence of insulin. They suggested that effects of Cr(pic)3 were independent of insulin, which could be regarded as an insulin analogue.28 It is our finding, however, that the activities of insulin and GTF are not independent.
As shown in Fig. 3, significant differences could be observed between 1 μg mL−1 and 0 μg mL−1 GTF treatments from 6 h to 48 h incubation time. GTF significantly increases glucose consumption in a dose-dependent manner in the presence of insulin, especially at concentrations between 0.1 μg mL−1 (P < 0.05) to 1.5 μg mL−1 (P < 0.01), suggesting GTF could partially reduce hyperglycemia and insulin-induced insulin resistance.
Previous studies show that Cr bioavailability of different chromium complexes varies greatly, and Cr absorption ranges between 0.4% and 2.0% for inorganic complexes while the availability of organic Cr is more than 10 times higher.21,22 Chromium complexes will break down in the digestive system when administered orally. If they are administered intravenously or applied to the cells directly, chromium complexes briefly diffuse into the cells and affect the cells' metabolism.23 Three chromium complexes were applied to the cells separately in this study. CrCl3, as inorganic chromium, is authorized to be used as food fortifier in China. At a dose of 1 μg mL−1 Cr, no cytotoxic effect was observed with any of the three chromium complexes. While in the case of glucose consumption, these chromium complexes exhibited different effects. GTF could increase glucose consumption most significantly (P < 0.01), followed by Cr(pic)3 and CrCl3.
The pathophysiology of insulin resistance involves a complex network of signalling pathways, activated by the insulin receptor, which regulates intermediary metabolism and its organization in cells. Insulin receptor substrate (IRS) proteins are a family of molecules that are directly phosphorylated by the insulin receptor, which leads to the recruitment and activation of additional signalling proteins.24 Insufficient expression of IRS-1, IRS-2 or abnormal phosphorylation will affect glucose metabolism and lipid metabolism during signalling pathways. Weksler-Zangen et al. applied GTF on the 3T3-L1 adipocytes and suggested that GTF does not exert its effects via the insulin receptor but in a different pathway.25 In their study, however, the GTF did not include chromium. The requirement of chromium in GTF preparation is still controversial.
Understanding the molecular basis of the mechanism of action of GTF and insulin is of crucial importance. Based on the cytotoxicity and cell metabolism study, the effects of GTF, Cr(pic)3 and rosiglitazone on the levels of IR, IRS-1, IRS-2 and GLUT4 mRNA in the insulin resistant adipocytes were examined. Earlier reports showed that GTF's natural function was to bind insulin, enhancing its interaction with insulin receptor.26 Vincent thought that GTF did not have an intrinsic activity in the cells but was simply acting as a source of chromium, restoring the chromium pool of the cells from the Cr-deficient rats.23,27 Our studies showed that different chromium complexes did exert various effects on the expression of mRNA. CrCl3 and Cr(pic)3 have been reported to improve the glucose uptake and to upregulate mRNA levels of the insulin receptor, GLUT4, glycogen synthase and uncoupling protein-3 in skeletal muscle cells.28 Yin reported that Cr(pic)3 had no effect on insulin receptor in insulin-resistant 3T3-L1 adipocytes.29 Our study showed that Cr(pic)3 increased the level of IR mRNA significantly (P < 0.01) in the presence of insulin as compared to Cr(pic)3 treatment alone. GTF increased the level of IR mRNA higher and more significantly (P < 0.01) than the Cr(pic)3 treatment did. In the case of GLUT4 and IRS-2, however, Cr(pic)3 increased mRNA levels higher and more significantly (P < 0.01) than GTF did. Laurène Martinez et al., reported that rosiglitazone increased cell surface GLUT4 levels by increasing its endosomal recycling and restoring insulin-induced GLUT4 translocation in insulin resistance.30 Our studies showed that rosiglitazone alone influenced the expression of GLUT4 mRNA in the insulin-resistant 3T3-L1 adipocytes. Rosiglitazone exhibited a significant effect (P < 0.01) on GLUT4 and IRS-2 in the presence of insulin.
There were synergistic effects between insulin and the three chromium complexes. The synergistic effect was higher for GTF than the other two complexes. In the presence of insulin, the levels of IR, IRS-1, IRS-2 and GLUT4 mRNA could be enhanced by GTF to different degrees, while only IRS-1 was enhanced by GTF in the absence of insulin. Both GTF and Cr(pic)3 affected the levels of these four mRNA in the presence of insulin. Furthermore, GTF exerted its effect more on the levels of IR and IRS-1 mRNA than Cr(pic)3 did in the presence of insulin. It is widely recognized that insulin stimulates glucose uptake via the translocation of GLUT4 to the plasma membrane in the muscle and adipose tissue.29 IR and IRS-1 was significantly increased by GTF treatment in the presence of insulin. Insulin receptor, as the binding spot to insulin, could affect the glucose metabolism by initiating a cascade of phosphorylation of several substances. IRS-1 is responsible for transmitting the signal from insulin receptor to biological endpoints. To further illuminate how GTF affects signalling pathways, phosphorylation of IRS-1, IR-β, AKt and c-Cbl must be compared and analysed.
In summary, the effective dose of GTF ranged from 0.5 μg mL−1 to 1.5 μg mL−1. The cells' viability decreased to 80% or lower when the dose of GTF exceeded 1.5 μg mL−1. The glucose consumption of insulin-resistant 3T3-L1 adipocytes increased significantly when treated with GTF for 12 h. Among GTF, Cr(pic)3 and CrCl3, GTF stimulated glucose consumption most dramatically. In the presence of insulin, the levels of IR, IRS-1, IRS-2 and GLUT4 mRNA could be increased by GTF by 2.4, 4.1, 0.9 and 1.1-fold, respectively, while only IRS-1 was enhanced by 2.3-fold in the absence of insulin. GTF affected mRNA level of IR and IRS-1 significantly (P < 0.01). Cr(pic)3 affected mRNA levels of IRS-2 and GLUT4 significantly (P < 0.01). The investigation showed that GTF could serve as adjuvant therapy for diabetes, lowering doses of current medications that have potential side effects, or delaying the continued onset of the disease. To our knowledge, this is the first report to show that purified GTF increases glucose consumption in insulin-resistant 3T3-L1 adipocytes better than Cr(pic)3 and CrCl3 and this is the first description of how GTF affects mRNA levels of proteins involved in insulin signalling.
| This journal is © The Royal Society of Chemistry 2015 |