
 Open Access Article
 This Open Access Article is licensed under a
 Creative Commons Attribution 3.0 Unported Licence
Crystalline structures and crystallization behaviors of poly(L-lactide) in poly(L-lactide)/graphene nanosheet composites
Jingqing
Li
a,
Peitao
Xiao
a,
Hongfei
Li
*b,
Yao
Zhang
a,
Feifei
Xue
a,
Baojing
Luo
a,
Shaoyong
Huang
c,
Yingrui
Shang
a,
Huiying
Wen
d,
Jesper
de Claville Christiansen
e,
Donghong
Yu
f and
Shichun
Jiang
*a
aSchool of Materials Science and Engineering, Tianjin University, Tianjin 300072, P. R. China. E-mail: scjiang@tju.edu.cn
bState Key Laboratory of Polymer Physics and Chemistry, Changchun Institute of Applied Chemistry, Chinese Academy of Sciences, Changchun 130022, P. R. China. E-mail: hfli@ciac.ac.cn
cKey Laboratory of Polymer Eco-materials, Changchun Institute of Applied Chemistry, Chinese Academy of Sciences, Changchun 130022, P. R. China
dCollege of Engineering and Technology, Northeast Forestry University, Harbin 150040, P. R. China
eDepartment of Mechanical and Manufacturing Engineering, Aalborg University, DK-9220, Aalborg, Denmark
fDepartment of Biotechnology, Chemistry, and Environmental Engineering, Aalborg University, DK-9000, Aalborg, Denmark
First published on 16th April 2015
Abstract
Poly(L-lactide) (PLLA)/graphene nanosheet (GNS) composites and pure PLLA were prepared by the solution blending method. Crystalline structures and crystallization behaviors of PLLA in the composite were investigated by XRD, POM, SAXS, and DSC. It was found that α′ form PLLA formation seemed to be more preferred than α form PLLA formation in PLLA/GNS composites at crystallization temperatures Tcs within the α′–α crystal formation transition region due to the existence of GNSs, resulting in an obvious shift of the α′–α crystal formation transition of PLLA in PLLA/GNSs towards high Tcs compared with that of pure PLLA. At Tcs below α′–α crystal formation transition, the formed α′ crystal turned to be more imperfect due to GNS addition, while at Tcs above α′–α crystal formation transition, the crystal structure of α form PLLA was not affected by GNSs. Further POM observations at high Tcs with only α crystal formed showed that PLLA spherulites were well formed in both PLLA/GNSs and pure PLLA, however with very different crystallization kinetics while isothermally crystallizing at different Tcs. The PLLA crystallization process of PLLA in PLLA/GNSs was accelerated by GNSs with both the nucleation rate and spherulite growth rate increased mainly because of the increasing segmental mobility of PLLA chains due to GNS addition; whereas, GNSs showed no observable influence on the determined zero growth temperature Tzg of α form PLLA and the Tzg was estimated lower than the equilibrium melting point of PLLA, indicating that the crystal growth of PLLA is mediated by a transient mesophase with the transition temperature of Tzg between the mesophase and melt not influenced by GNSs in PLLA. Synchrotron on-line SAXS results revealed that the long periods of PLLA in PLLA/GNS composites isothermally crystallized at different Tcs are much smaller than those in pure PLLA. The GNSs are helpful in forming more perfect recrystallized α form PLLA after the α′ form PLLA is melted with increasing Tcs. The presence of GNSs resulted in imperfect α form PLLA from melt directly when it is isothermally crystallized at different Tcs within the temperature range of α′–α crystal formation transition.
1. Introduction
Poly(L-lactide) (PLLA) is one of the most important environmentally friendly semi-crystalline polymeric materials which can be produced from renewable carbon sources. Many researchers believe that PLLA is a powerful potential alternative for fossil-based polymers. PLLA has already been successfully industrialized and has been found to possess excellent mechanical performance and good biocompatibility, which has made it possible for PLLA to be widely used in different fields.1–17 For example, it has been successfully used in biodegradable and biocompatible packings and artificial scaffold and drug delivery carriers.1,2 However, the demands in some special fields are complex and it is difficult for pure PLLA to meet them all. As is known, polyethylene can be melt-blown into agricultural films and finds remarkable applications in agricultural crop production; whereas, low melt strength and low crystallization rate of biodegradable PLLA during the melt-blowing process limit its applications in agriculture compared with polyethylene. Modifications of PLLA would be needed to meet such requirements as well as those in other applications. Since the properties and applications of PLLA or modified PLLA-based materials are closely related to their structural characteristics, the crystal and crystalline structures, crystallization behaviors and crystallization mechanism of the materials have attracted the attention of many researchers3,12–17 seeking efficient modification methods for PLLA.In PLLA, three main crystal forms can usually be formed, including α, β, and γ crystal forms. Among them, the α form is orthorhombic and has a 103 helical chain conformation and it is the most stable one and can usually be prepared from melt or solution.8,12 As reported by many researchers,7,12,15–17 the α form has a disordered form of the α′ form which has been experimentally proved as a new crystalline different from the α form in terms of its disordered helical chain conformation and disordered chain packing mode5,15,18 and usually can be obtained at a relatively low crystallization temperature Tc from PLLA melt. The β form is an orthorhombic unit cell with a 31 helical conformation and can be obtained by stretching at a high drawing rate and high drawing temperature.3,8 The γ form can be formed at slightly low temperatures when PLLA crystallizes epitaxially on hexamethylbenzene.17 Here it should be noticed that formation of the α form from melt is dependent on Tc![[thin space (1/6-em)]](https://www.rsc.org/images/entities/char_2009.gif) 12 and there is an existence of crystal formation transition from α crystal to α′ crystal with decreasing Tc, which is called “α′–α crystal formation transition” in this work. This means, PLLA can crystallize as the α form when Tc is higher than 120 °C, while the α′ form would appear together with the α form if Tc is controlled between 120 °C and 90 °C. And when Tc is lower than 90 °C, only the α′ form was obtained and the α form was not detectable. If α′ form PLLA is further increased to high temperatures, it can transform into α form PLLA by melting and re-crystallizing,12 which is called “α′–α crystal transition” in this work. In the past few years, many researchers and groups have focused on the crystal structure variations together with the crystallization behaviors of PLLA after different modifications by tuning the processing conditions,1,3–5 blending with other materials,6–8 and adding different kinds of additives to PLLA.9–11 And the resulting structures and properties of the modified PLLA-based materials were investigated1,4–11 to further understand the crystallization behaviors and even the crystallization mechanism of PLLA influenced by different factors.
12 and there is an existence of crystal formation transition from α crystal to α′ crystal with decreasing Tc, which is called “α′–α crystal formation transition” in this work. This means, PLLA can crystallize as the α form when Tc is higher than 120 °C, while the α′ form would appear together with the α form if Tc is controlled between 120 °C and 90 °C. And when Tc is lower than 90 °C, only the α′ form was obtained and the α form was not detectable. If α′ form PLLA is further increased to high temperatures, it can transform into α form PLLA by melting and re-crystallizing,12 which is called “α′–α crystal transition” in this work. In the past few years, many researchers and groups have focused on the crystal structure variations together with the crystallization behaviors of PLLA after different modifications by tuning the processing conditions,1,3–5 blending with other materials,6–8 and adding different kinds of additives to PLLA.9–11 And the resulting structures and properties of the modified PLLA-based materials were investigated1,4–11 to further understand the crystallization behaviors and even the crystallization mechanism of PLLA influenced by different factors.
It has been revealed that the lamellar orientation, long periods, and crystal structures of PLLA are dependent on shear conditions, including temperatures, shear rates, and shear strains.1,5 For example, Huang et al.5 found that melt shear flow favors formation of the α form more than the α′ form, resulting in a shift of α′–α crystal formation transition towards low temperatures, and melt shear can remarkably shorten inducement time and act as a nucleation agent.5 Wang et al.19 found that the applied melt shear could enhance nucleus density but could not affect the spherulite growth rates of PLLA. This indicated that the crystalline structure and crystallization kinetics of PLLA can be tuned by processing conditions which can obviously affect the states and behaviors of the PLLA molecular chains before and while they enter the crystals.
By blending with other materials,6–8 the structures and properties of PLLA can also be tuned. Pan6 reported that crystallization of PLLA could be hindered by the dilution effect of poly(D,L-lactide) (PDLLA) miscible with PLLA at all compositions. This dilution effect of PDLLA is different from the acceleration effect of melt shear reported by Huang et al.5 but formation of α form crystal was also favored and the critical temperatures of α′–α crystal formation transition are reduced from those of pure PLLA. Pan6 proposed that formation of α′ form crystals of PLLA is kinetically preferential, while that of the thermally stable α form crystals is thermodynamically favored. From this point of view, PDLLA and melt shear mainly affected PLLA crystallization kinetically and thermodynamically, respectively. Lai8 blended PLLA with 1,3:2,4-dibenzylidene-D-sorbitol (DBS) and found that DBS favored the order and regular α form of PLLA as well as melt shear and dilution effect of PDLLA and at lower temperatures more α form crystal were formed, which made the α′–α crystal formation transition temperature of PLLA shift towards lower temperature as more DBS was added. It was proposed that DBS molecules are stacked together through π–π interaction to form a strand with PLLA molecules by hydrogen bonding and this makes PLLA have a more regular structure but its equilibrium melting point and glass-transition temperature were not significantly changed. Similar to the effect of PDLLA, DBS also decreased the crystallization rate of PLLA though more DBS may act as a nucleation agent, which was attributed to the variation of the crystal structure of PLLA by the authors. This explanation about the decrease of PLLA crystallization rate is different from that reported by Pan6 in PLLA/PDLLA.
Different kinds of additives are always used as nucleation agents or other functional additives of polymeric materials, especially some typical nano additives developed in recent years.9–11,20–48 The additives include exfoliated graphite,9 carbon nanotubes11,25–34 including single wall carbon nanotubes29–33 and multi-walled carbon nanotubes,11,34 graphite oxide,38–40 graphene nanosheets (GNSs),10,20–24 montmorillonite,35–37 layered silicates,41 and other additives.42–45 It has been found that many of these additives can be used to tune the mechanical performance of the filled polymeric composites by tuning their crystallization behaviors and crystalline structures, including crystallization kinetics and crystalline morphology.10,26–32,34–37,41–43 And many of them have been used to modify the properties and structures of PLLA.9–11 For example, Kim9 reported that addition of exfoliated graphite to a PLLA matrix to form nanocomposites could enhance the material's thermal stability, mechanical modulus, and electrical conductivity. Villmow11 dispersed multi-walled carbon nanotubes in a poly(lactic acid) matrix by tuning twin-screw extrusion conditions and found an electrical percolation threshold was reached below 0.5 wt% MWNT content. With thermally reduced graphene oxide (tr-GO) as the initiator, Yang49 prepared PLLA/tr-GO composites via in situ ring-opening polymerization of lactide and found the thermal stability, crystallization rate, and electrical conductivity of the materials were increased. Wang39,50 reported that graphene oxide (GO) could accelerate the nonisothermal cold crystallization and isothermal crystallization nucleation density of PLLA, indicating that GO may act as a nucleating agent for PLLA, while the crystallization mechanism and crystal structure remained unchanged at Tc = 130 °C. Chen40 found that GOs accelerated PLLA crystallization from melt by increasing the nucleation density and addition of 0.1 wt% GO resulted in a small increase of equilibrium melting point but more GOs were unfavorable for the crystallites perfection of PLLA and resulted in a slight decrease of equilibrium melting point.
Xu10 reported that GNSs could serve as heterogeneous nucleation agents of PLLA as well as CNTs, shortening the induction period of crystallization and accelerating the crystallization kinetics of PLLA, but the induction ability of GNSs was weaker than that of CNTs. In addition, more CNTs in PLLA from 0.05 to 0.1 wt% resulted in a shortened induction period and an enhanced crystallization rate, but the same increasing content of GNSs resulted in a longer induction period and a decreased crystallization rate. The crystallization mechanism of PLLA influenced by GNSs and CNTs was also discussed in detail. Xu10 explained that in the case of neat PLLA, the conformational ordering during crystallization begins with –CH3 interchain interactions which preceded –(COCtCH3) interchain interactions. Conversely, in the CNT and GNS nanocomposites, strong noncovalent binding between nanoparticles and PLLA main chains made the conformational ordering begin with –(COCtCH3) interchain interactions which preceded –CH3 interchain interactions, resulting in a direct reduction of the induction period. This type of interchain interactions could be explained in terms of surface-induced conformational order (SICO). Furthermore, Xu10 proposed that PLLA chains might prefer to align along the CNT axis and strict lattice matching between PLLA chains and the external graphitic sheet of CNTs is not required; although lattice matching plays a dominant role in surface-induced crystallization of PLLA chains on GNS surface, which makes PLLA chains need more time to adjust their conformations, and PLLA single crystals on GNS surface can show multiple orientations, which might impinge on adjacent single crystals and suppress the crystal growth.
The effect of coexistence of processing conditions and blending with other materials or additives on crystalline structures and crystallization behaviors of PLLA as well as other polymers was also investigated.23,25,27,29–31,35 Zhang7 prepared highly oriented and amorphous PLLA/poly(D-lactide) (PDLA) with a 1:1 blend of high-molecular-weight PLLA and middle-molecular-weight PDLA. After suitable annealing treatment, the obtained blend crystallized as α′ form crystal together with stereocomplex βc co-existing in the materials. Such results indicated that a strong enough stretch of PLLA chains favors α′ form crystal formation more than that of the α form, which is different from the results of Huang et al.5 Perhaps, too strong a stretch of PLLA chains inhibited the perfect adjustment of helical chain conformation and the ordered chain packing, resulting in a disordered crystal as the α′ form instead of the ordered α form. In the following heating process above 120 °C, the heavily stretched PLLA chains could relax to some extent and this α′ form crystal could reorganize as the oriented α form which melted around 180 °C. Further heating resulted in crystallization of molten chains on the surface of βc crystallites with a high degree of chain orientation revealing that βc crystallite surface has model effects and can induce PLLA molten chains to crystallize on it.
Among the mentioned additives, two-dimensional GNSs have emerged as a subject of enormous scientific interest due to their exceptional electron transport capability, mechanical properties, and high surface area.2,10,11,20–24 The nucleation effect of GNSs and their influence on crystal structure and crystallization mechanism of PLLA as well as the influences of other modification methods of PLLA have been investigated. However, some details of the influence of GNSs on crystallization behaviors and crystalline structures of PLLA in PLLA/GNS composites have not been fully investigated. For example, the influence of GNSs on the spherulite growth rate and α′–α crystal formation transition of PLLA has been rarely reported. The crystallization mechanism of PLLA and the influences of GNSs on it need further explorations.
To understand the crystallization behaviors and crystallization mechanism of polymers, a crystallization theory of Hoffman–Lauritzen with the popular expression given by eqn (1) has been developed and widely used to describe the temperature dependence of the growth rate u near the melting temperature.12 Within such a temperature range, the growth rates are considered to be controlled by an activation step. As shown in eqn (1), the first exponential factor accounts for the temperature-dependent segmental mobility as given by the Vogel–Fulcher equation with TA and TV referring to the activation temperature and Vogel temperature, respectively.51,52 The second exponential factor states that the height of the activation barrier diverges at T∞f. That is, in the Hoffman–Lauritzen theory, the growth rate of polymer crystallites is usually taken for granted to be controlled by the supercooling below the equilibrium melting point of a macroscopic sample, T∞f.
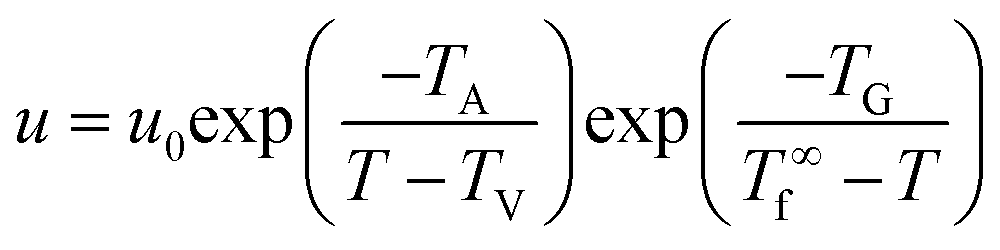 | (1) |
Strobl51 suspected that the activation energy does not diverge at T∞f but much earlier at Tzg. He defined Tzg as the zero growth temperature which is another characteristic temperature for a system different from T∞f. And Tzg can be identified with the temperature of the hidden transition between the melt and mesophase according to the Strobl crystallization theory of polymers. Strobl52 replaced T∞f in eqn (1) with Tzg and eqn (2) was obtained. Then he reordered eqn (2) as eqn (3) with a differentiation of ln(u) with regard to T. By plotting [−dln(u/u0)/dT + TA/(T − TV)2]−1/2 ∼ T, Tzg of some polymers can be easily obtained according to the linear relation in eqn (3). For example, Tzg of poly(ε-caprolactone) (PCL) had been determined as 77 °C,51,52 about 22 °C lower than T∞f of PCL. Tzgs of iPS and linear PE had been obtained as 275 °C and 132.5 °C, respectively. The existence of Tzg of the polymers supported the view of Strobl,52 showing that the crystal growth is mediated by a transient mesophase with Tzg as the transition temperature between it and the melt.
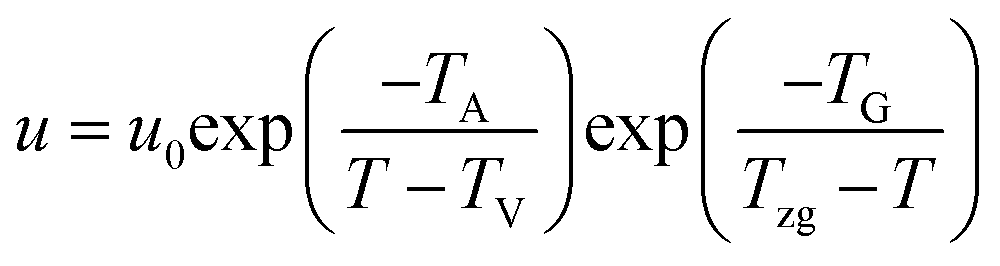 | (2) |
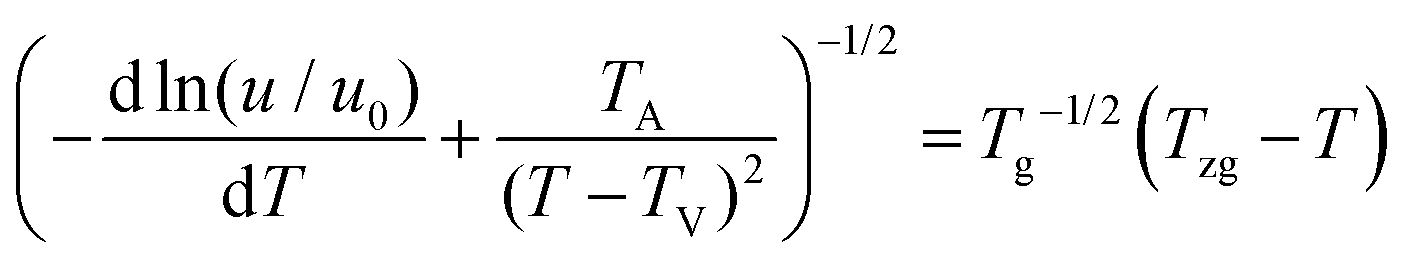 | (3) |
In this paper, GNSs are added into PLLA by the solution blending method. The crystal structures, crystallization morphology, crystallization behaviors including the nucleation process and spherulite growth of PLLA in the obtained PLLA/GNS composites as well as those of pure PLLA were investigated by XRD, POM, SAXS, and DSC. The influences of GNSs on the crystal forms in PLLA/GNSs and pure PLLA isothermally crystallized at different crystallization temperatures Tcs were first examined to understand the influence of GNSs on the known α′–α crystal formation transition of PLLA. Then Tcs were selected to reveal the nucleation effect of GNSs and the influence of GNSs on the spherulite growth of α form PLLA during the isothermal crystallization process. The resulting crystallization behaviors of PLLA in both PLLA/GNSs and pure PLLA were analyzed according to the Strobl crystallization theory with the zero growth temperature Tzgs of α form PLLA in both PLLA/GNSs and pure PLLA determined. With further synchrotron on-line SAXS and DSC results of the variations of long period L of α form PLLA during the isothermal crystallization process and the melting behaviors of both PLLA/GNSs and pure PLLA at different Tcs, and the crystallization mechanisms of PLLA and the influence of GNSs were discussed.
2. Experimental
2.1 Materials
Poly(L-lactide) (PLLA) was supplied by Zhejiang HISUN Biomaterial Co. Ltd, China. The weight average molecular weight (Mw) and the number average molecular weight (Mn) are 109000 and 88200 g mol−1, respectively. The differential scanning calorimetry (DSC) determined melting point of the PLLA is 172 °C.
Graphene nanosheets (GNSs) were carboxyl graphene powder productions purchased from Nanjing XFNANO Materials Tech Co., Ltd, which were prepared by thermal exfoliation reduction and hydrogen reduction. The carboxyl content is about 5%. The diameter is about 500 nm. The thickness is about 0.8–1.2 nm. The single layer ratio is 80% and the purity is 99.8%.
2.2 Preparation of PLLA/GNS composites
PLLA was solution blended with GNSs. First, 1 g PLLA was dissolved in 20 mL chloroform. Second, 1 mg GNSs was well dispersed and suspended in DMF by 20 min heating and stirring followed by 20 min ultrasonic treatment. Then the above PLLA solution and GNS suspension were mixed together. With a slow enough addition of alcohol while stirring, PLLA and GNSs were precipitated together. The obtained flocculent precipitate was collected and dried in a vacuum chamber for 24 hours at 70 °C to remove the solvents.2.3 Sample preparation and characterization
A Linkam CSS450 shear stage (Linkam Scientific Instruments, Ltd, Tadworth, Surrey, UK) was used to prepare samples of pure PLLA and the prepared PLLA/GNS composites at different isothermal crystallization temperatures for XRD, SAXS, and DSC measurement. The mechanical design and electronics of the Linkam shear stage provided a precise control of the needed temperature and sample thickness. An Olympus BX51 was used to obtain POM images. All samples were firstly melted at 200 °C for 1 min on the shear stage, which is connected with a heating and temperature control equipment. Then the upper lid was put on the melted samples, and then most of the bubbles were degassed. Then screwing down the nuts on the upper lid, part of the bubbles were degassed during the process. Then after screwing up the nuts and screwing down the nuts three times, bubbles could be avoided or mostly degassed. After the thermal history of the samples was erased, the samples were cooled with a cooling rate of 30 °C min−1 to pre-set temperatures for isothermal crystallization, which were selected as 86 °C, 96 °C, 106 °C, 116 °C, 126 °C, and 136 °C. After being held at the pre-set isothermal crystallization temperatures for enough time to crystallize, the samples were quickly cooled to 30 °C and carefully removed for investigation by ex situ XRD and DSC or in situ SAXS.XRD measurements were performed at room temperature using Rigaku D/max 2500 V with a Cu-Kα source (λ = 1.54 Å). The scanning speed is 2° min−1 within the range of 10–35°. The voltage is 40 kV and the current is 200 mA.
The synchrotron SAXS measurements were carried out at beamline 1W2A (λ = 1.54 Å) of the Beijing Synchrotron Radiation Facility (BSRF), Beijing, China. 2D-SAXS patterns were integrated to obtain 1D-SAXS profiles as a function of scattering vector. The detector Mar165CCD, with 2048 × 2048 pixels and 79.1 μm pixel size, is 1620 mm away from the sample. The long period of PLLA was calculated according to one-dimension electron density correlation function as shown in ref. 53.
DSC experiments were carried out using Perkin-Elmer DSC-7; the heating rate was 10 °C min−1. The samples of about 10 mg were protected by N2. The experimental temperature range was selected from room temperature to 200 °C.
3. Results and discussion
3.1. Crystal structures
Since different crystals can be formed in PLLA and the formed crystal structures are dependent on the crystallization temperatures Tcs,12 the influence of GNSs on the crystal formation of PLLA in PLLA/GNS composites at different Tcs was first examined. Fig. 1(a1) shows the XRD profiles of pure PLLA isothermally crystallized at various Tcs from melt. Fig. 1(a2) and (a3) provide partially enlarged XRD profiles of those in Fig. 1(a1) for pure PLLA. In these XRD profiles of pure PLLA, the most intense peaks can be observed at 2θ = 16.54° for Tcs above 116 °C, which agrees well with the most intense peaks in the WAXS profiles of PLLA located at 2θ = 16.70° for Tcs above 120 °C reported by Kawai et al.12 The peak at 2θ = 16.54° can be attributed to (110) and/or (200) planes. Another strong reflection of (203) and/or (113) planes can also be observed for Tcs above 116 °C. Both these strong peaks remained when Tcs were smaller than 116 °C; whereas several reflections such as (010) and (210) were relatively weak. Since it is known that only α form PLLA can be formed when Tc is higher than 120 °C, the XRD profiles in Fig. 1(a1)–(a3) for Tcs above 116 °C can be assigned to be orthorhombic α form PLLA, in which the PLLA molecules are assumed to have a left-handed 103 helical conformation.12,54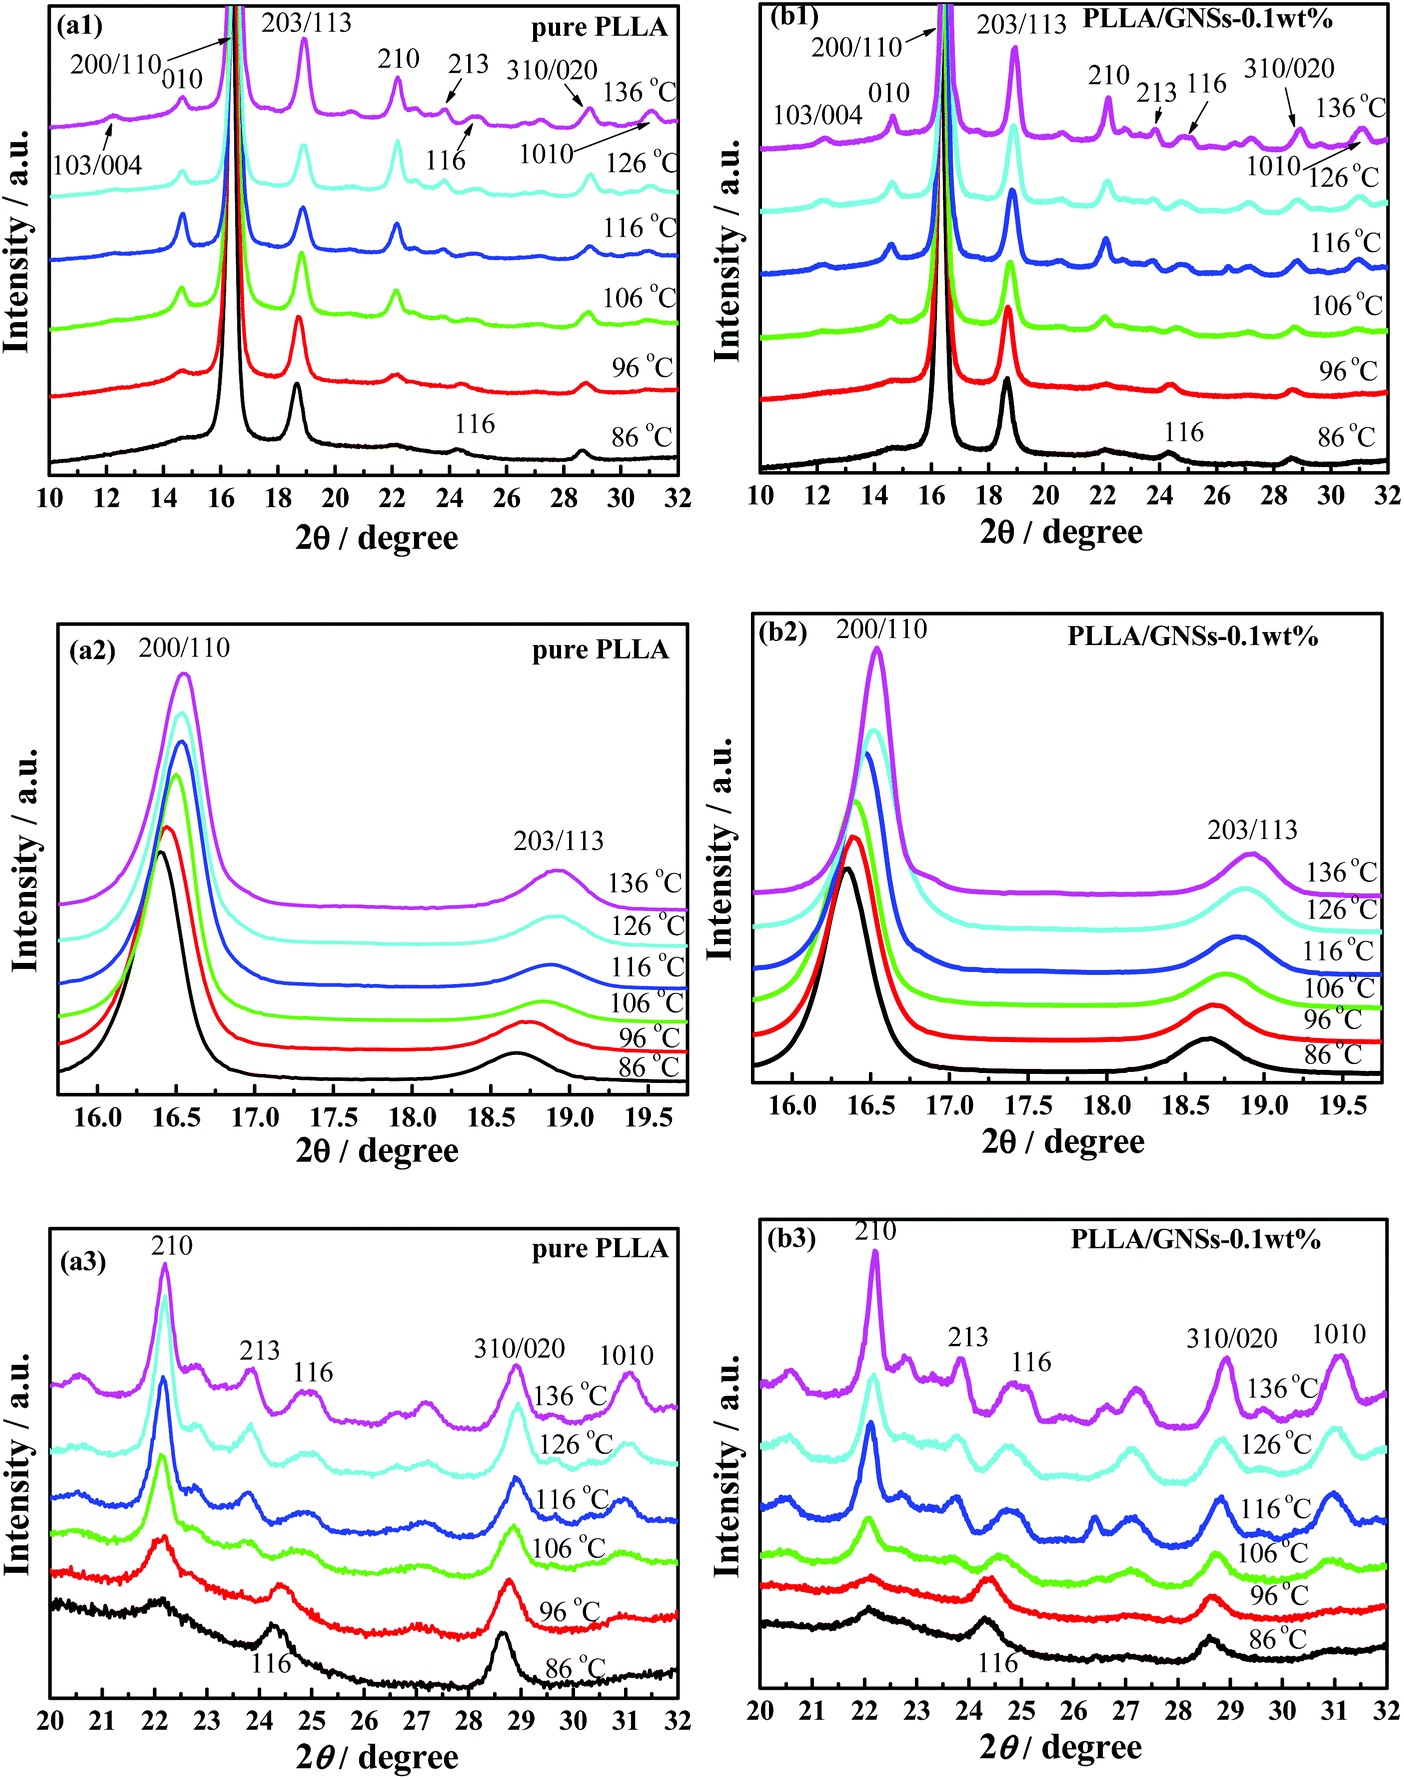 | ||
| Fig. 1 XRD profiles of pure PLLA and PLLA/GNS composite samples isothermally crystallized at various Tcs from melt (a1)–(a3) pure PLLA, (b1)–(b3) PLLA/GNS-0.1 wt% composites. | ||
For Tcs below 116 °C, the intensity of some diffraction peaks, including (103)/(004), (1010), and (010), which are characteristics of α form crystal, decreased with decreasing Tc, and finally disappeared at Tc = 86 °C. At the same time, some diffraction peaks, including (200)/(110) and (203)/(113), shifted to smaller 2θ values, which were further shown in Fig. 2(a) and (b). These changes of the peaks in XRD profiles of PLLA indicated that the α form content decreased while the α′ form content increased within the isothermally crystallized samples with decreasing Tc till only the α′ form formed below Tc = 86 °C. This agrees with the results of many researchers who regarded the disappearance of the (010) reflection as the indication of crystal formation transitions from co-existence of both α and α′ form to only α′ form PLLA.3,5,55
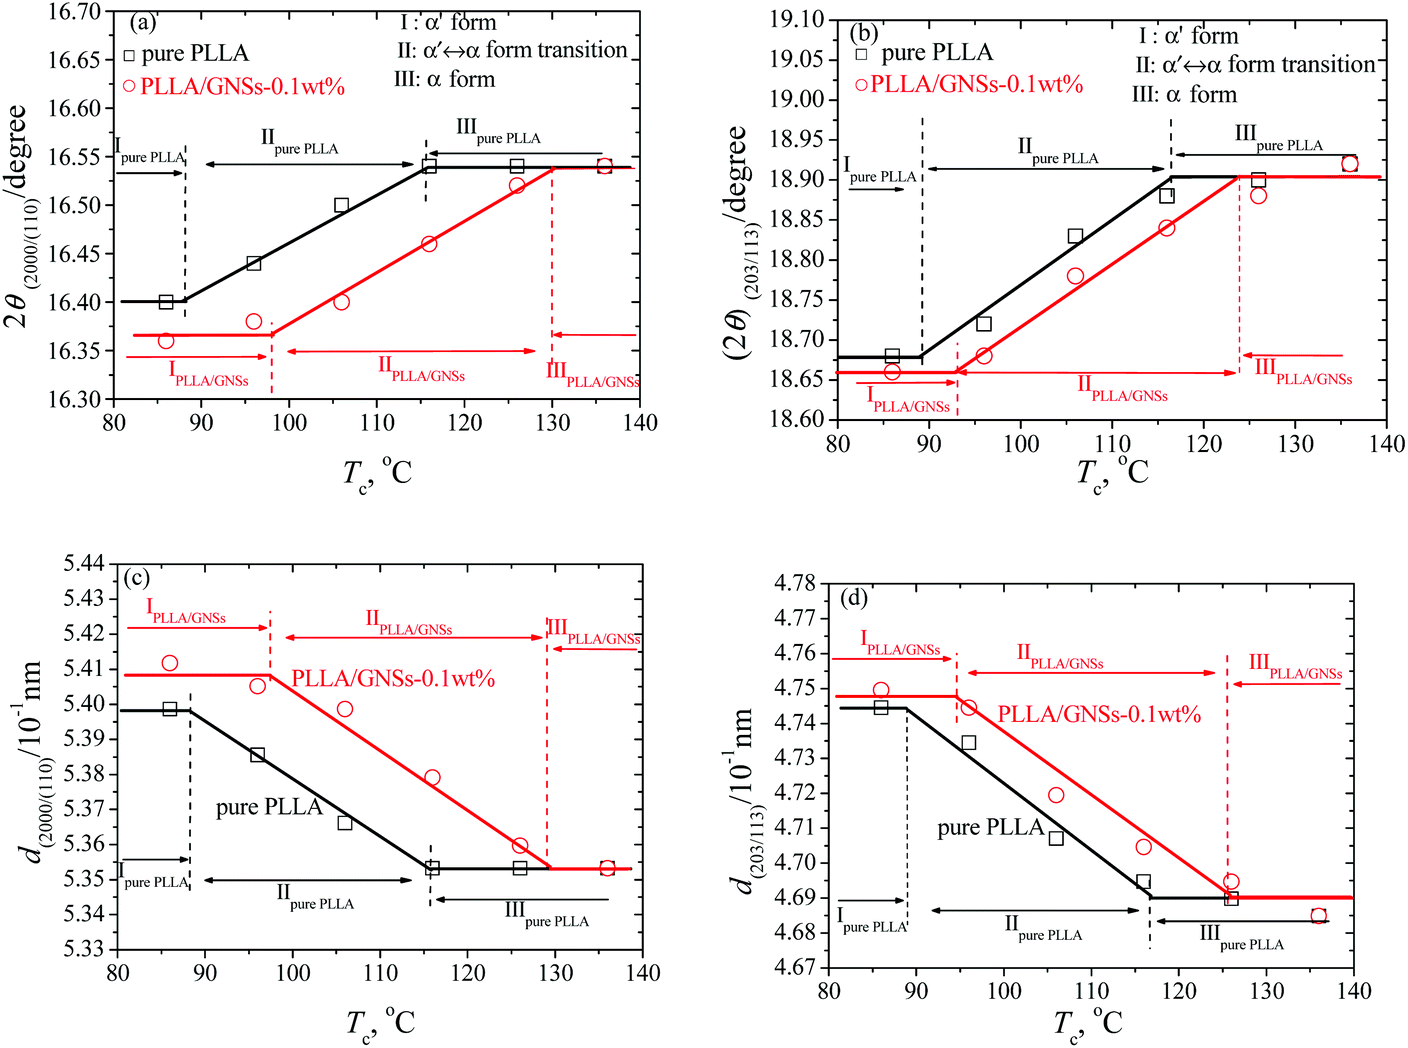 | ||
| Fig. 2 2θ values from (200)/(110) and (203) diffractions (a and b) and the corresponding d values calculated from the Bragg equation (c and d) of PLLA and PLLA/GNS composite samples crystallized at various Tcs from the melt. The lines are plotted to guide the eyes. | ||
Kawai et al.12 have proved that the disappeared diffraction peaks of (103)/(004), (1010), and (010) in Fig. 1(a1)–(a3) were not due to the crystallinity decrease with decreasing Tc, but due to the crystal structure for lower Tcs which is different from the α form PLLA at higher Tcs. And it seems to be secure to assume this different crystal structure as α′ form PLLA,1,5–7,12–16 which has a hexagonal packing since the absence of some diffraction can be well explained by the extinction rule of the hexagonal lattice. This was supported by the conclusion drawn from IR measurements by Zhang et al.15,56 which revealed that the PLLA chain has the same 103 helical conformation for all Tcs when it is crystallized from the melt and precludes the possibility of β phase formation at low Tcs, proposed by Kawaguchi et al.57
In Fig. 2(a) and (b), within the experimental range of Tcs, three regions can be observed for the pure PLLA sample: (i) α′ form PLLA below Tc ≈ 86 °C; (ii) α′–α crystal formation transition with 86 °C < Tc < 116 °C; (iii) α form PLLA above Tc ≈ 116 °C. These three regions agree with the results of Kawai et al.12 who concluded by both WAXS and SAXS that the “pure” α′ form might be a limit disordered crystal with hexagonal packing of the 103 helix of the PLLA chain and this “pure” α′ form can only be obtained when Tc is below 90 °C. This is somewhat different from the results of Zhang et al.15 who revealed that the α′ form is obtained below 120 °C.
Actually, it is difficult to differentiate the crystal structures of pure PLLA samples only from their XRD profiles shown in Fig. 1(a1), because the crystal structure of α′ form PLLA is quite similar to that of the α form, except for the chain conformation and chain packing mode.5,58 Since it is known that only α′ crystal and α crystal are formed in the PLLA samples isothermally crystallized at 86 °C and 126 °C, respectively, it is reasonable to regard the (203) reflection peak as one single sharp reflection in XRD profiles of the samples with Tcs of 86 °C and 126 °C. For PLLA samples crystallized at Tcs higher than 86 °C and lower than 126 °C, the (203) reflections can be resolved into two components originating from the co-existing α′ and α form PLLAs. From this point of view, the observed three regions and their relations to crystal forms of PLLA in Fig. 2(a) and (b) within the experimental range of Tcs are acceptable.
Fig. 1(b1) shows the XRD profiles of PLLA/GNS-0.1 wt% composites isothermally crystallized at various Tcs from melt. In Fig. 1(b2) and (b3), these XRD profiles were partially enlarged to show the variations clearly. If one compares the XRD profiles of the composite with those of pure PLLA in Fig. 1(a1)–(a3), one can find that 2θ values of some diffraction peaks, such as (200)/(110), (203)/(113), and so on, of the PLLA/GNS composite samples also shift to smaller values with decreasing Tcs, as shown in Fig. 2(a) and (b). This proved that the α′ form at low Tcs, α′–α crystal formation transition, and α form at high Tcs of PLLA also appeared in PLLA/GNS composites. Interestingly, it was found that the 2θ − Tc curves of PLLA/GNS composite samples seemed to have moved to higher Tc and smaller 2θ compared with the curves of pure PLLA within the region of α′–α crystal formation transition.
At a high enough Tc, the 2θ values of (200)/(110) and (203)/(113) peaks of XRD profiles of both PLLA/GNS composites and pure PLLA samples tended to be equal. According to the corresponding d values calculated from the Bragg equation of pure PLLA and PLLA/GNS composite samples crystallized from the melt at various Tcs and shown in Fig. 2(c) and (d), the α form PLLA in both the samples has the same crystalline structure at high enough Tcs. This means that the crystalline structure of α form PLLA was not affected by the added GNSs. With decreasing Tc, PLLA/GNS composites enter into the α′–α crystal formation transition region earlier than the pure PLLA sample and their d values are much larger than those of the pure PLLA sample at the same Tc. With Tc decreasing further, PLLA/GNS composites leave the α′–α crystal formation transition region and enter the α′ form region, while the d values of α′ form PLLA in PLLA/GNS composites are obviously much larger than those in the pure PLLA sample. The structure of α′ form PLLA was influenced by GNS addition and tended to be more unstable at Tcs below the α′–α crystal formation transition, which is different from what happened for stable α form PLLA without any variations of d values at high Tcs above the α′–α crystal formation transition.
In addition, in Fig. 2, it is revealed that the added GNSs apparently promoted the crystal formation transition from α form PLLA to α′ form PLLA within the Tc ranges for co-existence of both the crystals; as if α′ form PLLA was preferred more than α form PLLA. That is, GNSs were especially helpful for PLLA to form the less stable α′ crystal instead of the more stable α crystal. If more α′ crystals were formed in a sample, there would be less PLLA molecular chains left to form α crystals. There was a competition between the formation of α′ crystals and α crystals in the samples. This made the primitive α′–α crystal formation transition region in pure PLLA shift to higher temperatures once GNSs were distributed into this material. GNSs made it much easier for α′ crystal to appear even at Tcs higher than 120 °C, under which it was reported that only α crystal can form in pure PLLA. It is indicated that the GNS slices could encourage the PLLA chains to enter the crystal quickly and they seemed to do not have enough time to be well organized to form stable and perfect α crystals, or even form less stable but dense α′ crystals in the PLLA/GNS composites as in pure PLLA.
From Fig. 1 and 2, it can be concluded that a high enough Tc is in favor of a perfect crystalline structure formation of α form PLLA and a low enough Tc makes for only α′ form PLLA in both pure PLLA and PLLA/GNS composite samples. The crystalline structure of α form PLLA at Tcs above the α′–α crystal formation transition was not affected by GNSs, which agreed with Wang et al.50 who reported that both PLLA and PLLA/GOs had the same crystal structure at 130 °C; whereas, the non-perfect α′ form PLLA was influenced and tended to be less perfect at Tcs below the α′–α crystal formation transition. At the same time, GNS existence in PLLA favors α′ crystal formation more than α crystal formation and the α′–α crystal formation transition is shifted to higher temperatures. Such effects of GNSs were different from those of melt shear,5 PDLLA6 and DBS8 all of which favor α crystal formation more inversely and result in shifts of α′–α crystal formation transition towards low temperatures. Melt shear was found to accelerate nucleation of PLLA,5 while PDLLA and DBS could decrease the crystallization rate of PLLA.6,8 To understand the influence of GNSs on crystal structures of PLLA further, the crystallization behaviors of PLLA in the composite should be examined and PLLA crystallization mechanism needs to be discussed.
3.2. Crystallization behaviors
In order to know whether the crystallization behavior of PLLA/GNS-0.1 wt% composites is different from that of pure PLLA or not, the POM images of both the materials isothermally crystallized at different Tcs above α′–α crystal formation transition during their isothermal crystallization process were obtained. Thus, the effects of GNSs on the crystallization behavior of α form PLLA were examined.Fig. 3 shows the typical POM images of the samples at Tc = 140 °C. From Fig. 3, it can be seen that PLLA spherulites were well formed both in pure PLLA and PLLA/GNS-0.1 wt% composite samples during their isothermal crystallization process. This implied that PLLA spherulite formation was not disturbed by GNSs in PLLA/GNS-0.1 wt% composites. While comparing the POM images in Fig. 3(a1)–(a3) with those in Fig. 3(b1)–(b3), one can observe that more PLLA spherulites are formed in PLLA/GNS-0.1 wt% composites than in pure PLLA in the same isothermal crystallization time with Tc = 140 °C within the first 20 min of the crystallization process. This revealed that the nucleation density of α form PLLA in PLLA/GNS-0.1 wt% composites is much higher than that of the pure PLLA sample. That is, the addition of GNSs into PLLA accelerated the nucleation process of PLLA.
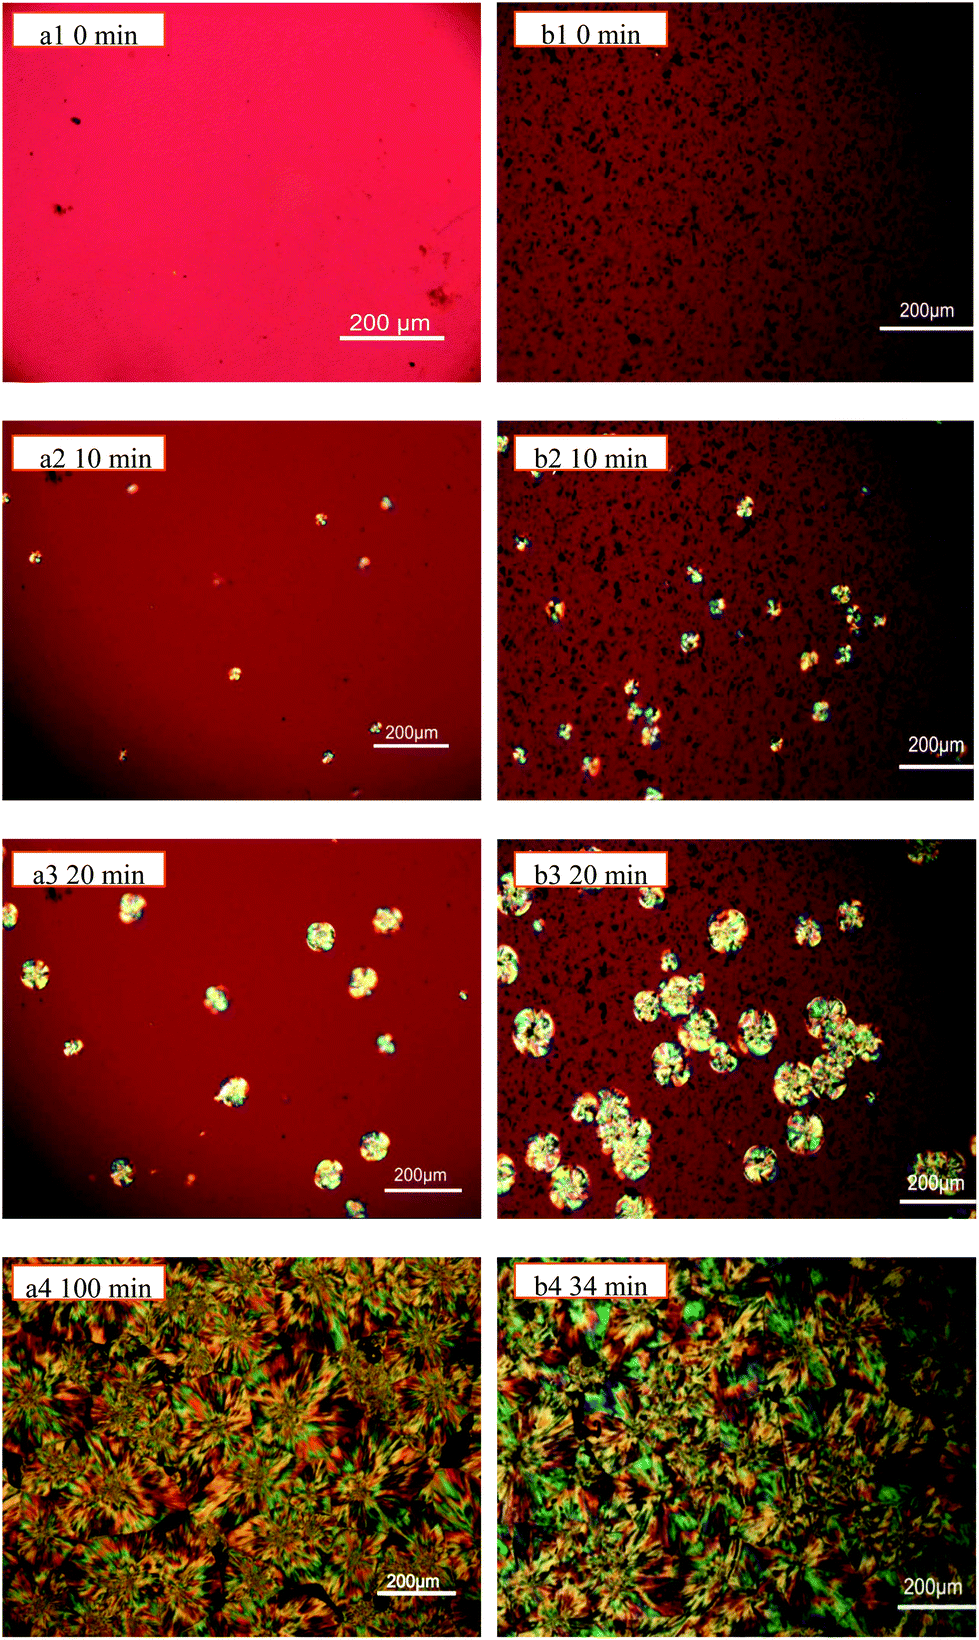 | ||
| Fig. 3 POM images of PLLA and PLLA/graphene composite samples isothermally crystallized at Tc = 140 °C from melt during their isothermal crystallization process: (a1)–(a4) pure PLLA, (b1)–(b4) PLLA/GNS-0.1 wt% composite. | ||
From Fig. 3(a4) and (b4), it can be noticed that 100 min and 34 min were needed for PLLA spherulites in pure PLLA and PLLA/GNS-0.1 wt% composite samples, respectively, to grow to full observed range of the POM images. The obtained PLLA spherulites in pure PLLA seemed to be slightly larger than those in PLLA/GNS-0.1 wt% composite samples, which confirmed the higher nucleation density of PLLA in the composite as revealed in Fig. 3(a1)–(a3) and (b1)–(b3). This proved that GNSs could serve as nucleating agents for accelerating the crystallization kinetics of PLLA, agreeing with Xu.10
In fact, the increased nucleation density of PLLA spherulites in PLLA/GNS-0.1 wt% contributed to the higher crystallization rate of PLLA in the composites than in pure PLLA. The increased PLLA spherulite growth rate due to addition of GNSs also played important roles. To understand this, the diameters of PLLA spherulites depending on isothermal crystallization time during the crystallization process were obtained and are shown in Fig. 4 for both pure PLLA and PLLA/GNS-0.1 wt% composite samples. From the slopes of the fitted lines in Fig. 4, the radius growth rates of the PLLA spherulites were determined and are shown in Fig. 5.
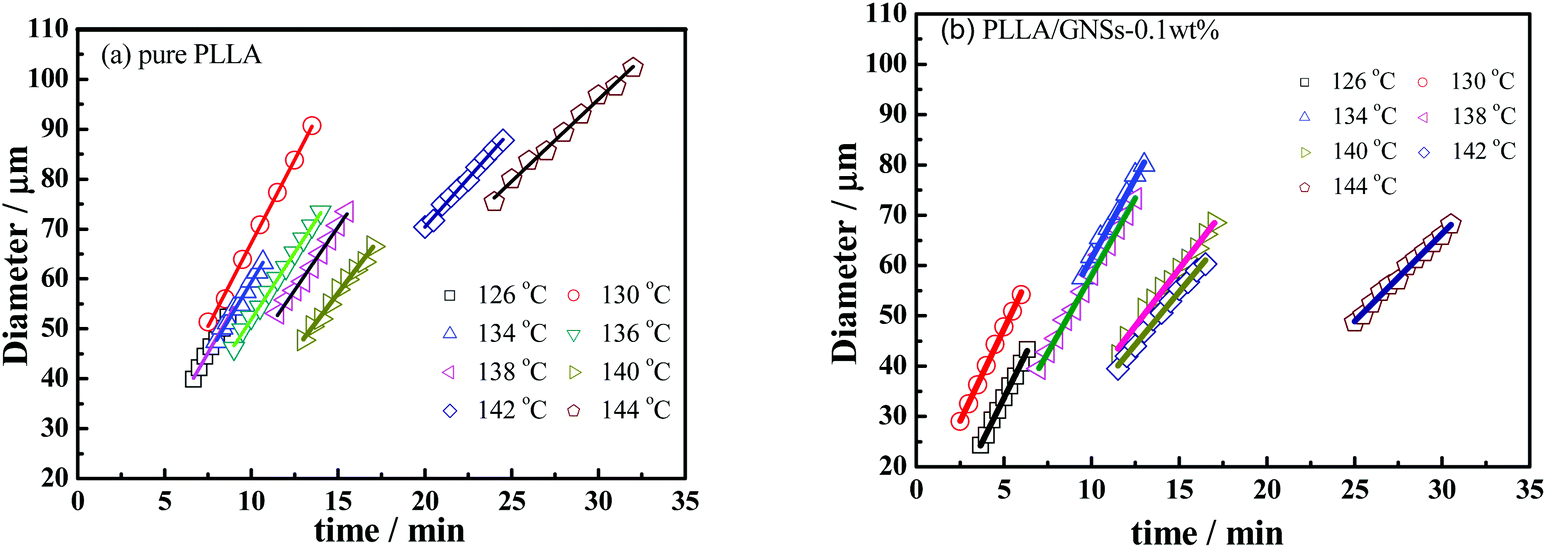 | ||
| Fig. 4 Diameter growth of spherulites of PLLA and PLLA/GNS composite samples isothermally crystallized at various Tcs from melts: (a) pure PLLA, (b) PLLA/GNS-0.1 wt%. | ||
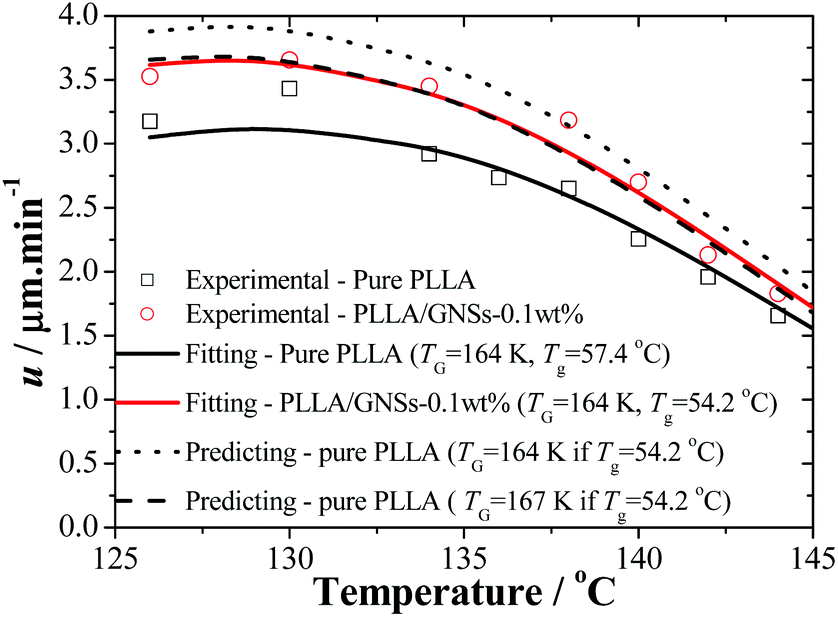 | ||
| Fig. 5 Radius growth rates u of the spherulites of PLLA in pure PLLA and PLLA/GNS composite samples as functions of crystallization temperature (Tc). Solid lines are obtained by fitting the experimental data according to eqn (3) with Tzg = 177 °C and Tg = 164 K. The dotted and dashed lines are the predicting results of pure PLLA according to eqn (3) with Tzg = 177 °C and Tg of 164 K and 167 K, respectively, if Tg is set equal to that of PLLA/GNSs of 54.2 °C. | ||
According to the crystallization theory, the crystal growth rate always shows well-known bell-shaped temperature dependence. This is also found to be true for pure PLLA and PLLA/GNS-0.1 wt% composite samples. It can be found in Fig. 5 that the radius growth rate of PLLA spherulite of pure PLLA reached its peak value at about Tc = 130 °C. This experimental result agrees very well with that reported by Kawai and his coworkers.12 Importantly, at all the experimental crystallization temperatures, the radius growth rates of PLLA spherulite of PLLA/GNS-0.1 wt% composite samples were found to be larger than those of pure PLLA samples. GNSs can accelerate the radius growth of PLLA spherulite, but they do not change the well-known bell-shaped temperature dependence of the radius growth rate. GNSs in PLLA/GNS-0.1 wt% composites even had no influence on the position of the peak growth rate at about Tc = 130 °C. From this point of view, the faster crystallization process of PLLA in PLLA/GNS-0.1 wt% composites than that of pure PLLA can be attributed to the combination of the faster nucleation process and the faster radius growth of the spherulite of PLLA in PLLA/GNS-0.1 wt% composites than in pure PLLA.
The DSC curves of pure PLLA and PLLA/GNS-0.1 wt% composite samples during the non-isothermal crystallization process with a temperature decreasing rate of 10 °C min−1 from melts shown in Fig. 6 supported the above POM observations. With temperatures decreasing, the DSC curve of the pure PLLA sample showed one exothermic peak. Similarly, PLLA/GNS-0.1 wt% composites also showed one exothermic peak. However, their thermal enthalpy is much larger and the corresponding temperature of the crystallization peak is higher than that of the pure PLLA sample. The thermal enthalpy difference of the two samples implied that GNSs in PLLA/GNS-0.1 wt% composites resulted in higher crystallinity of their PLLA matrix. In the pure PLLA sample, with temperatures decreasing, low nucleation rate and slow radius growth rate of the spherulite apparently did not leave enough time for the concerned PLLA molecular chains to form crystalline structures. When GNSs are added, both the nucleation rate and the radius growth rate of the spherulite are increased. Thus, the total crystallization rate of PLLA is enhanced by GNSs comprehensively in the composite.
 | ||
| Fig. 6 DSC curves of the non-isothermal crystallization process of PLLA in pure PLLA and PLLA/GNSs composite samples with a temperature decreasing rate of 10 °C min−1 from melts. | ||
It seemed that the added GNSs can provide more chances for more PLLA molecular chains to form crystalline structures within the limited time range before they are cooled to lose enough mobility due to decreasing temperature. It is really an interesting observation. Since GNSs in the composite may act as “physical walls” interacting with the PLLA molecular chains, theoretically the number of chain configurations should decrease and hence there would be less mobility of the PLLA chains which would leave less chances for crystallites to form. However, the opposite was observed here. Maybe the sum of attraction forces along a chain is lower in the presence of a physical wall like a GNS. This leads to less configurational possibilities of PLLA chains – however also to a much higher mobility hence favoring crystallinity.
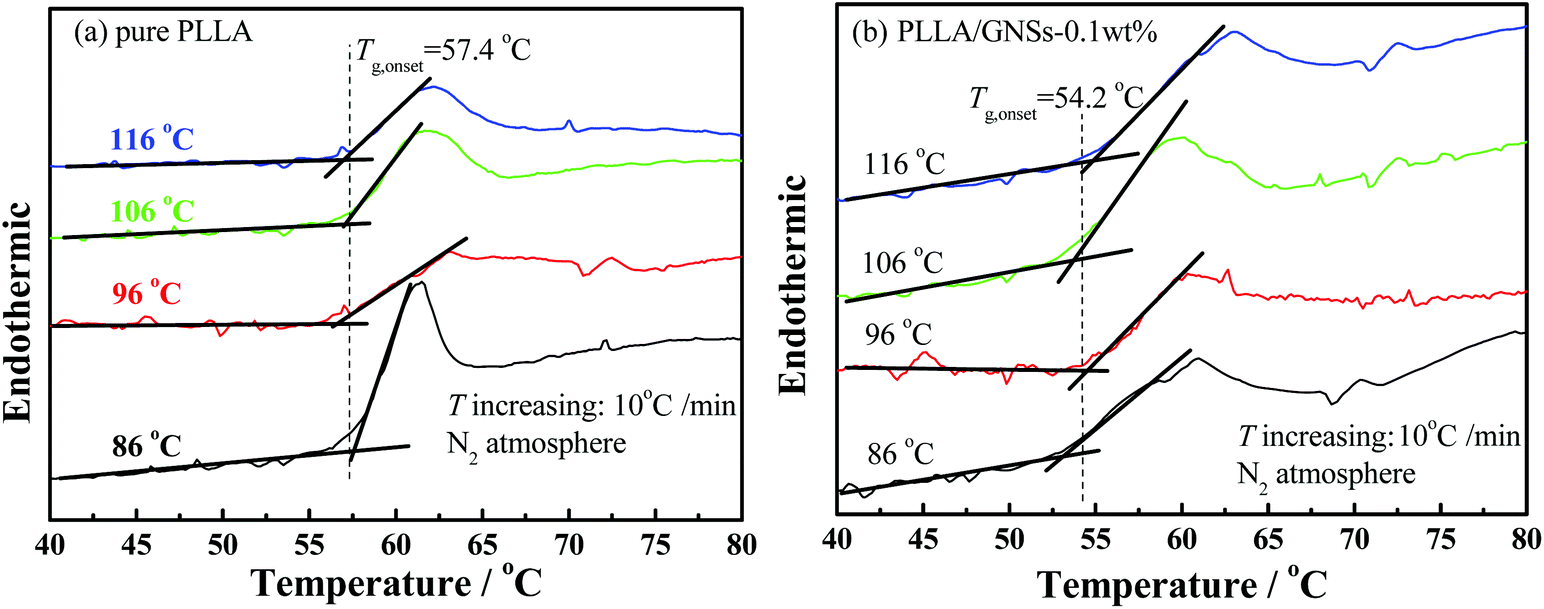
To find out the effects of GNS addition on the mobility of PLLA molecular chains in PLLA/GNS composites, further DSC measurements were executed to determine the glass transition temperatures of PLLA in pure PLLA and in the composite. The isothermally crystallized samples at different crystallization temperatures Tc were adopted and the onset temperatures of the glass transitions were obtained. The Tcs were selected as 86, 96, 106 and 116 °C and the results are shown in Fig. 7 as examples. The glass transition temperature Tg,onset of PLLA in pure PLLA was determined as about 57.4 °C and it was found almost independent on Tc. Importantly, the Tg,onset of PLLA in PLLA/GNS composites was about 54.2 °C, also independent of Tc, and it was really found to be lower than the Tg,onset of pure PLLA. This meant that the added GNSs in the composite increased the mobility of PLLA molecular chains.
 | ||
| Fig. 7 Determination of glass transition temperatures of PLLA by DSC with a temperature increasing rate of 10 °C min−1 for the samples isothermally crystallized at different Tcs: (a) pure PLLA, (b) PLLA/GNSs-0.1 wt%. | ||
As is known, in PLLA main chains, there are many structures of –(COCtCH3) resulting in strong interchain interactions by hydrogen bonds, while on the surface of GNS slices there are no such polar functional groups. This decrease of the Tg,onset of PLLA due to the existence of GNSs in PLLA may be possible. Perhaps the interactions between PLLA chains were weakened since the interactions between GNSs and PLLA chains may be much weaker. The dispersed GNSs in PLLA resulted in replacement of relatively strong interactions between PLLA chains by somewhat weaker GNS–PLLA chain interactions. This could be supported by Patti's59 studies who proved by molecular dynamics simulations that small nanoparticles can act as plasticizers in a polymeric matrix. Xiao et al.60 reported that the plasticized poly(lactic acid) with triphenyl phosphate (TPP) could increase the spherulite growth rate. Of course, for PLLA chains with too low a mobility to form a crystallization nucleus, increased chain mobility would help PLLA chains to enhance the nucleation density. This well explains why GNSs can accelerate the crystallization process of PLLA.
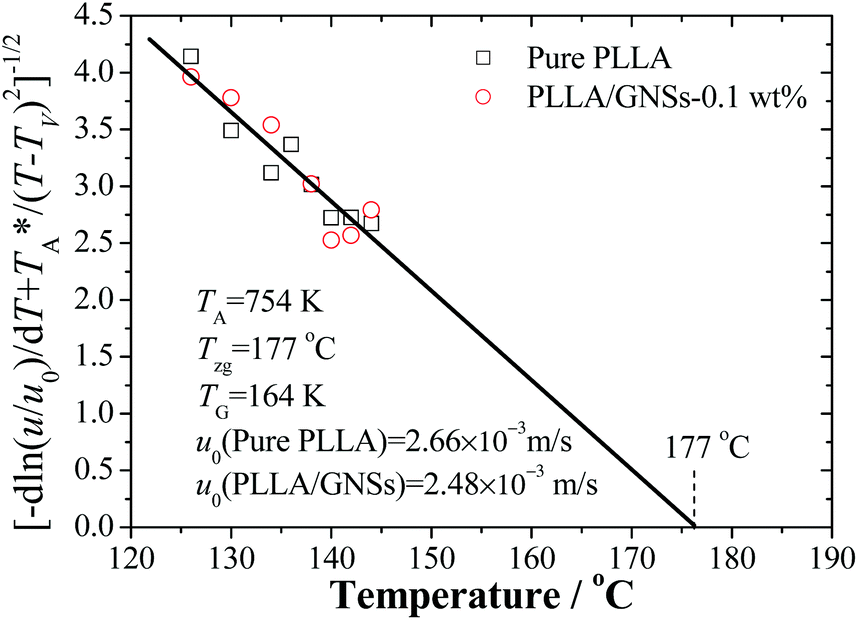
The kinetic data in Fig. 5 can be reorganized and linearly fitted by plotting [−dln(u/u0)/dT + T*A/(T − TV)2]−1/2 ∼ T according to eqn (3) and the results are shown in Fig. 8. Here, TA = 754 K was obtained from TA = U*/R with U* = 1500 cal mol−1 and TV = Tg − 30 K was selected according to ref. 12. With the linear fitting parameters of Tzg = 177 °C and TG = 164 K for both pure PLLA and PLLA/GNSs in Fig. 8, the fitted curves of growth rate u dependent on Tc were calculated and are shown in Fig. 5 to compare with those in experimental data. The results showed that both the growth rates of pure PLLA and PLLA/GNSs could be fitted well. Thus, the zero growth temperature Tzg of PLLA was determined as 177 °C and it was found that there was no observable influence of the added GNSs on it.
 | ||
| Fig. 8 Analysis of PLLA spherulite growth rate data of pure PLLA and PLLA/GNSs-0.1 wt% composites by fitting with eqn (3) according to the Strobl crystallization theory. | ||
As for pure PLLA, the Tzg = 177 °C of α crystal is found to be smaller than T∞f = 192.8 °C reported by Xiao60 for their PLA 4032D with a melting point of 168 °C. Tsuji61 reported an even higher T∞f for their samples, in the range from 198 to 212 °C and Kawai et al.12 gave T∞f = 215 °C. Since the used PLLA here has a melting point of 172 °C which is higher than 168 °C, the T∞f may be higher than 192.8 °C. This implies that pure PLLA may have a Tzg lower than its T∞f. Importantly, the Tzg and TG values of α form PLLA in PLLA/GNSs are found to be equal to those of α crystal in pure PLLA, only with the u0 values slightly different.
According to eqn (2), lower Tg of PLLA favors a larger growth rate u. But according to eqn (3), at temperatures near Tzg, growth rate u tends to be very small and the Tg variation of PLLA has little influence on Tzg of α form PLLA. This indicated that the GNS-induced increase of PLLA segmental mobility does not affect the Tzg value and only results in decrease of TG, which has been supported by the fitting results according to eqn (3) in Fig. 8. With increasing Tc, the decrease of spherulite growth rate of PLLA in PLLA/GNSs was accompanied by a synchronous reduction of the acceleration effects of GNSs on the growth rate. It seemed that GNSs had no impact on the thermodynamic essence of the investigated isothermal crystallization process of PLLA, though it can help PLLA spherulites kinetically grow faster, or the influence of GNSs on the isothermal crystallization thermodynamics is too weak to be observed. This may be helpful to understand the effects of GNSs on the crystallization process and the crystallization mechanism of PLLA.
Supposing that Tg of pure PLLA decreased from 57.4 °C to 54.2 °C which is equal to that of PLLA in PLLA/GNSs, a predicting line shown as the dotted line in Fig. 5 could be obtained if the fitting parameters Tzg = 177 °C, TG = 164 K, and u0 = 2.66 × 10⁻³ m s−1 obtained in Fig. 8 were used. It can be seen that the values of the growth rate u at different Tcs are obviously larger than the experimental data and the fitting line of PLLA/GNSs according to the Strobl crystallization theory. When the value of TG was adjusted to 167 K, the predicting dashed line for pure PLLA in Fig. 5 could overlap well with the fitting line of PLLA/GNSs. This implied that the increase of growth rate u of PLLA in PLLA/GNSs, when compared with that of PLLA in pure PLLA, is mainly due to the increase of segmental mobility of PLLA chains because of addition of GNSs. At the same time, the contribution of the increased segmental mobility seemed to have been inhibited by GNSs which have certain steric hindrance to spherulite growth. This agrees with the results of Xu10 who found that 0.05 wt% content of GNSs in PLLA could serve as heterogeneous nucleation agents of PLLA, shortening the induction period of crystallization and accelerating the crystallization kinetics of PLLA. However, if GNS content increased to 0.1 wt%, it resulted in a longer induction period and a decreased crystallization rate of PLLA, because PLLA single crystals on GNS surface may suppress the crystal growth.
3.3. Lamellar parameter
To further understand the influence of GNSs on the crystalline structure of PLLA, pure PLLA and PLLA/GNS composite samples were both isothermally crystallized at 145 °C to form α form PLLA and their 2D SAXS patterns were collected. Some typical patterns were selected and are shown in Fig. 9. Corresponding to the 2D SAXS patterns, 1D SAXS intensity profiles were plotted and are shown in Fig. 10.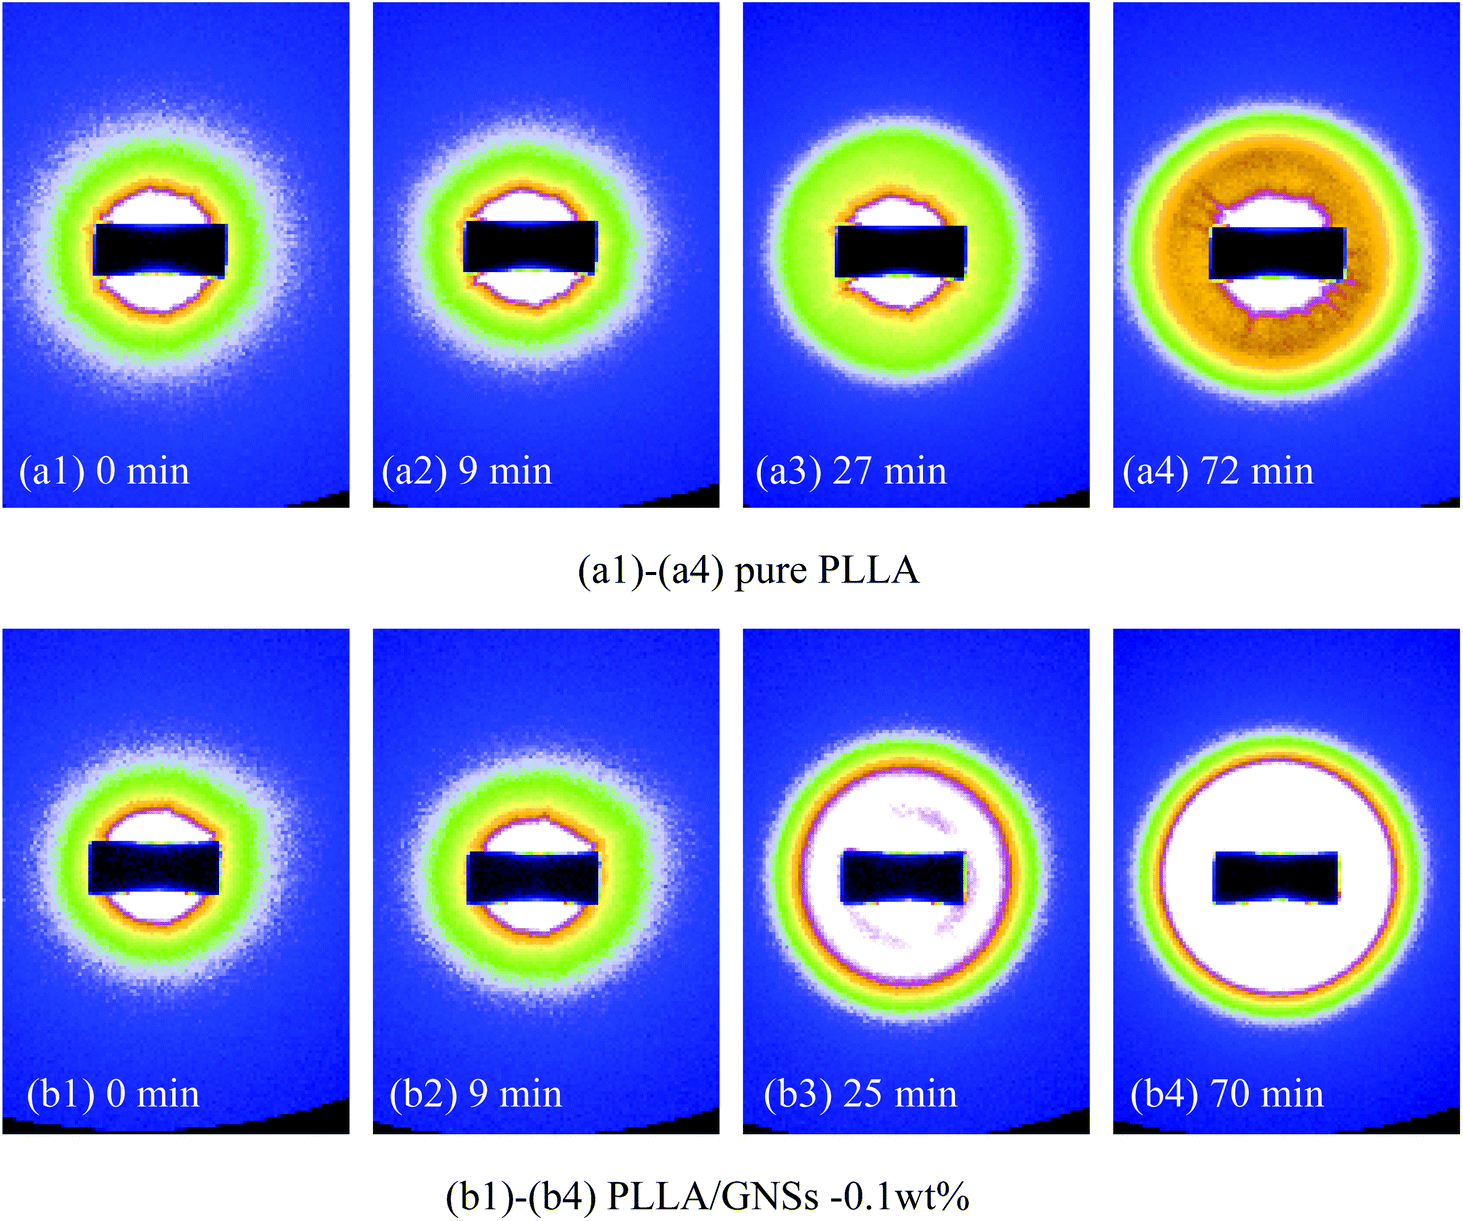 | ||
| Fig. 9 2D SAXS patterns of pure PLLA and PLLA/GNSs composite samples isothermally crystallized at 145 °C: (a1)–(a4) pure PLLA, (b1)–(b4) PLLA/GNSs-0.1 wt%. | ||
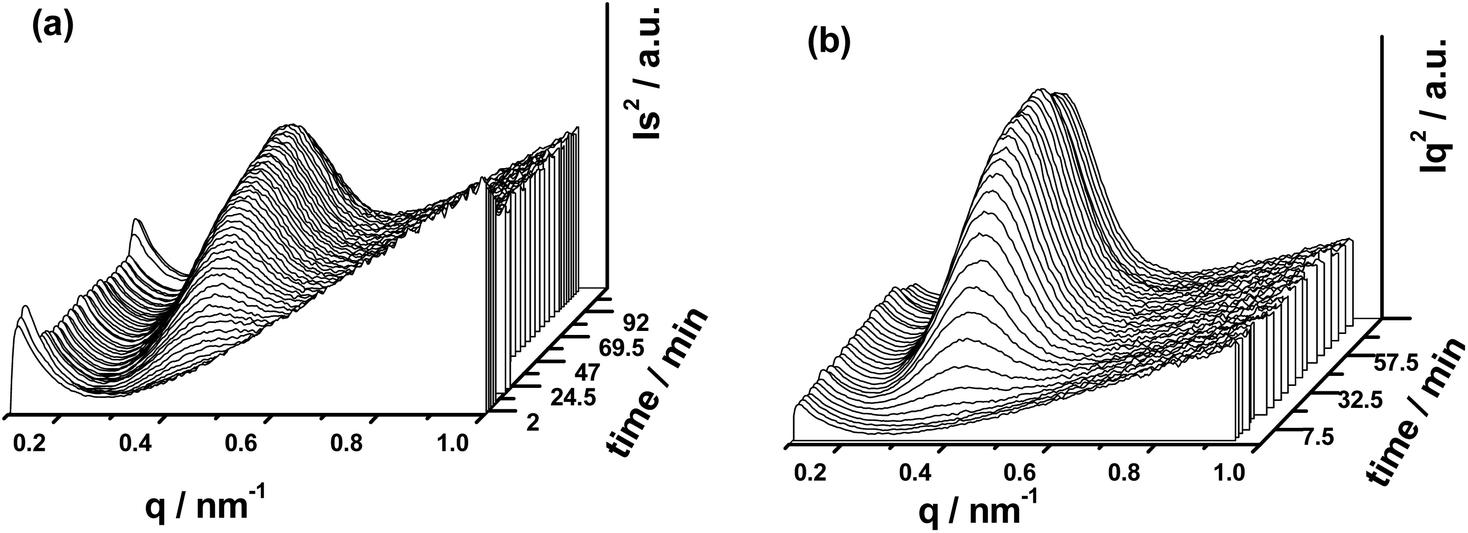 | ||
| Fig. 10 1D SAXS intensity profiles of pure PLLA and PLLA/GNSs composite samples isothermally crystallized at 145 °C: (a) pure PLLA, (b) PLLA/GNSs-0.1 wt%. | ||
From Fig. 9(a1) and (b1), no observable scattering circles related to crystalline structures of PLLA can be found, indicating that all the crystalline structures in the two samples had already been removed when melted. In Fig. 10(a) and (b), no crystalline peaks appeared in both the samples. With the crystallization time increasing, one scattering circle appeared in the 2D SAXS patterns in Fig. 9 and crystalline peaks appeared in the 1D SAXS intensity profiles in Fig. 10. Then the intensity of the scattering circles of both the samples increased with increasing crystallization time till the samples crystallized completely. From the variations of the intensity of the crystalline peaks in Fig. 10, the inducing crystallization time of pure PLLA and PLLA/GNS composite samples was determined as 14 min and 7 min, respectively. The two samples finished their crystallization processes at about 63 min and 45 min, respectively. This agrees with POM observations.
Fig. 11 shows the long periods of PLLA in pure PLLA and PLLA/GNS composite samples isothermally crystallized at 145 °C dependent on crystallization time. During the crystallization processes, long periods, L, of the two samples decreased with increasing isothermal crystallization time and finally reached constant values when crystallization processes finished. Those L values of PLLA/GNS composites were found to be much smaller than those of pure PLLA and the revealed crystallization process finished much earlier than that of pure PLLA.
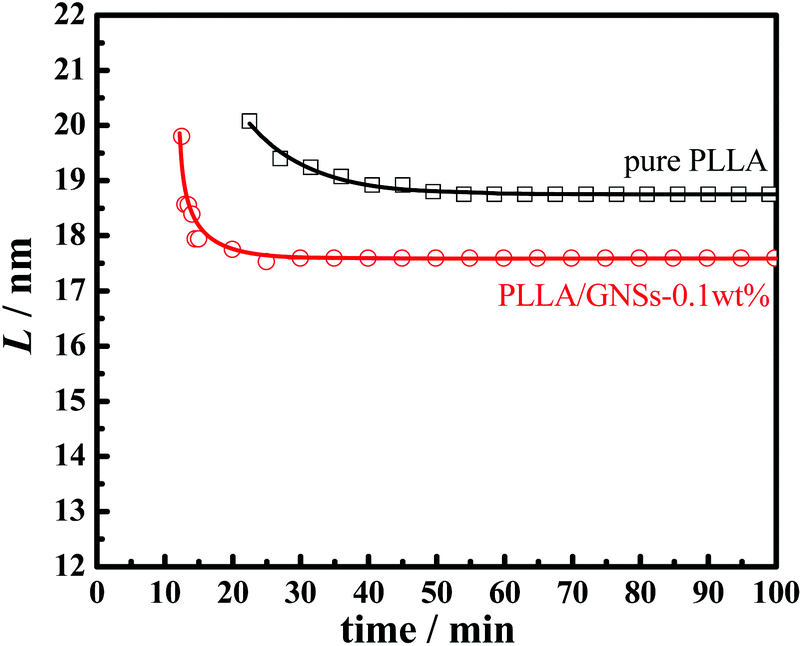 | ||
| Fig. 11 Lamellar parameter L of PLLA in pure PLLA and PLLA/GNSs composite samples isothermally crystallized at 145 °C as a function of crystallization time. | ||
These phenomena can be interpreted successfully by the Dual-lamellar stack model.62 At the initial stage of the isothermal crystallization process, some thick lamellar structures were formed first, and then some lamellar structures formed later were inserted into the ones first formed, which resulted in decreasing the long period, L, during the isothermal crystallization process until the process finished. This phenomenon has also been found in other crystalline polymeric systems.23,27
3.4. Melting behaviors
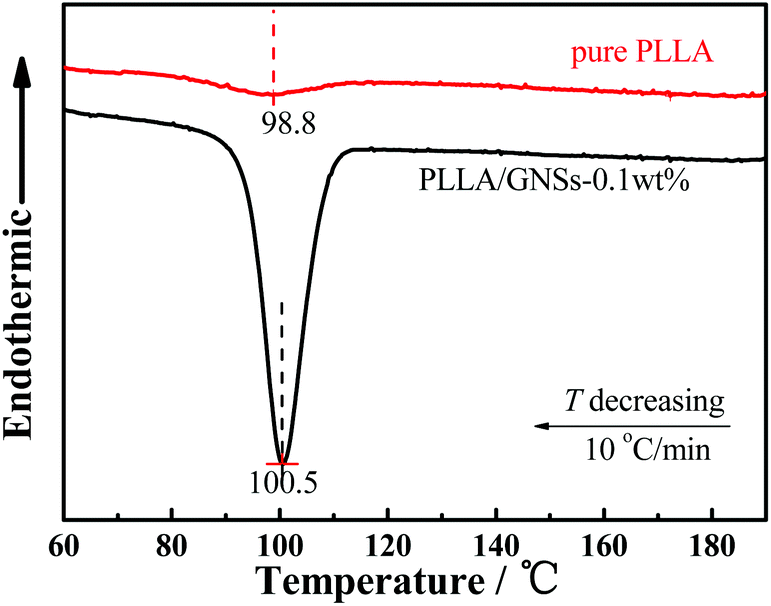
As is known, melting behaviors are closely related to the crystallization behaviors and the resulting crystalline structures of crystalline or semi-crystalline polymers. Fig. 12 shows the melting behaviors of pure PLLA and PLLA/GNS composite samples isothermally crystallized at various Tcs from melts revealed by DSC curves. According to the XRD profiles, only α form PLLA were formed at Tc = 136 °C and only α′ form PLLA were formed at Tc = 86 °C in the pure PLLA sample. At Tc = 106 °C and Tc = 96 °C, within the α′–α crystal formation transition region, both α and α′ form PLLAs were formed in the pure PLLA sample. Because α form PLLA is more perfect than α′ form PLLA, the melting point of α form PLLA is higher than that of α′ form PLLA. The pure PLLA isothermally crystallized at Tc = 136 °C showed a melting point of Tm = 173.0 °C, which is higher than T = 170.5 °C of the pure PLLA isothermally crystallized at Tc = 86 °C. Tm = 173.0 °C can be attributed to the melting behavior of α form PLLA formed at Tc = 136 °C, while T = 170.5 °C cannot be directly attributed to the melting behavior of α′ form PLLA formed at Tc = 86 °C. In fact, from the DSC curve of pure PLLA isothermally crystallized at Tc = 86 °C, an exothermic peak at 152.2 °C can be found lower than the obvious endothermic melting peak at T = 170.5 °C. This exothermic peak can be attributed to α′–α crystal transition on increasing the temperatures.12 So T = 170.5 °C should be attributed to the melting behavior of those reformed α form PLLA in the pure PLLA sample isothermally crystallized at Tc = 86 °C. Interestingly, it seemed that all those α′ form PLLA, formed at Tc = 86 °C, melted and recrystallized as α form PLLA with increasing temperature from a temperature lower than 86 °C to a temperature higher than 180 °C, which makes it difficult to find the endothermic peak related to the melting behavior of α′ form PLLA isothermally crystallized at Tc = 86 °C. Perhaps, the appearance of the exothermic peak at 152.2 °C revealed that the endothermic therapy of α′ form PLLA was less than the exothermic therapy of α′–α crystal transition of PLLA in this pure PLLA sample isothermally crystallized at Tc = 86 °C.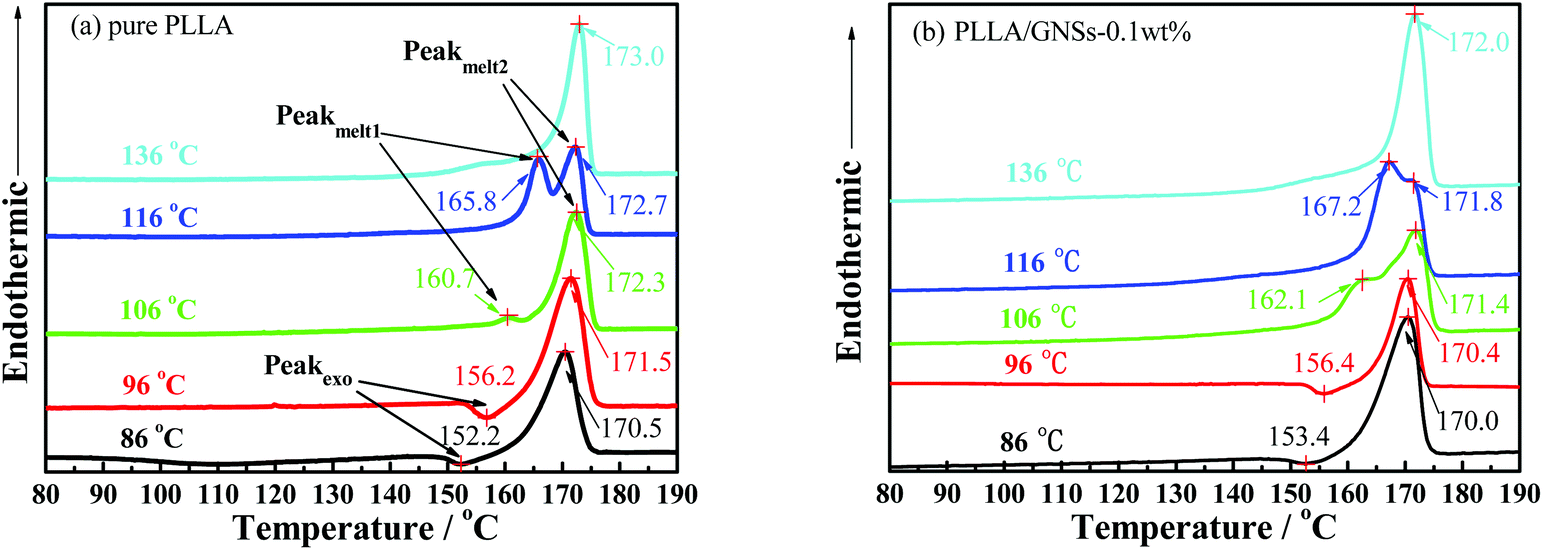 | ||
| Fig. 12 DSC heating thermographs of pure PLLA and PLLA/GNSs composite samples isothermally crystallized at various Tcs from the melt: (a) pure PLLA, (b) PLLA/GNSs-0.1 wt%. | ||
In the DSC curve of pure PLLA isothermally crystallized at Tc = 96 °C, an exothermic peak at 156.2 °C appeared, which is higher than that exothermic peak at 152.2 °C of the sample isothermally crystallized at Tc = 86 °C. The endothermic peak of the melting behavior of the reformed α form PLLA transited from α′ form PLLA increased from Tm = 170.5 °C of the sample isothermally crystallized at Tc = 86 °C to Tm = 171.5 °C of the sample isothermally crystallized at Tc = 96 °C. This implied that the α′ form PLLA in the sample isothermally crystallized at Tc = 96 °C is more perfect than that in the sample isothermally crystallized at Tc = 86 °C. The more perfect α′ form PLLA needs higher temperature to melt and transit into the more perfect α form PLLA. With Tc increasing higher than Tc = 96 °C within the α′–α crystal formation transition region, less α′ form PLLA in the sample results in smaller exothermic peaks while melting, which may be smaller than the endothermic melting peaks of these α′ form PLLAs. For example, as shown in Fig. 12(a), the DSC curve of the sample isothermally crystallized at Tc = 106 °C showed a small endothermic peak at T = 160.7 °C, which resulted from a competition between α′–α crystal transition and the melting process of α′ form PLLA.
When GNSs are added into PLLA, the melting behaviors of the composite samples isothermally crystallized at different Tcs, as shown in Fig. 12(b), are almost similar to those of the pure PLLA samples. The Tms of the α form PLLA in PLLA/GNS-0.1 wt% samples formed during the isothermal crystallization process or reformed from the α′–α crystal transition process are lower than those of the α form PLLA in the pure PLLA sample at Tc = 96 °C, 106 °C and 136 °C, respectively. This indicated that addition of GNSs into PLLA does not change the crystalline forms but prevents the molecular chains of PLLA from forming perfect crystalline structures, because GNSs accelerate the crystallization process and do not leave enough time for PLLA chains to adapt as completely as possible to the strict geometric space of perfect crystals.
In addition, it can be found in Fig. 12(a) and (b) that the α′–α form transformation temperature and Tms of α′ form PLLA in PLLA/GNS-0.1 wt% samples are higher than those of the pure PLLA sample. The addition of GNSs into PLLA improved the perfectness of α′ form PLLA. The influence of GNSs on the formation of α′ form PLLA is different from that of α form PLLA.
3.5. Crystallization mechanism
As revealed in Fig. 5, the addition of GNSs does not change the temperature corresponding to the fastest radius growth rates u of the spherulites of PLLA. At about Tc > 130 °C, the mobility of PLLA molecular chains in both the pure PLLA and PLLA/GNS-0.1 wt% samples are high enough to form a crystal. This meets with the thermodynamic conditions of formation of α form PLLA, whose formation is controlled by the thermodynamic process.4,6,8 The addition of GNSs into PLLA seems to have no influence on the thermodynamics of formation of α form PLLA. The larger radius growth rates u of the PLLA spherulites in PLLA/GNS-0.1 wt% than those in pure PLLA can mainly be attributed to the increase of the segmental mobility of PLLA chains due to addition of GNSs. The existing GNSs help PLLA molecular chains enter crystals faster. This is supported by the same zero growth temperature Tzg of PLLA in PLLA/GNSs as that of pure PLLA.Perhaps, during the crystallization process of PLLA, the segmental mobility of the PLLA molecular chains in PLLA/GNS-0.1 wt% is too fast to adapt perfectly into the crystals or the steric hindrance of GNSs to spherulite growth makes it difficult to form perfect crystals. Thus, the α form PLLA formed in PLLA/GNS-0.1 wt% samples is less perfect than that in the pure PLLA sample, resulting in lower Tm of α form PLLA in PLLA/GNS-0.1 wt% samples than in the pure PLLA sample which were isothermally crystallized at Tc = 136 °C. This was supported by the smaller long period L of α form PLLA in PLLA/GNSs than that in pure PLLA at 145 °C. Even in the α′–α crystal formation transition range, Tms of α form PLLA in PLLA/GNS-0.1 wt% are lower than those in pure PLLA and both of the Tms of α form PLLA in the two samples decreased with decreasing Tc. It seemed that the effect of GNSs is not obviously conflicted with the low molecular mobility at low temperatures. Perhaps, only those PLLA chains with strong enough mobility but without the steric hindrance of GNSs to spherulite growth can form a perfect α form crystal.
Within the α′–α crystal formation transition range, introduction of GNSs resulted in α′ form PLLA with more perfect crystal structures in PLLA/GNS-0.1 wt% than in pure PLLA at the same Tc. In this temperature range, the mobility of PLLA molecular chains in the pure PLLA sample is too low, resulting in less perfect crystals and low crystallization speed. The existence of GNSs can enhance the mobility of PLLA chains and help them enter the α′ form crystal in a more perfect way. So at the same time, GNSs can improve the perfectness of the formed crystals. These effects of GNSs on α′ form PLLA formation are different from the effects on α form PLLA formation. The formation of α′ form PLLA has been reported to be controlled by its kinetic mechanism4,6,8 instead of its thermodynamic mechanism. The different effects of GNSs on α and α′ form PLLA should be attributed to their different formation mechanism. With decreasing Tc in the α′–α crystal formation transition range, Tms of α′ form PLLA in both PLLA/GNS-0.1 wt% and pure PLLA decreased. The effect of GNSs on α′ form PLLA acts together with Tc on the crystallization process, but it does not change the essence of the Tc effect on crystal formation. This implied that the effect of GNSs does not influence the essence of PLLA molecular chain mobility.
The shift of α′–α crystal formation transition of PLLA/GNS-0.1 wt% samples to higher temperatures compared to that of the pure PLLA sample can be interpreted. The acceleration effect of GNSs on the formation of α′ form PLLA is more efficient than the formation of α form PLLA. At the same Tcs within the α′–α crystal formation transition range, more α′ form PLLAs were formed in PLLA/GNS-0.1 wt% than in pure PLLA. At Tcs higher but near the transition range, α′ form PLLA formation in the pure PLLA sample is too less to be detected, while in PLLA/GNS-0.1 wt% samples the α′ form PLLA content is increased due to the addition of GNSs. Thus, the α′–α crystal formation transition of PLLA in PLLA/GNS-0.1 wt% samples is shifted to a higher temperature than that of the pure PLLA sample.
With the kinetically formed α′ crystal and thermodynamically formed α crystal of PLLA in mind, it is of value to compare the effect of GNSs with the effects of PDLLA and DBS. It can be proposed that GNSs could promote formation of α′ crystal more than that of α crystal by enhancing the mobility of PLLA chain and thus accelerating α′ crystal crystallization more. PDLLA and DBS favor formation of α crystal because they can inhibit crystallization of α′ crystal more than that of α crystal. All GNSs, PDLLA and DBS play their roles by mainly affecting formation of α′ crystal. This is why GNSs in PLLA resulted in a shift of α′–α crystal formation transition towards high temperatures, and inversely in PDLLA or DBS. If one compares the effect of GNSs with that of melt shear on the crystal structure and crystallization rate of PLLA,5,19 it can be concluded that both of them could accelerate nucleation of PLLA, but melt shear cannot accelerate spherulite growth19 while GNSs can increase both the nucleation density and spherulite growth rate. This is because the influences of pre-ordered PLLA melt from melt shear are different from the influences of the increase of PLLA chain mobility on nucleation density and spherulite growth rate of PLLA, which also explain the shift of α′–α crystal formation transition towards high or low temperatures resulting from the existence of GNSs or melt shear in PLLA, respectively.
4. Conclusions
Graphene nanosheets (GNSs) are added into poly(L-lactide) (PLLA) by solution blending and a PLLA/GNS composite with GNS content of 0.1 wt% was obtained. The crystalline structures and crystallization behaviors of PLLA in PLLA/GNS composites were investigated and compared with those of pure PLLA. It was found that the formation of α′ form PLLA seems to be more preferred than that of α form PLLA in PLLA/GNSs at some Tcs due to the existence of GNSs, resulting in an observable shift of the α′–α crystal formation transition region of PLLA to high Tcs in PLLA/GNSs compared with that in pure PLLA. POM observations revealed that PLLA spherulites of α crystal were formed in PLLA/GNS composites as well as in pure PLLA and the added GNSs can obviously accelerate the crystallization process of α form PLLA in PLLA/GNSs, including both the nucleation density and the spherulite growth rate u increased due to the increase of the mobility of PLLA chains resulting from the existence of GNSs in PLLA and prior to steric hindrance of GNSs; but, GNSs seemed to have no observable influence on the zero growth temperature Tzg of PLLA which tends to be lower than the equilibrium melting point of PLLA. The SAXS results revealed that the long period L of PLLA in PLLA/GNS composites is much smaller than that in pure PLLA, which can be interpreted successfully by the Dual-lamellar stack model. Investigations on the melting behaviors of PLLA in both PLLA/GNSs and pure PLLA indicated that α′ form PLLA in PLLA/GNS composites isothermally crystallized at different Tcs within the temperature range of the α′–α crystal formation transition region which seem to be more perfect than the α′ crystals in pure PLLA, while the α form PLLA in PLLA/GNSs seems to be less perfect than the α crystals in pure PLLA. The general Tc dependent behaviors of formation of α′ form and α form PLLA in PLLA/GNSs were not changed and they were similar to those in pure PLLA.Acknowledgements
This work was supported by the National Natural Science Foundation of China (51173130, 21274149, and 21374077).References
- P. Xiao, H. Li, S. Huang, H. Wen, D. Yu, Y. Shang, J. Li, Z. Wu, L. An and S. Jiang, CrystEngComm, 2013, 15(39), 7914–7925 RSC.
- H. Abe, Y. Kikkawa, Y. Inoue and Y. Doi, Biomacromolecules, 2001, 2(3), 1007–1014 CrossRef CAS.
- W. Hoogsteen, A. Postema, A. Pennings, G. Tenbrinke and P. Zugenmaier, Macromolecules, 1990, 23(2), 634–642 CrossRef CAS.
- P. Pan, B. Zhu, W. Kai, T. Dong and Y. Inoue, Macromolecules, 2008, 41(12), 4296–4304 CrossRef CAS.
- S. Huang, H. Li, S. Jiang, X. Chen and L. An, Polymer, 2011, 52(15), 3478–3487 CrossRef CAS PubMed.
- P. Pan, Z. Liang, B. Zhu, T. Dong and Y. Inoue, Macromolecules, 2009, 42(9), 3374–3380 CrossRef CAS.
- J. Zhang, K. Tashiro, H. Tsuji and A. Domb, Macromolecules, 2007, 40(4), 1049–1054 CrossRef CAS.
- W. Lai, J. Phys. Chem. B, 2011, 115(38), 11029–11037 CrossRef CAS PubMed.
- I. Kim and Y. Jeong, J. Polym. Sci., Part B: Polym. Phys., 2010, 48(8), 850–858 CrossRef CAS PubMed.
- J. Xu, T. Chen, C. Yang, Z. Li, Y. Mao, B. Zeng and B. Hsiao, Macromolecules, 2010, 43(11), 5000–5008 CrossRef CAS.
- T. Villmow, P. Pötschke, S. Pegel, L. Häussler and B. Kretzschmar, Polymer, 2008, 49(16), 3500–3509 CrossRef CAS PubMed.
- T. Kawai, N. Rahman, G. Matsuba, K. Nishida, T. Kanaya, M. Nakano, H. Okamoto, J. Kawada, A. Usuki, N. Honma, K. Nakajima and M. Matsuda, Macromolecules, 2007, 40(26), 9463–9469 CrossRef CAS.
- P. Pan, W. Kai, B. Zhu, T. Dong and Y. Inoue, Macromolecules, 2007, 40(19), 6898–6905 CrossRef CAS.
- J. Zhang, K. Tashiro, H. Tsuji and A. Domb, Macromolecules, 2008, 41(4), 1352–1357 CrossRef CAS.
- J. Zhang, Y. Duan, H. Sato, H. Tsuji, I. Noda and S. Yan, et al. , Macromolecules, 2005, 38(19), 8012–8021 CrossRef CAS.
- J. Zhang, H. Tsuji, I. Noda and Y. Ozaki, Macromolecules, 2004, 37(17), 6433–6439 CrossRef CAS.
- L. Cartier, T. Okihara, Y. Ikada, H. Tsuji, J. Puiggali and B. Lotz, Polymer, 2000, 41(25), 8909–8919 CrossRef CAS.
- T. Cho and G. Strobl, Polymer, 2006, 47, 1036–1043 CrossRef CAS PubMed.
- Y. Zhong, H. Fang, Y. Zhang, Z. Wang, J. Yang and Z. Wang, ACS Sustainable Chem. Eng., 2013, 1, 663–672 CrossRef CAS.
- M. Allen, V. Tung and R. Kaner, Chem. Rev., 2010, 110(1), 132–145 CrossRef CAS PubMed.
- H. Kim, A. Abdala and C. Macosko, Macromolecules, 2010, 43(16), 6515–6530 CrossRef CAS.
- Z. Xu and C. Gao, Macromolecules, 2010, 43(16), 6716–6723 CrossRef CAS.
- J. Xu, C. Chen, Y. Wang, H. Tang, Z. Li and B. Hsiao, Macromolecules, 2011, 44(8), 2808–2818 CrossRef CAS.
- S. Stankovich, D. Dikin, G. Dommett, K. Kohlhaas, E. Zimney, E. Stach, R. Piner, S. Nguyen and R. Ruoff, Nature, 2006, 442(7100), 282–286 CrossRef CAS PubMed.
- S. Kharchenko, J. Douglas, J. Obrzut, E. Grulke and K. Migler, Nat. Mater., 2004, 3(8), 564–568 CrossRef CAS PubMed.
- L. Li, B. Li, M. Hood and C. Li, Polymer, 2009, 50(4), 953–965 CrossRef CAS PubMed.
- Y. Chen, G. Zhong, J. Lei, Z. Li and B. Hsiao, Macromolecules, 2011, 44(20), 8080–8092 CrossRef CAS.
- L. Li, C. Li and C. Ni, J. Am. Chem. Soc., 2006, 128(5), 1692–1699 CrossRef CAS PubMed.
- N. Patil, L. Balzano, G. Portale and S. Rastogi, Carbon, 2010, 48(14), 4116–4128 CrossRef CAS PubMed.
- M. C. Garcia-Gutierrez, J. J. Hernandez, A. Nogales, P. Pantine, D. R. Rueda and T. A. Ezquerra, Macromolecules, 2008, 41(3), 844–851 CrossRef CAS.
- J. Hernandez, M. Garcia-Gutierrez, A. Nogales, D. Rueda and T. Ezquerra, Macromolecules, 2009, 42(13), 4374–4376 CrossRef CAS.
- R. Haggenmueller, J. Fischer and K. Winey, Macromolecules, 2006, 39(8), 2964–2971 CrossRef CAS.
- A. Karatrantos, R. J. Composto, K. I. Winey and N. Clarke, Macromolecules, 2011, 44(24), 9830–9838 CrossRef CAS.
- D. Xu and Z. Wang, Polymer, 2008, 49(1), 330–338 CrossRef CAS PubMed.
- A. Rozanski, B. Monasse, E. Szkudlarek, A. Pawlak, E. Piorkowska and A. Galeski, et al. , Eur. Polym. J., 2009, 45(1), 88–101 CrossRef CAS PubMed.
- N. Stribeck, A. Zeinolebadi, M. Sari, S. Botta, K. Jankova, S. Hvilsted, A. Drozdov, R. Klitkou, C. Potarniche, J. Christiansen and V. Ermini, Macromolecules, 2012, 45(2), 962–973 CrossRef CAS.
- R. Nowacki, B. Monasse, E. Piorkowska, A. Galeski and J. Haudin, Polymer, 2004, 45(14), 4877–4892 CrossRef CAS PubMed.
- J. Potts, S. Murali, Y. Zhu, X. Zhao and R. Ruoff, Macromolecules, 2011, 44(16), 6488–6495 CrossRef CAS.
- H. Wang and Z. Qiu, Thermochim. Acta, 2011, 526(1–2), 229–236 CrossRef CAS PubMed.
- H. Chen, W. Zhang, X. Du, J. Yang, N. Zhang, T. Huang and Y. Wang, Thermochim. Acta, 2013, 566, 57–70 CrossRef CAS PubMed.
- A. Wurm, M. Ismail, B. Kretzschmar, D. Pospiech and C. Schick, Retarded, Macromolecules, 2010, 43(3), 1480–1487 CrossRef CAS.
- P. Zhu, A. Phillips and G. Edward, J. Chem. Phys., 2012, 136(5), 054903 CrossRef PubMed.
- M. D'Haese, P. Van Puyvelde and F. Langouche, Macromolecules, 2010, 43(6), 2933–2941 CrossRef.
- Y. Li, Polymer, 2011, 52(10), 2310–1318 CrossRef CAS PubMed.
- P. Zhu, J. Tung, G. Edward and L. Nichols, J. Appl. Phys., 2008, 103(12), 124906–124914 CrossRef PubMed.
- S. Nakagawa, K. Kadena, T. Ishizone, S. Nojima, T. Shimizu, K. Yamaguchi and S. Nakahama, Macromolecules, 2012, 45(4), 1892–1900 CrossRef CAS.
- S. Nojima, Y. Ohguma, K. Kadena, T. Ishizone, Y. Iwasaki and K. Yamaguchi, Macromolecules, 2010, 43(8), 3916–3923 CrossRef CAS.
- Y. Takenaka, H. Miyaji, A. Hoshino, A. Tracz, J. K. Jeszka and I. Kucinska, Macromolecules, 2004, 37(26), 9667–9669 CrossRef CAS.
- J. Yang, S. Lin and Y. Lee, J. Mater. Chem., 2012, 22, 10805–10815 RSC.
- H. Wang and Z. Qiu, Thermochim. Acta, 2012, 527, 40–46 CrossRef CAS PubMed.
- T. Cho, W. Stille and G. Strobl, Colloid Polym. Sci., 2007, 285, 931–934 CAS.
- G. Strobl and T. Y. Cho, Eur. Phys. J. E, 2007, 23, 55–65 CrossRef CAS PubMed.
- H. Wen, S. Jiang, Y. Men, X. Zhang, L. An and Z. Wu, J. Chem. Phys., 2009, 130(16), 164909 CrossRef PubMed.
- J. Kobayashi, T. Asahi, M. Ichiki, A. Okikawa, H. Suzuki, T. Watanabe, E. Fukuda and Y. Shikinami, J. Appl. Phys., 1995, 77, 2957–2973 CrossRef CAS PubMed.
- C. Marega, A. Marigo, V. Di Noto and R. Zannett, Makromol. Chem., 1992, 193, 1599–1606 CrossRef CAS PubMed.
- J. Zhang, K. Tashiro, A. Domb and H. Tsuji, Macromol. Symp., 2006, 242(1), 274–278 CrossRef CAS PubMed.
- Y. Ohtani, K. Okumura and K. Kawaguchi, J. Macromol. Sci. Phys., 2003, 42(3–4), 875–888 CrossRef.
- D. Dikovsky, G. Marom, C. Avila-Orta, R. Somani and B. Hsiao, Polymer, 2005, 46, 3096–3104 CrossRef CAS PubMed.
- A. Patti, J. Phys. Chem. B, 2014, 118, 3731–3742 CrossRef CAS PubMed.
- H. Xiao, W. Lu and J. Yeh, J. Appl. Polym. Sci., 2009, 113, 112–121 CrossRef CAS PubMed.
- H. Tsuji and S. Miyauchi, Polym. Degrad. Stab., 2001, 71, 415–424 CrossRef CAS.
- B. Chu and B. Hsiao, Chem. Rev., 2001, 101(6), 1727–1762 CrossRef CAS PubMed.
| This journal is © The Royal Society of Chemistry 2015 |