
 Open Access Article
 This Open Access Article is licensed under a Creative Commons Attribution-Non Commercial 3.0 Unported Licence
Fabrication of porous organic polymers in the form of powder, soluble in organic solvents and nanoparticles: a unique platform for gas adsorption and efficient chemosensing†
Sujoy
Bandyopadhyay
,
Pragyan
Pallavi
,
Amith G.
Anil
and
Abhijit
Patra
*
Department of Chemistry, Indian Institute of Science, Education and Research (IISER) Bhopal, Bhopal-462066, India. E-mail: abhijit@iiserb.ac.in; Fax: +91 (0)755 409 2392; Tel: +91 (0)755 669 2378
First published on 9th April 2015
Abstract
Conjugated porous organic polymers based on a novel core of tetraphenyl-5,5-dioctylcyclopentadiene (TPDC) have been fabricated in the form of powder (P1), soluble in common organic solvents (P2) as well as aqueous dispersion of nanoparticles (P3). Fine tuning of the conditions of polycondensation reactions involving tetrakis(4-bromophenyl)-5,5-dioctylcyclopentadiene and diethynylbenzene leads to the formation of TPDC based polymers in three different forms. P1, P2 and P3 possess high thermal stability (up to 375 °C) and are porous in nature. The Brunauer–Emmett–Teller (BET) surface area and total pore volume of P1 were estimated to be 405 m2 g−1 and 0.68 cm3 g−1 respectively. Solid P1 was explored for hydrogen and carbon dioxide adsorption. Solution of P2 and aqueous dispersion of P3 exhibit strong cyan fluorescence and are applied for the sensing of nitroaromatics. Steady state and time resolved fluorescence measurements reveal the underlying photophysics of amplified fluorescence quenching of P2 and P3 by nitroaromatics. Porosity, gas adsorption, as well as solubility, strong fluorescence and sensing capabilities establish TPDC based porous polymers as new multifunctional materials and can find broad applications in sensing and optical devices.
Introduction
Porous organic polymers (POPs) have become an appealing field of research owing to their promising applications in various technological fields.1 POPs with high surface areas have been used mostly in gas storage, separation and heterogeneous catalysis.2–4 Of late, combination of porosity and π-conjugation leads to the development of the field of conjugated microporous organic polymers (CMPs).5–10 Such π-conjugated porous materials possess immense potential in various optoelectronic and biological applications ranging from energy storage,7 tunable emission and light harvesting8 to chemo and biosensors.9 Recently mechanistic details on the origin of microporosity through the network forming Sonogashira cross coupling reactions have been demonstrated.10 Computational methodologies have also been developed to understand the network structure in POPs as well as to predict the novel design principles.11In spite of having interesting properties, poor solubility and hence difficulty in processability of POPs have posed a major bottleneck for their device integration and practical applications.12 Attempts were made to achieve desired solubility by fine tuning the structure and rigidity of macromolecular building blocks.13 By maintaining the microporous structure and π-conjugation, pyrene based soluble hyperbranched polymers and linear polymers have been synthesized.14 Preparation of solution dispersible POP nanoparticles is found to be another approach that has gained significant attention.15 However, the challenge remains to develop new multifunctional materials integrating the different properties like microporosity, gas adsorption in one hand and solubility, processability as well as strong fluorescence and sensing capabilities on the other hand. Fine tuning of covalent and non-covalent interactions and polymerization conditions can hold the key for the realization of the above mentioned theme.
Addressing the issue, herein we have developed soluble, conjugated and strongly fluorescent POPs employing a novel core of tetraphenyl-5,5-dioctylcyclopentadiene (TPDC). Fine tuning of the polymerization reactions involving tetrakis(4-bromophenyl)-5,5-dioctylcyclopentadiene (TBDC) and diethynylbenzene (DEB) as monomers allows us to obtain TPDC based POPs (Scheme 1) in the form of insoluble powder (P1), soluble in common organic solvents (P2) as well as aqueous dispersion of nanoparticles (P3). Surface area analysis coupled with molecular dynamics simulations, microscopic, steady state and time resolved spectroscopic investigations provide a unified picture of the network structure, physicochemical properties and efficient sensing capabilities of TPDC based POPs. Fabrication of cyclopentadiene based POPs in three different forms, solid, solution and nanoparticles starting from the same monomer and comonomer and exploration of their gas adsorption and sensing potential, to the best of our knowledge, have not been reported in the context of porous organic materials.
 | ||
| Scheme 1 Fabrication of porous organic polymers involving TBDC (tetrakis-(4-bromophenyl)-5,5-dioctylcyclopentadiene) and DEB (diethynylbenzene) in the form of powder (P1), soluble in organic solvents (P2) and aqueous dispersion of nanoparticles (P3). Fabrication conditions: (i) [Pd(PPh3)4], CuI, diisopropylamine, toluene, 80 °C, 48 h, (ii) [Pd(PPh3)2Cl2], CuI, diisopropylamine, toluene, 80 °C, 12 h and (iii) [Pd(PPh3)4], CuI, SDS, water, diisopropylamine, toluene, 50 °C, 48 h. | ||
Results and discussion
TBDC was prepared from tetraphenylcyclopentadienone. Alkyl chains in TBDC impart flexibility in the resulting network. Fine tuning of concentration of a catalyst, time and temperature of (A4 + B2) type Sonogashira cross-coupling polycondensation led to the formation of P1, P2 and P3 (Scheme 1). Soluble polymers and nanoparticles were precipitated by adding toluene solution of P2 and water dispersion of P3 into excess of cold methanol respectively. The precipitated polymers were thoroughly washed by multiple Soxhlet extractions with different solvents. Finally, P2 and P3 obtained in the form of powders are soluble in common organic solvents like tetrahydrofuran, dichloromethane, chloroform, toluene and dimethylformamide.The FTIR spectra of TPDC POPs (P1, P2, P3) show a characteristic band at 2200 cm−1 corresponding to C![[triple bond, length as m-dash]](https://www.rsc.org/images/entities/char_e002.gif) C stretching indicating coupling between TBDC and DEB (Fig. S1–S3†). The signal at 89 ppm in the 13C NMR spectrum of P2 and P3 further confirms the presence of CC (Fig. S6†). Thermogravimetric analysis (TGA) showed that all the polymers P1, P2 and P3 are thermally stable up to 375 °C (Fig. S7†). The weight average molecular weight (Mw) of P2 was found to be 16 kDa with a polydispersity index of 1.2, as measured by gel permeation chromatography (GPC). Field-emission scanning electron microscopy (FESEM) showed a plate like morphology for P1 (Fig. 1a). A rapidly precipitated powder of P2 was found to exhibit an aggregated sphere like morphology with an average diameter less than 100 nm (Fig. 1b). Aqueous dispersion of P3 revealed nanoparticles with a spherical morphology (Fig. 1c). The average diameter of the particles ranges from 70 to 110 nm, as estimated by FESEM and corroborated with the profile obtained by dynamic light scattering (DLS) measurements (Fig. 1c, inset).
C stretching indicating coupling between TBDC and DEB (Fig. S1–S3†). The signal at 89 ppm in the 13C NMR spectrum of P2 and P3 further confirms the presence of CC (Fig. S6†). Thermogravimetric analysis (TGA) showed that all the polymers P1, P2 and P3 are thermally stable up to 375 °C (Fig. S7†). The weight average molecular weight (Mw) of P2 was found to be 16 kDa with a polydispersity index of 1.2, as measured by gel permeation chromatography (GPC). Field-emission scanning electron microscopy (FESEM) showed a plate like morphology for P1 (Fig. 1a). A rapidly precipitated powder of P2 was found to exhibit an aggregated sphere like morphology with an average diameter less than 100 nm (Fig. 1b). Aqueous dispersion of P3 revealed nanoparticles with a spherical morphology (Fig. 1c). The average diameter of the particles ranges from 70 to 110 nm, as estimated by FESEM and corroborated with the profile obtained by dynamic light scattering (DLS) measurements (Fig. 1c, inset).
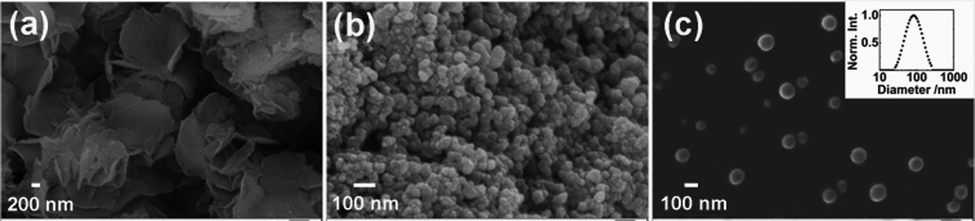 | ||
| Fig. 1 FESEM images of (a) P1, (b) P2 and (c) P3; inset: DLS profile of aqueous dispersion of P3. | ||
The nitrogen sorption profile of P1 at 77 K indicates type II isotherm (Fig. 2a). Gas uptake at low relative pressures (P/P0 < 0.1) signifies a microporous character. A large hysteresis loop observed at a relative pressure of P/P0 = 0.5 indicates the existence of mesopores, originating probably due to interparticulate voids.7,14 The Brunauer–Emmett–Teller (BET) surface area and total pore volume of P1 were estimated to be 405 m2 g−1 and 0.68 cm3 g−1 respectively. Pore size distribution (Fig. 2a, inset) calculated by the nonlocal density functional theory (NLDFT) method revealed that the micropores are centered at 1.4 nm, whereas mesopores range from 3 to 15 nm. Hydrogen and carbon dioxide uptake of P1 (Fig. 2b) were estimated to be 68 cm3 g−1 (3.04 mmol g−1 at 1 bar, 77 K) and 16 cm3 g−1 (0.71 mmol g−1 at 1 bar, 298 K) respectively. The nitrogen adsorption–desorption isotherms of P2 and P3 revealed a porous nature with a BET surface area of 39 m2 g−1 and 143 m2 g−1 respectively (Fig. S11, Table S2†).
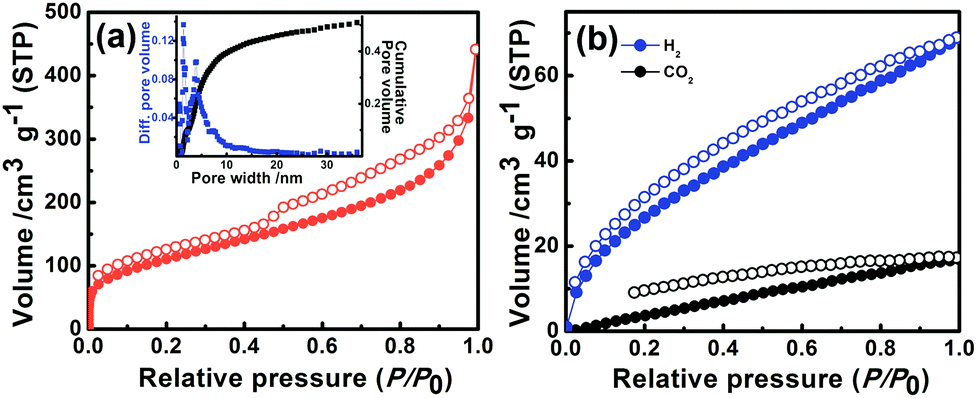 | ||
| Fig. 2 (a) Nitrogen sorption isotherms (filled circles: adsorption; hollow circles: desorption) of P1 measured at 77 K. Inset: pore-size distribution profiles estimated using the NLDFT method (blue squares: differential pore volume and black squares: cumulative pore volume). (b) Gas sorption isotherms of P1 for hydrogen (blue) at 77 K and carbon dioxide (black) at 298 K (filled circles: adsorption; hollow circles: desorption). | ||
In order to gain an insight into the molecular level structure and to understand the porous nature of TPDC based polymers, an atomistic model was built and molecular dynamics simulations were carried out.11a Grand Canonical Monte Carlo (GCMC) simulations were performed at 77 K to obtain nitrogen sorption.11b The characteristics of the simulated model (Fig. 3) were found to be quite consistent with the experimental observations for P1.† The solvent accessible surface area and pore volume calculated using a probe radius of 1.82 Å (the kinetic radius of N2) was found to be 345 m2 g−1 and 0.45 cm3 g−1 respectively (Fig. S12†).
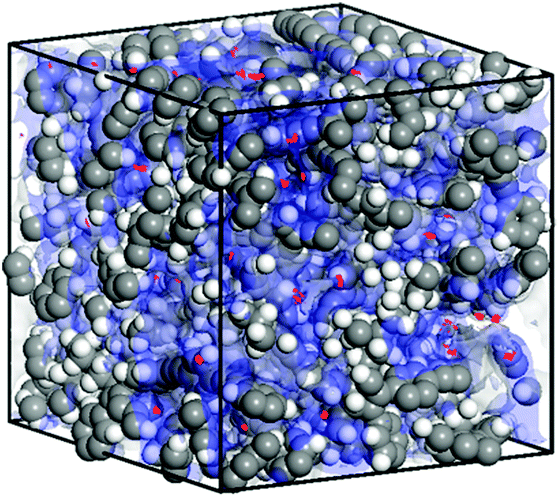 | ||
| Fig. 3 Snapshot of nitrogen sorption in a simulated amorphous cell of TPDC based POPs at 1 bar and 77 K (red dots: density field of adsorbed nitrogen molecules; blue shades: solvent accessible surfaces). | ||
Solid P1 does not show any detectable fluorescence. However, besides porous characters, the solution of P2 and aqueous dispersion of P3 were found to be strongly fluorescent. Electronic absorption and emission spectra of P2 in tetrahydrofuran (THF) show absorption with λmax at 365 nm and strong fluorescence (Φf = 27%) with λmax at 468 nm (Fig. 4a). Aqueous dispersion of P3 exhibits absorption with λmax at 340 nm and emission (Φf = 8%) peaks at 470 nm (Fig. 4b).† The intense absorption band of TPDC POPs is assignable to the π–π* transition of the conjugated framework. Absorption and emission maxima of polymers (P2 and P3) were found to be red shifted compared to that of the TPDC core showing λabsmax at 326 nm and λemmax at 427 nm (Fig. S15†). The observed red shift can be attributed to the three dimensional extended π-conjugated framework in polymers.9a The fluorescence excitation spectra of P2 and P3 (Fig. 4) are found to be very similar to the absorption spectra indicating that the emission is initiated by a vertical excitation process. The excited state dynamics were investigated using a time-correlated single-photon counting experiment. The weighted average lifetimes of P2 in THF and aqueous dispersion of P3 are found to be 0.94 and 0.68 ns respectively (Fig. S17, Table S3†).
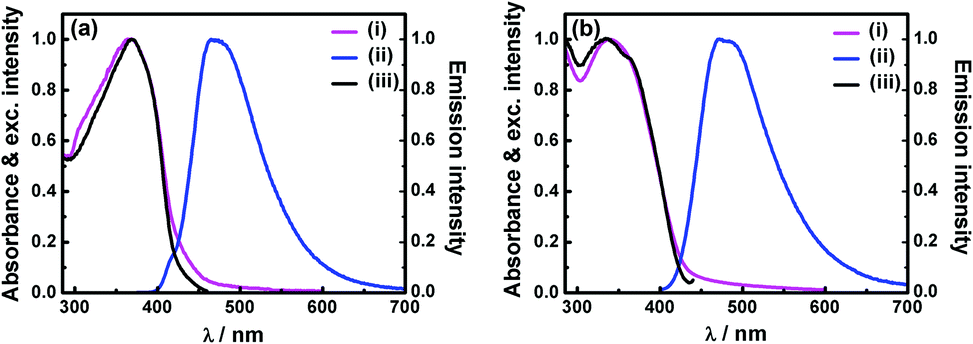 | ||
| Fig. 4 (a) Spectroscopic features of P2 in THF: normalized (i) absorption, (ii) emission (λexc = 365 nm), and (iii) excitation (λem = 468 nm) spectra. (b) Spectroscopic features of aqueous dispersion of P3: normalized (i) absorption, (ii) emission (λexc = 340 nm), and (iii) excitation (λem = 470 nm) spectra. | ||
Strong fluorescence and porosity in P2 and P3 prompted us to explore their potential in chemosensing. A range of electron deficient nitroaromatic compounds (NC) like nitrobenzene, m-dinitrobenzene, 2,4-dinitrotoluene and picric acid (PA) was chosen as electron deficient analytes. Upon successive addition of NC, the fluorescence intensity of THF solution of P2 and aqueous dispersion of P3 decreases gradually (Fig. 5a and b and Fig. S19a–S24a). PA being the most electron deficient exhibits the best quenching efficiency. At PA concentrations of 1.33 and 0.23 mM fluorescence signals of P2 and P3 were quenched by 93% and 98% respectively (Fig. 5a and b, inset). Further addition of PA led to complete quenching. Quenching of fluorescence of P3 can be observed at a PA concentration as low as 2 ppm indicating high sensitivity. The Stern–Volmer plots bend upwards for P2 and P3 on increasing concentration of NC suggesting an amplified quenching (Fig. 5c and d and Fig. S19b–S24b†).16 No significant decrease of average fluorescence lifetimes of P2 and P3 with increasing concentrations of NC indicates that the quenching process is likely to be static in nature (Fig. 5c and d, inset).17![[thin space (1/6-em)]](https://www.rsc.org/images/entities/char_2009.gif) † Such amplified static quenching can be attributed to the loose ground state association of nitroaromatic molecules with the pores of P2 and P3.18 Accordingly, a quenching sphere model was employed to fit the quenching data (Fig. 5c and d and Fig. S19b–S24b†); the static quenching constants for P2 and P3 at lower concentrations of PA were found to be 2.1 × 10³ and 7.6 × 10⁴ L mol−1 respectively.17,18† The quenching efficiency of nitroaromatic compounds towards P2 and P3 was found to follow the order NB < DNB < DNT < PA, consistent with the trend reported earlier for other covalent organic polymers (Tables S6 and S7†).19 As indicated, nanoparticle dispersions (P3) exhibit enhanced quenching compared to that of isolated species in THF (P2). It is presumably due to the higher surface area and more accessible cavities leading to efficient interactions of nitroaromatic molecules with the nanoaggregates.16,18
† Such amplified static quenching can be attributed to the loose ground state association of nitroaromatic molecules with the pores of P2 and P3.18 Accordingly, a quenching sphere model was employed to fit the quenching data (Fig. 5c and d and Fig. S19b–S24b†); the static quenching constants for P2 and P3 at lower concentrations of PA were found to be 2.1 × 10³ and 7.6 × 10⁴ L mol−1 respectively.17,18† The quenching efficiency of nitroaromatic compounds towards P2 and P3 was found to follow the order NB < DNB < DNT < PA, consistent with the trend reported earlier for other covalent organic polymers (Tables S6 and S7†).19 As indicated, nanoparticle dispersions (P3) exhibit enhanced quenching compared to that of isolated species in THF (P2). It is presumably due to the higher surface area and more accessible cavities leading to efficient interactions of nitroaromatic molecules with the nanoaggregates.16,18
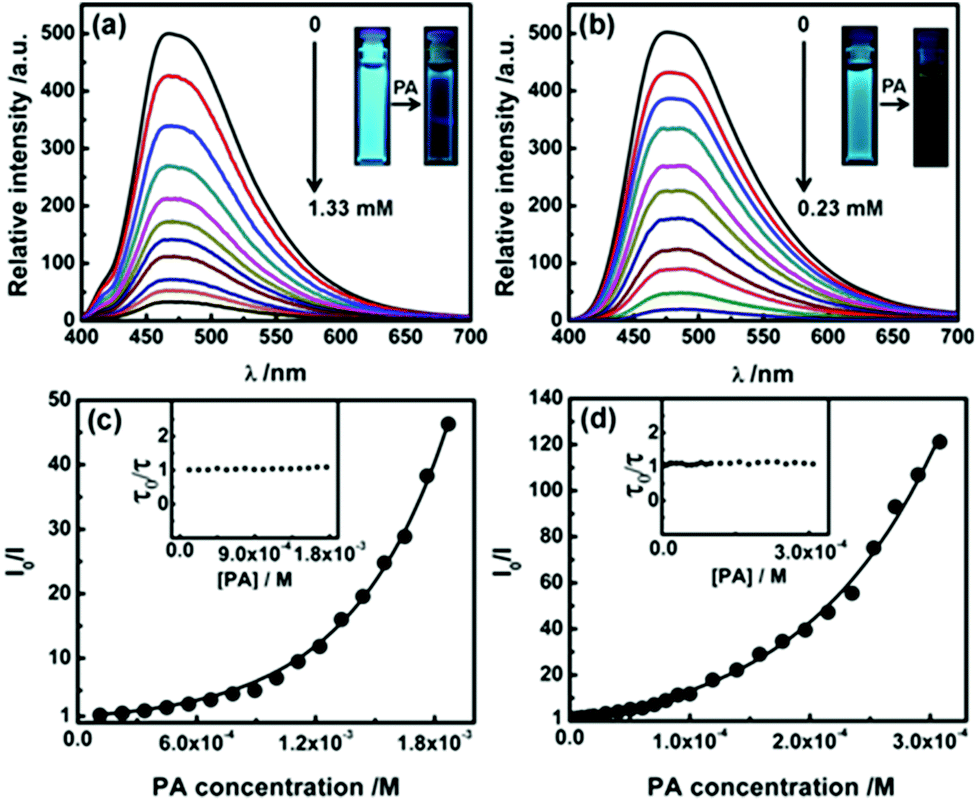 | ||
| Fig. 5 (a) Emission spectra demonstrating the quenching of fluorescence of (a) P2 in THF (λex = 365 nm) and (b) P3 in water (λex = 340 nm) with increasing concentrations of picric acid (PA). Inset: photographs of (a) P2 and (b) P3 before and after addition of PA under the illumination of UV light at 365 nm. Stern–Volmer plots of I0/I against the concentration of PA (I0 = fluorescence intensity at [PA] = 0 M) of (c) P2 in THF and (d) P3 in water; the inset graphs refer to plots of the corresponding relative fluorescence lifetime (τ0/τ) against various concentrations of PA (τ0 = lifetime of a polymer in the absence of PA). | ||
Conclusions
A convenient protocol has been demonstrated to fabricate cyclopentadiene based porous organic polymers in three different forms: powder (P1), soluble in organic solvents (P2) and aqueous dispersion of nanoparticles (P3). Solid P1 was explored for hydrogen and carbon dioxide adsorption while soluble counterparts P2 and P3 demonstrate efficient sensing of picric acid by amplified fluorescence quenching. Currently, we are exploring the possibility of fluorescence tuning by attaching suitable acceptor dyes at the surface of nanoparticles. Preliminary exploration suggests facile energy transfer from nanoparticles P3 to surface-bound Rhodamine 6G molecules leading to the switching of emission towards longer wavelength regions (Fig. S26†). The current study paves the way for the development of multifunctional materials based on porous organic polymers.Experimental
General methods
All reagents and solvents were purchased from commercial sources and used without purification. 1H and 13C-NMR spectra were recorded on Bruker Avance III 500, 700 MHz NMR spectrometers. FTIR measurements were carried out on a Perkin Elmer FTIR spectrophotometer. Thermogravimetric analysis (TGA) was carried out using a Perkin Elmer TGA-6000 instrument. The samples were heated at a rate of 10 °C min−1 under a nitrogen atmosphere to a maximum of 900 °C. Molecular weights of the soluble polymers were estimated by Gel Permeation Chromatography (GPC, Polymer Laboratories). THF was used as the eluent with a flow rate of 1 mL min−1 at 40 °C and polystyrene was used as the calibration standard. Universal calibration was used by employing refractive indexes and viscometry detectors. Ultrasonication was carried out with a Branson sonifier (model: W-450) using a microtip of 5 mm diameter.The surface morphology of all polymers and size of the nanoparticles were examined using a Carl Zeiss (UltraPlus) field emission scanning electron microscope (FESEM). Energy dispersive X-ray spectroscopy was performed using a spectrometer (Oxford Instruments X-MaxN) attached to FESEM. Dynamic light scattering (DLS) measurements of aqueous dispersion of nanoparticles (P3) were carried out with a Beckman Coulter Delso Nano C DLS set up.
All gas adsorption experiments were performed on a Quantachrome Autosorb QUA211011 equipment. Nitrogen adsorption isotherms were analyzed using ASIQwin software. Samples were degassed at 80 °C for 12 h under vacuum before analysis. Nitrogen and hydrogen adsorption–desorption isotherms were measured at 77 K and for carbon dioxide at 298 K. Polymer surface areas and pore size distributions were measured by using nitrogen adsorption–desorption isotherms. The total pore volume of P1 was estimated to be 0.68 cm3 g−1 according to single point adsorption at P/P0 = 0.99. Pore size distributions were derived from the nonlocal density functional theory (NLDFT) method. The micropore surface area of P1 calculated from the N2 adsorption isotherm using the t-plot method based on the Halsey thickness equation was found to be 75 m2 g−1.
A molecular model of TPDC based polymers was built using the Materials Studio 6.1 package (Accelrys). The model structure of the polymer was constructed with a net molar mass of 16358 g mol−1. All molecular dynamics and energy minimization were performed with a Discover module using COMPASS force field. Multiple compression and decompression were carried out to equilibrate the amorphous cell.20 The Noose Hover thermostat during NVT steps and the Andersen barostat during NPT steps were used. The final density of the relaxed structure was 0.85 g cm−3. The adsorption isotherm of nitrogen was simulated at 77 K up to 1 bar using GCMC simulation.†
UV-vis absorption spectra were recorded on a Cary 100 spectrophotometer. Steady state fluorescence measurements were carried out on a Jobin Yvon Horiba Model Fluorolog-3-21. The fluorescence quantum yields of P2 in THF and P3 in water were estimated by comparison with coumarin-102 in ethanol (Φf = 0.76) and corrected for the refractive index of the solvent.21 Time-resolved fluorescence measurements were carried out using a time-correlated single-photon counting (TCSPC) spectrometer (Delta Flex-01-DD/HORIBA). Delta diode laser at 370 nm with FWHM = 154 ps was used as the excitation source. A picosecond photon detection module with a photomultiplier tube was used as the detector. Instrument response function was recorded by using an aqueous solution of Ludox. Decay curves were analyzed by nonlinear least-squares iteration using IBH DAS6 (version 6.8) decay analysis software.
Synthesis of monomers
1H NMR: δH (500 MHz, CDCl3) 7.22–7.11 (16 H, m), 7.00–6.96 (4 H, m), 4.04 (2 H, s); 13C NMR: δC (126 MHz, CDCl3) 144.55, 139.75, 136.60, 136.48, 129.85, 128.15, 128.05, 127.84, 126.69, 126.40, 45.81; MS (MALDI-TOF): calculated for C29H22, 370.48; found 370.19.
1H NMR: δH (500 MHz, CDCl3) 7.21 (4 H, t, J 7.5), 7.17 (2 H, d, J 7.1), 7.07 (4 H, d, J 7.8), 7.06–7.01 (6 H, m), 6.82 (4 H, d, J 7.4), 1.73–1.71 (4 H, m), 1.32–1.04 (24 H, m), 0.85 (6 H, t, J 7.1); 13C NMR: δC (126 MHz, CDCl3) 147.75, 144.06, 137.14, 136.17, 130.31, 129.71, 127.93, 127.36, 126.37, 126.06, 64.57, 35.48, 31.84, 29.77, 29.38, 29.23, 23.17, 22.66, 14.12; MS (MALDI-TOF): calculated for C45H54, 594.91; found 594.37.
1H NMR: δH (500 MHz, CDCl3) 7.36 (4 H, d, J 8.5), 7.20 (4 H, d, J 8.5), 6.88 (4 H, d, J 8.5), 6.64 (4 H, d, J 8.5), 1.69–1.66 (4 H, m), 1.26–1.04 (24 H, m), 0.86 (6 H, t, J 7.1); 13C NMR δC (126 MHz, CDCl3) 147.74, 142.95, 135.18, 134.11, 131.72, 131.52, 131.07, 131.06, 121.05, 120.86, 64.80, 35.35, 31.80, 29.62, 29.30, 29.18, 23.16, 22.64, 14.11; MS (MALDI-TOF): calculated for C45H50Br4, 910.49; found 910.04.
Fabrication of polymers in different forms
FTIR (νmax/cm–1): 3037, 2926, 2852, 2202, 1596, 1489, 829; EDX analysis (wt%): C 98.74, Br 0.74, Pd 0.53.
GPC (THF): (Mn = 13 kDa, Mw = 16 kDa); FTIR (νmax/cm–1): 3035, 2925, 2850, 2205, 1595, 1485, 830; 1H NMR: δH (700 MHz; CDCl3) 7.50–7.47 (m, Ar–H), 7.43–7.31 (m, Ar–H), 7.20 (br, Ar–H), 7.01 (br, Ar–H), 6.90 (b, Ar–H), 6.77 (br, Ar–H), 6.66 (br, Ar–H), 1.71 (m, CH2), 1.34–1.07 (br, CH2), 0.86 (t, CH3); EDX analysis (wt%): C 98.51, Br 1.07, Pd 0.42.
An aliquot of nanoparticle dispersion was precipitated by addition to excess of cold methanol and collected after washing with water, methanol and acetone, and then rigorously washed by Soxhlet extraction for 24 h each with methanol and acetone respectively. It was then dried under vacuum at 70 °C and was used for FTIR and NMR characterization.
FTIR (νmax/cm–1) 3042, 2928, 2854, 2212, 1592, 1484, 834; 1H NMR: δH (700 MHz; CDCl3) 7.50–7.47 (m, Ar–H), 7.43–7.34 (m, Ar–H), 7.20 (br, Ar–H), 7.01 (br, Ar–H), 6.89 (br, Ar–H), 6.77 (br, Ar–H), 6.70–6.63 (br, Ar–H), 1.71 (m, CH2), 1.31–1.09 (br, CH2), 0.86 (t, CH3).
Acknowledgements
Financial support from DST (SB/FT/CS-081/2013), New Delhi and infrastructural support from IISER Bhopal are gratefully acknowledged. SB thanks IISERB and PP thanks UGC for fellowship.Notes and references
- (a) J. Germain, J. M. J. Fréchet and F. Svec, Small, 2009, 5, 1098 CrossRef CAS PubMed; (b) A. Thomas, Angew. Chem., Int. Ed., 2010, 49, 8328 CrossRef CAS PubMed; (c) R. Dawson, A. I. Cooper and D. J. Adams, Prog. Polym. Sci., 2012, 37, 530 CrossRef CAS PubMed; (d) D. Wu, F. Xu, B. Sun, R. Fu, H. He and K. Matyjaszewski, Chem. Rev., 2012, 112, 3959 CrossRef CAS PubMed.
- (a) T. Ben, H. Ren, S. Ma, D. Cao, J. Lan, X. Jing, W. Wang, J. Xu, F. Deng, J. M. Simmons, S. Qiu and G. Zhu, Angew. Chem., Int. Ed., 2009, 48, 9457 CrossRef CAS PubMed; (b) D. Yuan, W. Lu, D. Zhao and H. C. Zhou, Adv. Mater., 2011, 23, 3723 CrossRef CAS PubMed.
- (a) E. Preis, C. Widling, U. Scherf, S. Patil, G. Brunklaus, J. Schmidt and A. Thomas, Polym. Chem., 2011, 2, 2186 RSC; (b) Q. Chen, M. Luo, P. Hammershøj, D. Zhou, Y. Han, B. W. Laursen, C. G. Yan and B. H. Han, J. Am. Chem. Soc., 2012, 134, 6084 CrossRef CAS PubMed; (c) S. Chakraborty, Y. J. Colón, R. Q. Snurr and S. T. Nguyen, Chem. Sci., 2015, 6, 384 RSC.
- (a) Q. Liang, J. Liu, Y. Wei, Z. Zhao and M. J. MacLachlan, Chem. Commun., 2013, 49, 8928 RSC; (b) R. K. Totten, Y. S. Kim, M. H. Weston, O. K. Farha, J. T. Hupp and S. T. Nguyen, J. Am. Chem. Soc., 2013, 135, 11720 CrossRef CAS PubMed.
- (a) A. I. Cooper, Adv. Mater., 2009, 21, 1291 CrossRef CAS PubMed; (b) F. Vilela, K. Zhang and M. Antonietti, Energy Environ. Sci., 2012, 5, 7819 RSC; (c) Y. Xu, S. Jin, H. Xu, A. Nagai and D. Jiang, Chem. Soc. Rev., 2013, 42, 8012 RSC.
- (a) K. V. Rao, S. Mohapatra, T. K. Maji and S. J. George, Chem. – Eur. J., 2012, 18, 4505 CrossRef CAS PubMed; (b) K. Zhang, D. Kopetzki, P. H. Seeberger, M. Antonietti and F. Vilela, Angew. Chem., Int. Ed., 2013, 52, 1432 CrossRef CAS PubMed; (c) Y. Xie, T. T. Wang, X. H. Liu, K. Zou and W. Q. Deng, Nat. Commun., 2013, 4, 1960 Search PubMed; (d) H. Bildirir, J. P. Paraknowitsch and A. Thomas, Chem. – Eur. J., 2014, 20, 9543 CrossRef CAS PubMed; (e) Y. Liao, J. Weber and C. F. J. Faul, Chem. Commun., 2014, 50, 8002 RSC.
- F. Xu, X. Chen, Z. Tang, D. Wu, R. Fu and D. Jiang, Chem. Commun., 2014, 50, 4788 RSC.
- L. Chen, Y. Honsho, S. Seki and D. Jiang, J. Am. Chem. Soc., 2010, 132, 6742 CrossRef CAS PubMed.
- (a) Y. Zhang, S. A. Y. Zou, X. Luo, Z. Li, H. Xia, X. Liu and Y. Mu, J. Mater. Chem. A, 2014, 2, 13422 RSC; (b) C. Gu, N. Huang, J. Gao, F. Xu, Y. Xu and D. Jiang, Angew. Chem., Int. Ed., 2014, 53, 4850 CrossRef CAS PubMed.
- A. Laybourn, R. Dawson, R. Clowes, T. Hasell, A. I. Cooper, Y. Z. Khimyak and D. J. Adams, Polym. Chem., 2014, 5, 6325 RSC.
- (a) J. X. Jiang, F. Su, A. Trewin, C. D. Wood, H. Niu, J. T. A. Jones, Y. Z. Khimyak and A. I. Cooper, J. Am. Chem. Soc., 2008, 130, 7710 CrossRef CAS PubMed; (b) L. J. Abbott and C. M. Colina, Macromolecules, 2011, 44, 4511 CrossRef CAS.
- A. Patra and U. Scherf, Chem. – Eur. J., 2012, 18, 10074 CrossRef CAS PubMed.
- (a) N. B. McKeown and P. M. Budd, Chem. Soc. Rev., 2006, 35, 675 RSC; (b) N. B. McKeown and P. M. Budd, Macromolecules, 2010, 43, 5163 CrossRef CAS.
- (a) G. Cheng, T. Hasell, A. Trewin, D. J. Adams and A. I. Cooper, Angew. Chem., Int. Ed., 2012, 51, 12727 CrossRef CAS PubMed; (b) G. Cheng, B. Bonillo, R. S. Sprick, D. J. Adams, T. Hasell and A. I. Cooper, Adv. Funct. Mater., 2014, 24, 5219 CrossRef CAS PubMed.
- (a) A. Patra, J. M. Koenen and U. Scherf, Chem. Commun., 2011, 47, 9612 RSC; (b) M. G. Schwab, D. Crespy, X. Feng, K. Landfester and K. Müllen, Macromol. Rapid Commun., 2011, 32, 1798 CrossRef CAS PubMed; (c) K. Wu, J. Guo and C. Wang, Chem. Commun., 2014, 50, 695 RSC; (d) X. Wu, H. Li, Y. Xu, B. Xu, H. Tong and L. Wang, Nanoscale, 2014, 6, 2375 RSC.
- (a) C. Y. K. Chan, Z. Zhao, J. W. Y. Lam, J. Liu, S. Chen, P. Lu, F. Mahtab, X. Chen, H. H. Y. Sung, H. S. Kwok, Y. Ma, I. D. Williams, K. S. Wong and B. Z. Tang, Adv. Funct. Mater., 2012, 22, 378 CrossRef CAS PubMed; (b) W. Dong, T. Fei, A. Palma-Cando and U. Scherf, Polym. Chem., 2014, 5, 4048 RSC.
- J. R. Lakowicz, Principles of Fluorescence Spectroscopy, Springer, New York, 2006 Search PubMed.
- Y. Zhang, G. Chen, Y. Lin, L. Zhao, W. Z. Yuan, P. Lu, C. K. W. Jim, Y. Zhang and B. Z. Tang, Polym. Chem., 2015, 6, 97 RSC.
- Z. Xiang and D. Cao, Macromol. Rapid Commun., 2012, 33, 1184 CrossRef CAS PubMed.
- L. J. Abbott, A. G. McDermott, A. D. Regno, R. G. D. Taylor, C. G. Bezzu, K. J. Msayib, N. B. McKeown, F. R. Siperstein, J. Runt and C. M. Colina, J. Phys. Chem. B, 2013, 117, 355 CrossRef CAS PubMed.
- (a) K. Rurak and M. Spieles, Anal. Chem., 2011, 83, 1232 CrossRef PubMed; (b) C. Wurth, M. Grabolle, J. Pauli, M. Spieles and U. R. Genger, Nat. Protoc., 2013, 8, 1535 CrossRef PubMed.
- M. P. Castellani, J. M. Wright, S. J. Geib, A. L. Rheingold and W. C. Trogler, Organometallics, 1986, 5, 1116 CrossRef CAS.
Footnote |
| † Electronic supplementary information (ESI) available: Details of synthesis and characterization, fabrication of nanoparticles, microscopy, surface area analysis, computational and spectroscopic investigations and sensing studies. See DOI: 10.1039/c5py00235d |
| This journal is © The Royal Society of Chemistry 2015 |