 Open Access Article
Creative Commons Attribution 3.0 Unported Licence
High sensitivity flexible Lamb-wave humidity sensors with a graphene oxide sensing layer†
Weipeng
Xuan
a,
Xingli
He
a,
Jinkai
Chen
a,
Wenbo
Wang
a,
Xiaozhi
Wang
*a,
Yang
Xu
a,
Zhen
Xu
b,
Y. Q.
Fu
c and
J. K.
Luo
*ad
aDept. of Info. Sci. & Electr. Eng., Zhejiang University, 38 Zheda Road, Hangzhou 310027, P. R. China. E-mail: xw224@zju.edu.cn
bMOE Key Lab. of Macromolecul. Synth. & Funct., Dept. of Polym. Sci. & Eng., Zhejiang University, 38 Zheda Road, Hangzhou 310027, China
cDept. of Phys. & Electr. Eng., Facult. of Eng. & Environ., University of Northumbria, Newcastle upon Tyne, NE1 8ST, UK
dInstitute of Renewable Energy & Environ. Technol., University of Bolton, Bolton, BL3 5AB, UK. E-mail: jl2@bolton.ac.uk
First published on 4th March 2015
Abstract
This paper reports high performance flexible Lamb wave humidity sensors with a graphene oxide sensing layer. The devices were fabricated on piezoelectric ZnO thin films deposited on flexible polyimide substrates. Two resonant peaks, namely the zero order antisymmetric (A0) and symmetric (S0) mode Lamb waves, were observed and fitted well with the theoretical analysis and modelling. With graphene oxide microflakes as the sensing layer, the sensing performance of both wave modes was investigated. The humidity sensitivity of the A0 mode is 145.83 ppm per %RH (at humidity 85%RH), higher than that of S0 mode of 89.35 ppm per %RH. For the first time, we have demonstrated that the flexible humidity sensors work as usual without noticeable deterioration in performance even under severe bending conditions up to 1500 με. Also the sensors showed an excellent stability upon repeated bending for thousand times. All the results demonstrated that the Lamb wave flexible humidity sensors have a great potential for application in flexible electronics.
1. Introduction
Humidity monitoring and controlling are of great importance in various fields, such as meteorology, historical relic protection, medical/healthcare product development, industrial manufacturing, agriculture and wearable or mobile electronics. Many types of advanced humidity sensors1 have been developed, including resistance,2 capacitance,3 and surface acoustic wave (SAW)4 based sensors using new materials and the state-of-the-art micro-fabrication technologies. Recently, flexible electronics has received significant attention5,6 owing to its great potential for applications and advantages compared to those on rigid substrates. Many flexible technologies and applications have been proposed and investigated, such as flexible transistors,7–9 pressure sensors,10 integrated circuits,11 photodetectors6etc. A SAW device is one of the building blocks for electronics and communication, and has been used as frequency filters and waveguides,12 resonators13 and various types of sensors.14 We have fabricated high performance flexible SAW devices based on ZnO piezoelectric thin films deposited on polyimide substrates,15,16 showing excellent potential for various sensing applications. Among them, the ZnO SAW humidity sensors without any additional sensing layer have shown comparable performance to those on rigid substrates.4Nanomaterials have large surface to bulk ratios, and have been often used as sensitive layers to improve the sensitivity of sensors.17,18 Graphene oxide (GO) is a layered material which is formed by hydrophilic oxygenated graphene sheets with oxygen functional groups on their basal planes and edges.19 GO-films have been utilized for humidity sensing,2,3 as their hydrogen bond (H-bond) of the oxygen functional groups and water molecules within the interlayer cavities have a high capability to absorb water molecules, which in-turn affect the electrical, structural and mechanical properties of the films.3 An impedance type humidity sensor using the GO as a sensing layer has recently been developed,2 showing an ultra-fast response and a high sensitivity. We have recently developed a transparent SAW device-based humidity sensor using GO as the sensing layer with the ZnO film deposited on a glass substrate,20 showing significant improvement in sensitivity and response speed. In this paper, we report the development of flexible ZnO SAW humidity sensors using the GO microflakes as the sensing layer, and demonstrate that the sensitivity of a flexible SAW sensor is much better than that without the GO sensing layer.4 Although the insertion loss of the flexible sensor is a bit larger and the sensitivity is slightly smaller compared to those on a rigid substrate, flexible sensors show an excellent sensing performance even at severe bending states up to 1500 με, and the sensors still remain under operable conditions after being bent for 8000 times, demonstrating their great flexibility and reliability for commercial applications.
2. Experimental
2.1. Device fabrication
A polyimide (PI) tape (60 μm) was used to fabricate the flexible SAW devices, which was glued onto a glass substrate for easy fabrication. A ZnO piezoelectric film with a c-axis (0002) orientation was deposited on the PI film by direct current (DC) reactive magnetron sputtering. The properties of the piezoelectric ZnO films were characterized and results were reported in our previous paper.15 The SAW devices with the structure shown in Fig. 1, have two 50 pairs of aluminium (Al) interdigitated transducers (IDTs) that were fabricated using a standard UV-photolithography and lift-off process. The wavelength, λ, of the SAW devices was set to be 12, 16, 20, 24, 28, and 30 μm, respectively. Since the acoustic wave energy deteriorates rapidly within the polymer substrate, the length of the wave propagation path was kept shorter, and was fixed at 10λ for all the devices tested.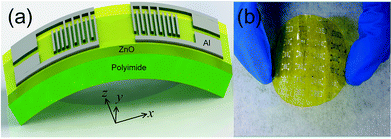 | ||
| Fig. 1 Schematic view of the flexible SAW device (a) and a photograph of the flexible devices fabricated (b). | ||
2.2 Deposition of graphene oxide sensing layers
The GO microflakes were prepared from natural graphite flakes with an average lateral size of 50 μm, as reported previously.21 The initial GO dispersion had a concentration of 2 mg ml−1, then it was further diluted by deionized (DI) water at ratios of 1![[thin space (1/6-em)]](https://www.rsc.org/images/entities/char_2009.gif) :
:![[thin space (1/6-em)]](https://www.rsc.org/images/entities/char_2009.gif) 50, 1
50, 1![[thin space (1/6-em)]](https://www.rsc.org/images/entities/char_2009.gif) :
:![[thin space (1/6-em)]](https://www.rsc.org/images/entities/char_2009.gif) 20 and 1
20 and 1![[thin space (1/6-em)]](https://www.rsc.org/images/entities/char_2009.gif) :
:![[thin space (1/6-em)]](https://www.rsc.org/images/entities/char_2009.gif) 10 to form GO dispersions with different concentrations. These GO dispersions were drop-cast on the surface of the devices with a volume of 4 μl, covering the wave propagation path and the IDT areas, as it can enhance the sensitivity significantly as reported in our previous work.20 They were left to evaporate slowly at room temperature to obtain GO films with different thicknesses. Deposition of a thin GO film on the device surface would induce little effect on the transmission properties of the SAW devices compared to the devices without the GO film as long as the thickness was less than 500 nm as shown in our previous paper,20 which was also confirmed by our experiments in this work.
10 to form GO dispersions with different concentrations. These GO dispersions were drop-cast on the surface of the devices with a volume of 4 μl, covering the wave propagation path and the IDT areas, as it can enhance the sensitivity significantly as reported in our previous work.20 They were left to evaporate slowly at room temperature to obtain GO films with different thicknesses. Deposition of a thin GO film on the device surface would induce little effect on the transmission properties of the SAW devices compared to the devices without the GO film as long as the thickness was less than 500 nm as shown in our previous paper,20 which was also confirmed by our experiments in this work.
2.3 Characterization and measurements
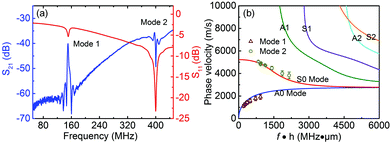
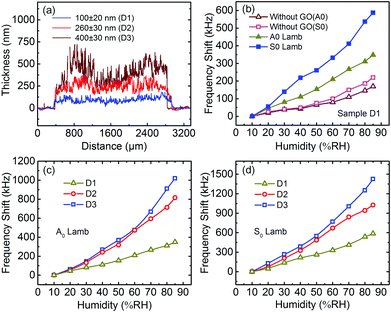
Frequency responses of the SAW sensors were investigated using an Agilent E5071C network analyzer, and data were acquired by using a LabVIEW based software through a GPIB bus in real time. The transmission spectra, S21, of the SAW devices typically have two resonant peaks, modes 1 and 2 as shown in Fig. 2(a).The thickness of three types of GO microflake films coated with different GO dispersions was measured using a profilometer (Alpha Step® D-100 Stylus Profiler, KLA-Tencor), and the results are shown in Fig. 4(a). The GO films were characterized using Raman (inVia-Reflex, Renishaw, 532 nm laser) and Fourier transform infrared spectroscopy (FTIR, Nicolet 6700, Thermo Fisher Scientific Inc.).
For humidity sensing, the sensor was fixed in a sealed metal box, consisting of an inlet/outlet for gas to flow in/out. A hygrothermograph (SHT71, Sensirion) was attached at the outlet as a reference for temperature and humidity.22 The details of the characteristics and parameters of the sensors used for sensing are summarized in Table 1.
| Sample no. | Freq. (MHz) | GO thickness (nm) | Sensitivity (ppm per %RH)(at 85%RH) | ||
|---|---|---|---|---|---|
| A0 | S0 | A0 | S0 | ||
| D1 | 150 | 395 | 100 ± 20 | 49.34 | 25.72 |
| D2 | 150 | 395 | 260 ± 30 | 137.56 | 42.44 |
| D3 | 150 | 395 | 400 ± 30 | 145.83 | 89.35 |
3. Results and discussion
3.1. Theoretical analysis of wave modes
Polyimide is often used as an acoustic absorption layer23 as the acoustic wave would damp quickly with little reflection. We found that the acoustic wave energy is mostly confined in the ZnO piezoelectric layer, which indicates that the acoustic wave is a kind of plate wave or Lamb wave. At higher frequencies, the wave velocity of the Lamb wave converges towards the Rayleigh wave velocity, and with the increase in layer thickness, it gradually changes into Rayleigh wave modes as will be shown later. Therefore they are often mixed without a clearly defined boundary.15,16 Generally, the Lamb wave only has displacements in the x- and z-directions as indicated in Fig. 1(a), and has the antisymmetric and symmetric modes based on their displacement patterns.24 Two resonant peaks with large signal amplitudes were observed for the fabricated devices as shown in Fig. 2(a), ascribed as mode 1 and mode 2, respectively. The quality factor, Q, for the modes 1 and 2 is 50 and 72, respectively, lower than those of the devices on a rigid substrate (168),20 but still good enough for sensing experiments.Theoretical analysis was then carried out to identify the wave modes. The frequency dispersion equations of the Rayleigh–Lamb wave can be written as25
 | (1) |
 | (2) |
 | (3) |
Fig. 2(b) shows the dispersion curves of the phase velocities of the first three wave modes calculated from the above equations. Comparing the experimental data with the zero modes of theoretical results, A0 mode and S0 mode, both the wave modes from the experiment fit very well with the theoretical values. Therefore, the two resonant peaks of the flexible SAW devices are the lowest (zero) antisymmetric (A0) and symmetric (S0) vibrations of the Lamb waves. It can be seen that the velocities of A0 and S0 modes gradually become the same as the product of f·h becomes larger, i.e., changing into the Rayleigh wave mode.
3.2. Graphene oxide sheets characterization
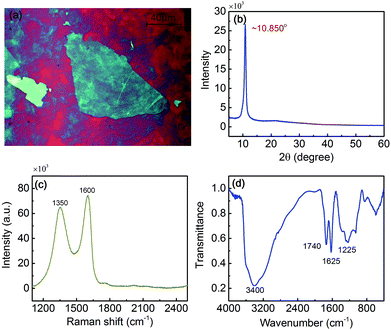
The size of the GO microflakes has a wide distribution ranging from several micrometres to tens of micrometres as shown in Fig. 3(a). The XRD measurement results show that the layer-to-layer distance (d-spacing) is about 8.15 Å (2θ = 10.85°), larger than that in graphite (3.35 Å, 2θ = 26.3°). This interlayer distance is approximately one-molecule-layer thickness of water molecules, possibly due to the hydrogen-bonding between the GO flakes.26,27The Raman spectrum (Fig. 3(c)) shows two prominent peaks at 1350 and 1600 cm−1, corresponding to the well-documented D-band and G-band, respectively,28 confirming the lattice distortion of the GO.29 FTIR was performed on the GO microflakes for further characterization. The most important characteristic features are the broad and high intensity bands at 3400 cm−1 (O–H stretching vibrations) and the bands at 1740 cm−1 (C![[double bond, length as m-dash]](https://www.rsc.org/images/entities/char_e001.gif) O stretching vibrations from carbonyl and carboxylic groups), 1625 cm−1 (skeletal vibrations from unoxidized graphitic domains), and 1226 cm−1 (C–OH stretching vibrations).30 In brief, the hydrogen bond networks that involve functional groups on the GO plates and water molecules within the interlayers enhance the hydrophilicity of the GO layer.31
O stretching vibrations from carbonyl and carboxylic groups), 1625 cm−1 (skeletal vibrations from unoxidized graphitic domains), and 1226 cm−1 (C–OH stretching vibrations).30 In brief, the hydrogen bond networks that involve functional groups on the GO plates and water molecules within the interlayers enhance the hydrophilicity of the GO layer.31
3.3. Humidity sensing
The humidity sensing performance using both the A0 and S0 modes with and without a GO sensing layer was investigated with the results shown in Fig. 4(b) (all of the sensing was conducted at room temperature (∼25 °C) unless specially mentioned). Typically, the S0 mode has a larger frequency shift than that of the A0 mode. The humidity sensitivity is defined as follows: | (4) |
The sensitivity of both the wave modes is listed in Table 1, much higher than those with a bare ZnO surface4 and is comparable to those of ZnO/glass SAW devices with the same GO sensing layer.20 This is because the hydrophilic GO film enhances the water absorption capability through the oxygen-rich groups, strengthening the mass loading effect and causing a larger frequency shift. The GO flakes also significantly increase the effective sensing area, thus drastically improve the sensitivity.20 Although the S0 mode has a larger frequency shift and a higher resolution than that of the A0 mode, it has a lower sensitivity as it has a higher working frequency. Nevertheless, using both wave modes has significantly improved the accuracy and sensitivity for humidity sensing, demonstrating the potential usage of this dual-mode flexible humidity sensor.
Based on our previous analysis,4,20 we believe that the frequency shift is mainly induced by the mass loading effect. According to Sauerbrey's equation,32 the mass loading on the surface of a resonator has a linear relationship with the frequency shift, Δf as follows:
| Δf = −Cf02Δm/A | (5) |
The thickness of the GO sensing layer was found to have a significant effect on the sensitivity of the sensors. Fig. 4(c) and (d) are a comparison of the sensing performances of sensors D1, D2 and D3 with different GO thicknesses (Fig. 4(a)). It is clear that the sensor with a thicker GO layer has a larger frequency shift for both the A0 and S0 modes. For a thicker GO film, there would be a larger effective sensing area, which leads to a stronger water molecules adsorption. This in-turn results in a larger mass loading and frequency shift. Samples D2 and D3 show similar trends of frequency variation with a humidity change, but the increment of frequency shift for D3 at a fixed humidity level is not as large as that of D2. This is because the effective sensing area does not increase linearly with the increase of the GO layer thickness due to the accumulation effect. The frequency shift becomes larger with the increase in humidity, meaning that the frequency shift is not a linear function of humidity. At a higher humidity, the water molecules start to penetrate deeply into the GO flakes layer, making more surface area available for humidity sensing. The hydrogen-bond of the absorbed water molecules will further contribute to the absorption process, thus enhancing the sensitivity at a higher humidity level.
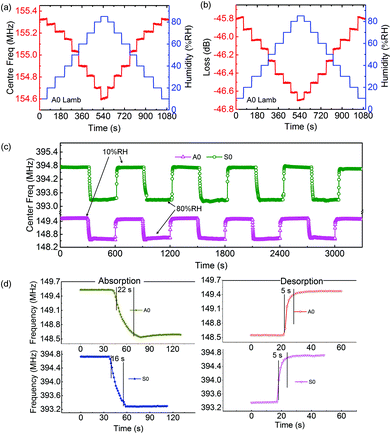
Detailed responses of frequency shift and insertion loss upon a stepwise increase and decrease of RH were investigated for the A0 mode of sample D3, and the results are shown in Fig. 5(a) and (b). Both of them show very small hysteresis when the humidity increases and then returns to its initial value. When the humidity is increased, more water molecules are absorbed by the GO film, hence the frequency shift increases as explained above. When the humidity is changed from 10%RH to 85%RH, however, the insertion loss only changes by less than 1 dB, clearly indicating that the acoustic energy absorbed by the GO film and the water content is rather limited, ensuring that the sensor works well in this humidity range.
We also investigated the repeatability of both modes with a fast humidity change between 10%RH and 80%RH. As exhibited in Fig. 5(c), the flexible SAW humidity sensors show a good repeatability within this humidity range. Meanwhile, the response and recovery behaviours were also tested between the 10%RH and 80%RH as shown in Fig. 5(d). The average response time (absorption process) for the A0 and S0 modes is about 20 s (16–22 s), and the recovery time (desorption process) is about 5 s, slightly longer compared with those of the SAW sensor made on rigid substrates,20 but much better than most of the humidity sensors reported in the literature.3
Since the Lamb waves excited in a piezoelectric layer are combined waves of particle displacement and piezoelectric potential, both the strain field and potential can be influenced by the environment, resulting in the changes in wave propagation. The former is called the mechanical effect, induced by the elastic viscosity change of the surface layer and mass loading on the surface. The latter is called the acoustoelectric effect, of which the conductivity or permittivity will influence the sensing performance. The conductivity effect can be excluded as explained in our previous report.20 For the GO film, individual GO flakes are interlinked via a network of hydrogen bonds mediated by oxygen-containing functional groups and water molecules, and the hydrogen bonds play an important role in determining the properties of the GO film.26,27,31,33 The variation of the interlayer distance depends on the water content. As the GO is hydrophilic, the water molecular residue may still be present in interlayer voids even after a prolonged drying process.26 Thus, initially two types of hydrogen bonds exist, i.e., H-bond between the functional groups attached to a graphene sheet and a H-bond involving water molecules. At a lower humidity level, the H-bond network is dominated by the functional group, which absorbs molecules initially, whereas at a higher humidity, water molecules absorbed by the GO film increase, and the H-bond network is dominated by water molecules.31 All these H-bonds would absorb water molecules, thus increasing the mass on the surface of the device. This can explain why the frequency shift will change at various relative humidity values.
On the other hand, the typical interlayer distance of GO films reported in the literature is 6 to 11 Å because of the H-bond, depending on humidity.27,33 This means that the volume of the GO layer will expand at a higher humidity, thus influencing the mechanical properties of the GO film. The experimentally measured elastic moduli for the GO layers are 6–42 GPa,26,34 much smaller than the Young's modulus of the ZnO layer (110–140 GPa).35 According to ref. 36 we can treat the GO film as an acoustic thin layer, and the viscoelastic effect contributes little to the sensing response. Therefore, mass loading is the main effect that induces the velocity change and energy attenuation.
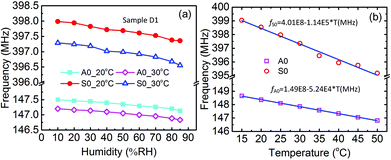
Temperature is another important factor which could affect the sensing results significantly. Fig. 6(a) shows the influence of temperature on the frequency shift as a function of humidity for both the A0 and S0 modes of sample D1. Results show that the general trend for the shifts of frequencies with humidity remains unchanged, but the values of frequency shift are varied significantly when the temperature is changed. Fig. 6(b) shows the frequency as a function of temperature for both the modes, and the frequency decreases linearly with the increase in temperature as expected. The temperature coefficient of frequency (TCF = Δf/ΔT) for both modes has an excellent linearity. Since the two modes have different TCFs, they can be utilized for temperature compensation or calibration processes37 to eliminate the temperature effect on the humidity sensing result, a very important issue for commercial applications.
Although the ZnO film is also sensitive to various gases,38 the frequency shift induced by the absorption of gases in the atmosphere is quite small, in the order of less than one kHz when there is no catalyst or sensing layer being used. This is much smaller than that induced by the humidity change of several hundreds of kHz; therefore the interference from gases is not an issue for this humidity sensor.
3.4. Humidity sensing under bending and flexibility of the sensor
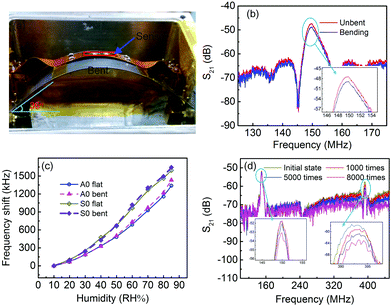
We have also investigated the sensing performance of the humidity sensors at different bending states. The thin PI film with SAW devices was bonded onto a 250 μm thick PET substrate for easy handling, and the devices with the handling PET substrate were further glued on a flexible steel bar, connected to SMA connectors through flexible PCB as shown in Fig. 7(a). The transmission properties at the flat and bent states were then recorded. The devices were tested under various bending angles. Results showed that the signal amplitude of the resonant peak remains almost unchanged when the bending angle is smaller than 30°, and then decreases slightly with increasing the bending angle further with one of the results shown in Fig. 7(b). At a bending angle of 36°, the strain is about 1500 με.16,39 A frequency shift of 150 kHz was observed which is attributed to the deformation of the device and change of the acoustic velocity.16 When the device is further bent, the ZnO crystal quality may deteriorate slightly (cracks and defects are generated in the ZnO film), leading to the increased attenuation of the acoustic energy.16Fig. 7(c) is the performance comparison of humidity sensing for the A0 and S0 modes of sample D3, unbent and bent at an angle of 36°. The frequency shifts for both the wave modes of the sensor unbent and bent increase with the increase in humidity, showing similar trends. There is no apparent difference in the frequency shift at a humidity level smaller than 50%RH for both the wave modes, and the difference becomes slightly larger with the further increase of the humidity level above 50%RH, but is still smaller than 5% at 85%RH. This clearly indicates that the flexible humidity sensors can still work well under severe bending conditions, and demonstrate their potential for flexible electronic applications. The slightly increased frequency shift for the sensor under bending is believed to be caused by the increased surface area of the GO sensing layer under bending.
The stability of the flexible sensor upon repeated bending was also tested by a homemade robotic arm between a flat and a fixed bending angle of 36° (1500 με). The detailed bending experiment can be seen from the movie in ESI.†Fig. 7(d) is the comparison of the transmission spectra before and after bent for 1000, 5000 and 8000 cycles, respectively. The resonant frequency does not change apparently, whereas the signal amplitude decreases slightly with the increase of bending cycles. However the sensor still possesses good transmission properties even after it was bent for 8000 cycles, demonstrating its excellent potential for flexible electronic applications.
4. Conclusion
We have demonstrated a dual-mode flexible Lamb wave humidity sensor, using GO microflakes as the humidity sensing material. For the two working modes of the Lamb waves, the antisymmetric mode shows a higher sensitivity than the symmetric mode, while the frequency shift of the S0 mode induced by the humidity change is larger than that of A0 mode. The humidity sensitivity of both the wave modes increases with the increase in humidity levels, and can be improved significantly by using a thicker GO film. For the first time, we have demonstrated that the flexible humidity sensor can work very well under severe bent conditions, and both the wave modes show only a slight difference from those of the device unbent, demonstrating its great potential for application as a flexible humidity sensor.Acknowledgements
This work was supported by NSFC (no. 61274037, 61274123, and 61474099) and the Zhejiang Provincial NSF (no. Z11101168 and LR12F04001). The authors also would like to acknowledge the financial support by the Innovation Platform of Micro/Nano devices and Integration System, Zhejiang University, and Royal Academy of Engineering UK-Research Exchange with China and India.Notes and references
- B. M. Kulwicki, J. Am. Ceram. Soc., 1991, 74, 697–708 CrossRef CAS PubMed.
- S. Borini, R. White, D. Wei, M. Astley, S. Haque, E. Spigone, N. Harris, J. Kivioja and T. Ryhanen, ACS Nano, 2013, 7, 11166–11173 CrossRef CAS PubMed.
- H. Bi, K. Yin, X. Xie, J. Ji, S. Wan, L. Sun, M. Terrones and M. S. Dresselhaus, Sci. Rep., 2013, 3, 2714 Search PubMed.
- X. L. He, D. J. Li, J. Zhou, W. B. Wang, W. P. Xuan, S. R. Dong, H. Jin and J. K. Luo, J. Mater. Chem. C, 2013, 1, 6210 RSC.
- S. Park, G. Wang, B. Cho, Y. Kim, S. Song, Y. Ji, M. H. Yoon and T. Lee, Nat. Nanotechnol., 2012, 7, 438–442 CrossRef CAS PubMed.
- S. R. Tamalampudi, Y. Y. Lu, U. R. Kumar, R. Sankar, C. D. Liao, B. K. Moorthy, C. H. Cheng, F. C. Chou and Y. T. Chen, Nano Lett., 2014, 14, 2800–2806 CrossRef CAS PubMed.
- T. Sekitani, U. Zschieschang, H. Klauk and T. Someya, Nat. Mater., 2010, 9, 1015–1022 CrossRef CAS PubMed.
- T. Sekitani, T. Yokota, U. Zschieschang, H. Klauk, S. Bauer, K. Takeuchi, M. Takamiya, T. Sakurai and T. Someya, Science, 2009, 326, 1516–1519 CrossRef CAS PubMed.
- D. K. Kim, Y. Lai, B. T. Diroll, C. B. Murray and C. R. Kagan, Nat. Commun., 2012, 3, 1216 CrossRef PubMed.
- S. C. B. Mannsfeld, B. C. K. Tee, R. M. Stoltenberg, C. V. H. H. Chen, S. Barman, B. V. O. Muir, A. N. Sokolov, C. Reese and Z. N. Bao, Nat. Mater., 2010, 9, 859–864 CrossRef CAS PubMed.
- D. M. Sun, M. Y. Timmermans, Y. Tian, A. G. Nasibulin, E. I. Kauppinen, S. Kishimoto, T. Mizutani and Y. Ohno, Nat. Nanotechnol., 2011, 6, 156–161 CrossRef CAS PubMed.
- H. Nakahata, A. Hachigo, S. Shikata and N. Fujimori, Ultrasonics Symposium, 1992. Proceedings, Tucson, AZ, 1992.
- Y. Zhu, Y. Zheng, C. Sun, Y. Gao, A. Y. Gu and H. Campanella, Sens. Actuators, A, 2014, 220, 188–193 CrossRef CAS PubMed.
- I. Voiculescu and A. N. Nordin, Biosens. Bioelectron., 2012, 33, 1–9 CrossRef CAS PubMed.
- H. Jin, J. Zhou, X. He, W. Wang, H. Guo, S. Dong, D. Wang, Y. Xu, J. Geng, J. K. Luo and W. I. Milne, Sci. Rep., 2013, 3, 2140 Search PubMed.
- X. L. He, H. W. Guo, J. K. Chen, W. B. Wang, W. P. Xuan, Y. Xu and J. K. Luo, Appl. Phys. Lett., 2014, 104, 213504 CrossRef PubMed.
- Q. Kuang, C. Lao, Z. L. Wang, Z. Xie and L. Zheng, J. Am. Chem. Soc., 2007, 129, 6070–6071 CrossRef CAS PubMed.
- X. Wang, B. Ding, J. Yu, M. Wang and F. Pan, Nanotechnology, 2010, 21, 055502 CrossRef PubMed.
- D. R. Dreyer, S. Park, C. W. Bielawski and R. S. Ruoff, Chem. Soc. Rev., 2010, 39, 228–240 RSC.
- W. Xuan, M. He, N. Meng, X. He, W. Wang, J. Chen, T. Shi, T. Hasan, Z. Xu, Y. Xu and J. K. Luo, Sci. Rep., 2014, 4, 7206 CrossRef PubMed.
- Z. Xu, H. Sun, X. Zhao and C. Gao, Adv. Mater., 2013, 25, 188–193 CrossRef CAS PubMed.
- Sensirion, Datasheet of SHT71, http://www.sensirion.com/fileadmin/user_upload/customers/sensirion/Dokumente/Humidity/Sensirion_Humidity_SHT7x_Datasheet_V5.pdf, 4, Jan, 2015.
- C. A. Johnsen, T. L. Bagwell and J. L. Henderson, Ultrasonics Symposium, 1988. Proceedings, Chicago, IL, 1988.
- Z. Chen, L. Fan, S.-y. Zhang and H. Zhang, J. Appl. Phys., 2014, 115, 204513 CrossRef PubMed.
- J. L. Rose, Ultrasonic Guided Waves in Solid Methods, Cambridge University Press, Cambridge, 2004 Search PubMed.
- D. A. Dikin, S. Stankovich, E. J. Zimney, R. D. Piner, G. H. Dommett, G. Evmenenko, S. T. Nguyen and R. S. Ruoff, Nature, 2007, 448, 457–460 CrossRef CAS PubMed.
- A. Lerf, A. Buchsteiner, J. Pieper, S. Schöttl, I. Dekany, T. Szabo and H. P. Boehm, J. Phys. Chem. Solids, 2006, 67, 1106–1110 CrossRef CAS PubMed.
- M. A. Pimenta, G. Dresselhaus, M. S. Dresselhaus, L. G. Cancado, A. Jorio and R. Saito, Phys. Chem. Chem. Phys., 2007, 9, 1276–1291 RSC.
- Y. Zhu, S. Murali, W. Cai, X. Li, J. W. Suk, J. R. Potts and R. S. Ruoff, Adv. Mater., 2010, 22, 3906–3924 CrossRef CAS PubMed.
- A. B. Bourlinos, D. Gournis, D. Petridis, T. Szabo, A. Szeri and I. Dekany, Langmuir, 2003, 19, 6050–6055 CrossRef CAS.
- N. V. Medhekar, A. Ramasubramaniam, R. S. Ruoff and V. B. Shenoy, ACS Nano, 2010, 4, 2300–2306 CrossRef CAS PubMed.
- K. Bodenhöfer, A. Hierlemann, G. Noetzel, U. Weimar and W. Göpel, Anal. Chem., 1996, 68, 2210–2218 CrossRef PubMed.
- A. Buchsteiner, A. Lerf and J. Pieper, J. Phys. Chem. B, 2006, 110, 22328–22338 CrossRef CAS PubMed.
- S. Park, K. S. Lee, G. Bozoklu, W. Cai, S. T. Nguyen and R. S. Ruoff, ACS Nano, 2008, 2, 572–578 CrossRef CAS PubMed.
- Y. Q. Fu, J. K. Luo, X. Y. Du, A. J. Flewitt, Y. Li, G. H. Markx, A. J. Walton and W. I. Milne, Sens. Actuators, B, 2010, 143, 606–619 CrossRef CAS PubMed.
- S. J. Martin, G. C. Frye and S. D. Senturia, Anal. Chem., 1994, 66, 2201–2219 CrossRef CAS.
- Q. Liu and A. J. Flewitt, Appl. Phys. Lett., 2014, 105, 213511 CrossRef PubMed.
- S. Y. Wang, J. Y. Ma, Z. J. Li, H. Q. Su, N. R. Alkurd, W. L. Zhou, L. Wang, B. Du, Y. L. Tang, D. Y. Ao, S. C. Zhang, Q. K. Yu and X. T. Zu, J. Hazard. Mater., 2015, 285, 368–374 CrossRef CAS PubMed.
- J. Chen, X. He, W. Wang, W. Xuan, J. Zhou, X. Wang, S. R. Dong, S. Garner, P. Cimo and J. K. Luo, J. Mater. Chem. C, 2014, 2, 9109–9114 RSC.
Footnote |
| † Electronic supplementary information (ESI) available. See DOI: 10.1039/c5nr00040h |
| This journal is © The Royal Society of Chemistry 2015 |

