Near-infrared absorbing polymer nano-particle as a sensitive contrast agent for photo-acoustic imaging†
Hiroyuki
Aoki
*ab,
Mayumi
Nojiri
a,
Rieko
Mukai
b and
Shinzaburo
Ito
a
aDepartment of Polymer Chemistry, Kyoto University, Nishikyo, Kyoto 610-8510, Japan
bAdvanced Biomedical Engineering Research Unit, Kyoto University, Nishikyo, Kyoto 610-8510, Japan. E-mail: aoki@photo.polym.kyoto-u.ac.jp; Fax: +81-75-383-2617; Tel: +81-75-383-2613
First published on 10th November 2014
Abstract
Polymer nano-particles (PNPs) with a near-infrared (NIR) light absorption were prepared by the nano-emulsion method to develop contrast agents for photo-acoustic (PA) imaging. The PNP containing silicon naphthalocyanine showed a high absorption coefficient up to 1010 M−1 cm−1. This is comparable to plasmonic gold nano-particles, which have been studied as PA contrast agents. For the PNP larger than 100 nm, the enhancement of the PA signal was observed compared to the gold nano-particle with a similar absorption coefficient and size. In the case of the PNP, the heat by the light absorption is confined in the particle due to the low thermal diffusivity of polymer materials. We showed that the strong thermal confinement effect of PNP results in the enhancement of the efficiency of the PA signal generation and that the PA intensity can be enhanced by the increase of the Grüneisen parameter of the matrix polymer of PNP. The PA signal from the PNP of poly(methyl methacrylate) was 9-fold larger than that of gold nano-particles with the same absorption coefficient. We demonstrated that in the in vivo PA imaging the detection limit of PNP was of the order of 10−13 M. The NIR absorbing PNP will be a promising candidate of a sensitive contrast agent for PA imaging.
Introduction
Photo-acoustic (PA) imaging has attracted much attention as a modality with both advantages of optical and acoustic imaging techniques.1–3 The PA imaging technique provides a three-dimensional information on the spatial distribution of light absorbing objects deep inside the living body. In vivo applications of the PA imaging with contrast agents have been extensively studied for the visualization of tumors and sentinel lymph nodes.4–8 Exogenous contrast agents are required to generate the large PA signal to overcome the high background signal from strong light absorbers such as hemoglobin and melanin. Organic dyes, carbon nanotubes, and nano-structured metal particles have been studied as the contrast agents for the PA imaging.4–16 Among such contrast agents, gold nano-particles are promising materials to generate the large PA signal. In order to increase the PA signal, the absorption coefficient at a near-infrared (NIR) range of 700–900 nm should be maximized because the PA intensity is proportional to the absorbed energy of a laser pulse. The gold nano-particles strongly absorb the light by the localized plasmon resonance and the absorption wavelength can be controlled by the morphology of the particle. Gold nano-rods and nano-cages with sizes from tens to hundreds of nm have been studied as sensitive contrast agents in the NIR region.7–13 Since the sound pressure of the PA wave is affected by not only the increase of the absorption coefficient but also by the heat transfer from the nano-particle to the surrounding dispersion medium, the thermal resistance at the particle surface affects the intensity of the PA signal.11 In the application of nano-particles in in vivo imaging, the blood circulation and target specificity is dependent on the particle size and the surface properties.17,18 Because the absorption coefficient and the spectrum of gold nano-particles are determined by the size and the structure of the particle, the modification of the structure and the surface to optimize the localization and disposition under in vivo conditions should affect the optical properties of gold nano-particles. Therefore, the optical properties and the particle structure should be independently controlled to design the contrast agent for the PA imaging. In this study, we introduce nano-particles of polymer materials as the highly sensitive contrast agent for the PA imaging. The polymer nano-particles (PNPs) have been extensively studied as molecular probes to visualize tumor sites.19–21 The particle size and surface properties governing the blood circulation and target specificity can be controlled independently of the optical properties. We revealed the key factors to enhance the PA signal from nano-particles and showed that the PNP containing an organic dye showed a 30-fold greater PA signal in the NIR region than gold nano-particles. We also performed the in vivo PA imaging of a mouse to demonstrate the high sensitivity of the PNP contrast agent.Experimental section
Nano-particles of a polymer containing a dye were prepared by a nano-emulsion method.22,23 Polymers used here are polystyrene (PS), poly(methyl methacrylate) (PMMA), poly(ethyl methacrylate) (PEMA), poly(n-butyl methacrylate) (PnBMA), and poly(iso-butyl methacrylate) (PiBMA). Silicon 2,3-naphthalocyanine bis(trihexylsilyloxide) (SiNc, Aldrich), 1,1′-dioctadecyl-3,3,3′,3′-tetra-methylindodicarbocyanine, 4-chlorobenzenesulfonate salt (DiD, PromoCell), and 1,1′-dioctadecyl-3,3,3′,3′-tetramethyl indotricarbocyanine iodide (DiR, PromoCell) were used as dyes. A typical procedure for the preparation of PNP is as follows: a chloroform solution of a polymer and a dye was added to 10 mL of an aqueous solution of a surfactant: sodium dodecyl sulfate (SDS, Tokyo Chemical Industry) or polyoxyethylene sorbitan monolaurate (Tween 20, Tokyo Chemical Industry). The emulsion of the polymer solution was prepared by ultrasonication at a frequency of 22.5 kHz and a power of 20 W (Microson XL2000, Misonix) for 30 s at 0 °C. The PNP was obtained after the removal of chloroform by stirring the sample solution at 40 °C for 90 min. The diameter of the nano-particle was measured by the dynamic light scattering method (ELSZ-2, Otsuka Electronics) and transmission electron microscopy (JEM-2100F, JEOL). Water dispersed gold nano-rods (80 × 25 nm and 200 × 50 nm) were purchased from Nanopartz.The PA intensity measurement was carried out using a home-built apparatus. The sample solution in a polystyrene cell with an optical path length of 1 mm was immersed in a temperature-controlled water bath (±0.1 °C). The samples were illuminated by laser pulses with a width of 800 ps and an energy of 40 μJ from a dye laser pumped by a nitrogen laser (OB-401 and OB-4300, Optical Building Blocks, respectively). The acoustic signal was detected by a hydrophone (H9C, Toray Engineering) with a band width of 0.5–10 MHz through an amplifier (Model 5682, Olympus NDT). A schematic illustration of the apparatus is shown in Fig. S1a in ESI.† All of the measurements were carried out at a concentration with an absorbance of 0.5 at a peak wavelength. For in vivo imaging, normal nude mice (7 weeks old, male; BALB/c slc-nu/nu, Japan SLC) were used. Fluorescence imaging of mice was carried out using an IVIS Lumina system (Xenogen). The PA imaging was performed on a home-built system. A mouse was irradiated by pulses at an energy density of 20 mJ cm−2 from a Ti:Sapphire laser (LT-2211A, LOTIS TII). The PA signal from the irradiated point was detected by a focused transducer (V383, Olympus NDT) and scanning the mouse on a motorized XY stage (SGAM20-35XY, Sigma Koki) equipped with a temperature controller to obtain a PA image (Fig. S1b†). The mice were subcutaneously injected with the PNP and gold nano-rod dispersed in phosphate-buffer saline (PBS). During the imaging, the mice were kept on the motorized XY stage under anesthesia using isoflurane gas. All animal experiments were performed according to the Institutional Guidance of Kyoto University on Animal Experimentation and under permission by animal experiment committee on Faculty of Engineering, Kyoto University.
Results and discussion
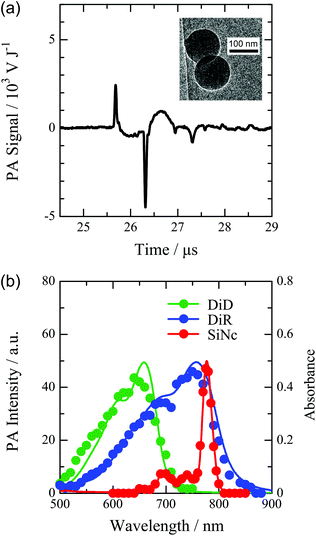
The nano-emulsion method allowed the preparation of the PNP from various hydrophobic polymers and dyes. For example, we prepared the PNP from polystyrene (PS) and poly(alkyl methacrylate)s with phthalocyanine, carbocyanine, and porphyrin derivatives. A transmission electron microscopy image of PNPs consisting of PS and 2,3-naphthalocyanine bis(trihexylsilyloxide) (SiNc) is shown as the inset of Fig. 1a, indicating the spherical particles with a diameter of 100 nm. The PNP with a diameter in the range of 40–200 nm was available by varying the concentration of polymers and surfactants (the results of the dynamic light scattering measurement are shown in Fig. S2a in the ESI†). The PA signal from the dispersion of the 100 nm PNP is shown in Fig. 1a. The waveform of the PA signal was dependent on the shape of the illuminated volume which is determined by the optical path length of the sample cell and the beam profile.On the other hand, the PA waveform was not dependent on the properties of PNP: the size, dyes, surfactants, and polymers as shown in Fig. S2b and S3.† We discuss the effect of the properties of PNP on the intensity of the PA signal, which is defined as the peak-to-peak amplitude normalized by the light energy absorbed by the solution. The absorption band of the PNP can be easily tuned in a wide range of wavelengths by the choice of dyes. Fig. 1b shows the absorption spectra and the wavelength dependence of the PA intensity for the PNP containing SiNc, 1,1′-dioctadecyl-3,3,3′,3′-tetra-methylindodicarbocyanine 4-chlorobenzenesulfonate salt (DiD), and 1,1′-dioctadecyl-3,3,3′,3′-tetramethyl indotricarbocyanine iodide (DiR). The PA spectra were in good agreement with the corresponding light absorption, indicating the tunability of the excitation wavelength of the PNP in the PA measurement. In the design of the PA imaging contrast agent, the molar absorption coefficient is one of the most important factors to obtain a high intensity at a low concentration because the PA intensity is proportional to the heat supplied by the light absorption. SiNc has a molar absorption coefficient of 5.7 × 10⁵ M−1 cm−1 with a sharp absorption band at 780 nm. Therefore, the PNP containing SiNc would be a most effective contrast agent for the PA imaging with a strong light absorption in the optical window region for biological tissues. The absorption coefficient of the dye-doped PNP can be increased by increasing the ratio of the dye to PS in the PNP. However, the increase of the dye fraction resulted in the broadened size distribution. It was found that the maximum fraction of SiNc was 30 wt% to obtain the mono-disperse PNP. The highest molar absorption coefficient of the PNP with a diameter of 100 nm was 2.0 × 10¹⁰ M−1 cm−1, which is on the same order as that of the gold nano-particle with a similar size.24
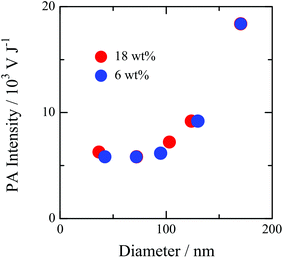
Fig. 2 shows the particle size dependence on the PA intensity. This indicates that the PA intensity is not dependent on the particle size for the PNP less than 100 nm and that the signal intensity considerably increases with the increase of the size in the diameter range of >100 nm. The photo-acoustic pressure, p, is given as:
| p = ΓηH, | (1) |
| Γ = βκ/ρCp | (2) |
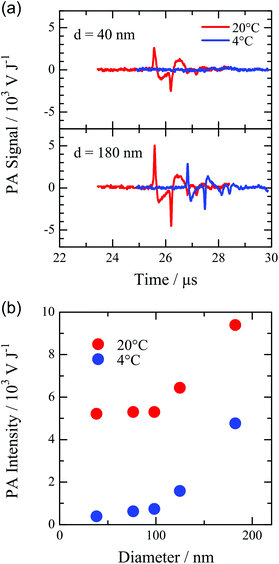
The apparent size dependence of the Grüneisen parameter for the PNP dispersion can be explained by the heat transfer from PNP to water. After the laser irradiation, some part of the heat by the light absorption of the particle diffuses into the water medium. Consequently, the sound pressure consists of the contributions from the volume expansion of water and PNP. The heat partitioning in the PNP and the water medium is dependent on the particle size; therefore, Γ was apparently dependent on the diameter of the PNP. In order to examine the sound pressure components of water and PNP, the photo-acoustic signals at 4 and 20 °C were compared. Since the thermal expansion coefficient of water is zero at 4 °C, the photo-acoustic signal from the water medium should be negligible.25 The PA intensity at 4 °C corresponds to the acoustic pressure component only by the volume expansion of the PNP. Thus, the comparison of the signals at 4 and 20 °C clarifies the heat transfer from the PNP to water.
The PA signals at 4 and 20 °C for the PNPs of PS with diameters of 40 and 100 nm are shown in Fig. 3a. The PA signal for the 40 nm PNP markedly decreased at 4 °C, indicating that most of the heat supplied by the laser pulse was transferred to water and the volume expansion of water resulted in the PA wave. On the other hand, the PA signal was observed from the 100 nm PNP at 4 °C. This indicates that the PA wave was generated by the volume expansion of the PNP. Fig. 3b shows the size dependence of the PA signals at 4 and 20 °C. For the PNP less than 100 nm, the PA signal was considerably small at 4 °C compared to that at 20 °C, indicating the fast heat transfer from the PNP to water. On the other hand, the PA signal increased with the increase of the diameter of the PNP larger than 100 nm. This indicates that the heat remaining in the PNP increased with the increase of the particle size. The sound pressure component of the PNP at 20 °C is 50% for the PNP with a diameter of 180 nm, whereas that for the 40 nm PNP is as small as 6%.26 The values of Γ for water and PS are 0.11 and 0.73 at 20 °C, respectively. Therefore, the efficient generation of the PA signal is expected for the volume expansion of the PNP consisting of PS. The heat supplied to a PNP by a laser pulse is proportional to the cube of the particle size because the light absorption linearly depends on the amount of SiNc in a PNP. The heat transfer occurs across the surface of the PNP. On the other hand, the surface area of a PNP increases depending on only the square of the particle size. Consequently, the larger the particle size is, the larger part of the heat supplied by the laser pulse remains in the PNP. Thus, the enhancement of the PA signal of the larger PNP can be explained by the reduction of the heat transfer from the PNP to the water medium. Gold nano-particles have been extensively studied as contrast agents in the PA imaging. The PA intensity from the PNP was compared with that from the gold nano-rod (Au-NR), which has been used as a strong contrast agent for the PA imaging in the near infrared region.7,12,13
Table 1 summarizes the molar absorption coefficient ε and the PA intensity A of the PNPs and the Au-NRs. The PA intensities from the 200 × 50 nm and 80 × 25 nm Au-NRs were almost the same. The photo-acoustic signal of PNP is larger than that of Au-NR with a similar absorption coefficient and particle size. This indicates that the apparent conversion efficiency from light to sound for PNP is far larger than that for Au-NR, whereas the values of Γ for gold and PS are evaluated to be 2.9 and 0.73 from their physical constants, respectively. This is due to the difference in the thermal diffusivity of PS and gold (0.086 and 127 mm2 s−1, respectively). The diffusion length of the heat in gold in 1 ns is estimated to be 350 nm. Therefore, the heat in an Au-NR less than a few hundred nm is transferred to the surrounding water medium in the pulse duration. We observed that the photo-acoustic signal from the Au-NR almost vanished at 4 °C (see Fig. S4 in ESI†), indicating no contribution of the thermal expansion of the Au-NR on the acoustic wave generation. In the photo-acoustic wave generation process from gold nano-particles, the heat by the light absorption rapidly transfers to the surrounding water from the gold particle, resulting in the PA wave only by the volume expansion of water with Γ of 0.11. This also results in the weak size dependence of the PA signal from the Au-NRs as shown in Table 1. On the other hand, the heat absorbed by a laser pulse remains in the PNP in the time scale of the sound generation as indicated in Fig. 3. This resulted in the strong PA wave due to the expansion of both the water medium and the particle of PS with the large Grüneisen parameter. Thus, although the Grüneisen parameter of PS is smaller than that of gold, the PNP of PS shows much higher light-acoustic conversion efficiency compared to Au-NR. The PA intensity from the PNP can be enhanced by the reduction of the heat diffusion by the increase of the diameter. PNP-PS-160 showed further enhancement of the PA signal due to the decreased thermal diffusion compared to PNP-PS-94. The PA intensities normalized by the particle concentration were 3.49 V J−1 pM−1 for Au-NR and 106 V J−1 pM−1 for PNP-PS-160, indicating a 30-fold enhancement of the PA signal for the PNP compared to the Au-NR. Moreover, the durability against the laser pulse was examined (Fig. S5†). The photo-acoustic intensity of Au-NR decreased to 75% from the initial value after 400 pulses. This is due to the decrease of the absorption coefficient of Au-NR by the structural change to a spherical shape.27 On the other hand the PNP showed no bleaching of the photo-acoustic intensity even after more than 3000 laser shots. Thus, the PNP shows large photo-acoustic conversion efficiency and high durability against the repeated pulse irradiation.
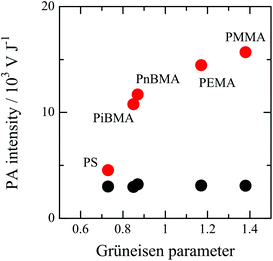
The PA intensities of the PNPs consisting of different polymers were compared. The PNPs of the following polymers with SiNc were prepared: PMMA, PEMA, PnBMA, PiBMA, and PS, which have Grüneisen parameters of 1.38, 1.17, 0.87, 0.85, and 0.73, respectively.28–30Fig. 4 shows the relationship between the PA intensity and the Grüneisen parameter of the polymers of the PNPs. The red circles in this figure indicate the PA intensity for the PNPs with a diameter of 123 ± 1 nm and the molecular absorption coefficient of (2.4 ± 0.2) × 1010 M−1 cm−1. This indicates that the PA intensity increased with the increase of the Grüneisen parameter of the matrix polymer of the PNP. On the other hand, the black data points in Fig. 4 show the polymer dependence of the PA intensity for the PNPs with a diameter of 46 ± 5 nm, indicating that the PA intensity is not dependent on the Grüneisen parameter. As mentioned above, because the heat supplied to the small particle is rapidly transferred to the surrounding water, the PA wave was generated by the volume expansion of water. Therefore, the PA intensity is not dependent on the physical properties of the matrix polymer. For the PNP larger than 100 nm, the heat transfer is relatively slow. The acoustic pressure consists of the contribution of the thermal expansion of the water medium and the PNP. Since the thermal diffusivity of the polymer materials shows similar values of ca. 0.1 mm2 s−1, the pressure component from the water medium can be assumed to be the same for the PNPs of these polymers. Therefore, the increase of the PA intensity from the PNP of PMMA is attributed to the increase of the pressure component due to the thermal expansion of the nano-particle dependent on the Grüneisen parameter. This result indicates that the thermal confinement in the nano-particle and the large Grüneisen parameter of the material of PNP is the most important factors to design the nano-particle contrast agent for the PA imaging. The heat transfer is a key factor for the gold nano-particle contrast agent for the PA imaging; however, the strategy for the design of the high sensitivity agent is completely different. Because gold inherently has a high thermal diffusivity, the heat transfer from a nano-particle of gold to the water medium cannot be suppressed. The volume expansion of water is the origin of the PA wave from the dispersion of the gold nano-particles. Therefore, the rapid volume expansion by the increase of the heat transfer rate results in the enhancement of the photo-acoustic pressure.11,31,32 On the other hand, the thermal diffusion in polymeric materials is slow compared to that of metal; therefore, the heat can be confined in the particle, resulting in the strong PA wave by the volume expansion of the PNP with a large Grüneisen parameter. Therefore, the sensitivity can be increased by the suppression of the heat transfer to the surrounding medium and the use of polymeric materials with a large Grüneisen parameter. Considering such an enhancement mechanism, the PNP of PMMA emitted a 9-fold larger PA signal compared to that of Au-NR.
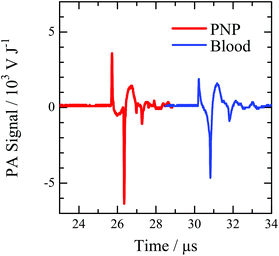
Hemoglobin in red blood cells (RBCs) is an endogenous strong light absorber, resulting in the strong PA signal from blood vessels. In order to use the PNP as a contrast agent in the in vivo PA imaging, it is necessary to generate the comparable or greater PA signal than that from blood. The PA intensity from PNP with a diameter of 160 nm and an absorption coefficient of 5.0 × 10¹⁰ M−1 cm−1 was compared to that of the whole blood of a mouse. The PA wave from the PNP dispersion and the blood at an excitation wavelength of 780 nm is shown in Fig. 5. The PA intensities for the mouse blood and the PNP at a concentration of 10 pM were 6.45 and 10.6 kV J−1, respectively. This indicates that the PA intensity from the PNP is larger than that from the blood. From the number densities for RBC of 107 cells μL−1 and the PNP dispersion of 6 × 10⁶ particles μL−1, the PA intensities from a single RBC and PNP are estimated to be 0.645 and 1.77 mV J−1. Considering the volumes of a PNP-PS-160 and a RBC (0.002 and 50 fL, respectively), the PNP emits the PA signal greater than that of blood. Thus, the PNP containing a NIR dye could be used as a sensitive contrast agent for in vivo PA imaging.
The in vivo photo-acoustic imaging of mice was demonstrated. Prior to the in vivo imaging, we confirmed that the PNP was stably dispersed in phosphate buffered saline (PBS) and fetal bovine serum (FBS) without aggregation for 2 weeks as shown in Fig. S6a.† Moreover, the leakage of the dye fraction into the FBS medium was not observed because of the strong hydrophobicity of SiNc (see Fig. S6b†). These results indicate that the PNP can be used under in vivo conditions. The mouse was subcutaneously injected with 20 μL of the dispersions of PNP-PS-160 and Au-NR at concentrations of 0.10 and 0.42 nM in PBS, respectively. Fig. 6a shows the fluorescence image at a wavelength range of 780 ± 10 nm under the excitation at 675 ± 15 nm. The PNP containing SiNc emits the weak fluorescence at 780 nm with a quantum efficiency of ca. 0.01. In the fluorescence image, the distribution of PNP-PS-160 is brightly observed. On the other hand, because Au-NR injected on the right hand side emits no fluorescence signal, it cannot be seen in the fluorescence image. Fig. 6b shows the PA image of an 18 × 18 mm2 area where the fluorescence of PNP-PS-160 was detected. The PA signal from the PNP was clearly detected in this image. Fig. 6c shows the PA image of the Au-NR with a size of 80 × 25 nm (Au-NR-80) in a mouse. The signal intensity of the PNP was 5 times greater than that of the Au-NR-80, whereas the concentration of the PNP dispersion was 4-fold lower than that of Au-NR. The signal to noise ratios (SNR) in the PA imaging with PNP-PS-160 and Au-NR-80 were 560 and 106, respectively. The detection limit (SNR = 1) for PNP-PS-160 can be estimated to be 0.18 pM. The PNP consisting of a material with a high Grüneisen parameter would improve the signal intensity. The PNP consisting of PMMA showed the SNR of 550 at the injection concentration of 0.04 nM (shown in Fig. S7†). The PNP-PMMA shows a similar SNR although the concentration of the PNP of PMMA was 2.5 times lower than that of PNP-PS. This indicates the higher sensitivity of PNP of PMMA and the detection limit can be improved to several tens of femtomolar. Thus, the PNP enables the in vivo PA imaging with higher sensitivity than the gold nano-particle probe. The blood circulation and accumulation in tissues can be optimized without changing the optical properties by the precise control of the particle size and the surface modification. For example, the PEGyrated PNP was prepared by the addition of dimyristoyl phosphatidylethanolamine-bound polyethylene glycol (DMPE-PEG2000, NOF) in the nano-emulsion process without significant effects on the size distribution and PA properties (Fig. S3†). Thus, the PNP with a NIR dye can be used as a high sensitivity contrast agent in the in vivo PA imaging.
Conclusions
We showed that the polymer nano-particle (PNP) containing an NIR absorbing dye generates the strong PA signal. The enhancement of the PA signal can be achieved by the suppression of the heat transfer from the PNP to the water medium. Because of the low thermal diffusivity of polymer materials, the diffusion of the heat induced by a laser pulse from the PNP to the water medium is restricted. The thermal expansion of the PNP with the large Grüneisen parameter compared to water results in the generation of a stronger PA wave than gold nano-particles. Moreover, the spectral feature and the blood circulation of the PNP by the nano-emulsion method can be easily optimized. The polymer nano-particles with NIR dyes would be a promising contrast agent for the photo-acoustic imaging modality.Acknowledgements
This work was supported by the Innovative Techno-Hub for Integrated Medical Bio-imaging Project of the Special Coordination Funds for Promoting Science and Technology from Ministry of Education, Culture, Sports, Science and Technology (MEXT), Japan.References
- L. V. Wang and H.-i. Wu, Biomedical Optics: Principles and Imaging, Wiley-Interscience, Hoboken, 2007 Search PubMed.
- G. P. Luke, D. Yeager and S. Y. Emelianov, Ann. Biomed. Eng., 2012, 40, 422–437 CrossRef PubMed.
- L. V. Wang and S. Hu, Science, 2012, 335, 1458–1462 CrossRef CAS PubMed.
- A. de la Zerda, C. Zavaleta, S. Keren, S. Vaithilingam, S. Bodapati, Z. Liu, J. Levi, B. R. Smith, T.-J. Ma, O. Oralkan, Z. Cheng, X. Chen, H. Dai, B. T. Khuri-Yakub and S. S. Gambhir, Nat. Nanotechnol., 2008, 3, 557–562 CrossRef CAS PubMed.
- A. de la Zerda, S. Bodapati, R. Teed, S. Y. May, S. M. Tabakman, Z. Liu, B. T. Khuri-Yakub, X. Chen, H. Dai and S. S. Gambhir, ACS Nano, 2012, 6, 4694–4701 CrossRef CAS PubMed.
- D. Pan, X. Cai, C. Yalaz, A. Senpan, K. Omanakuttan, S. A. Wickline, L. V. Wang and G. M. Lanza, ACS Nano, 2012, 6, 1260–1267 CrossRef CAS PubMed.
- A. Agarwal, S. W. Huang, M. O'Donnell, K. C. Day, M. Day, N. Kotov and S. Ashkenazi, J. Appl. Phys., 2007, 102, 064701 CrossRef.
- K. H. Song, C. Kim, C. M. Cobley, Y. Xia and L. V. Wang, Nano Lett., 2009, 9, 183–188 CrossRef CAS PubMed.
- X. Yang, S. E. Skrabalak, Z.-Y. Li, Y. Xia and L. V. Wang, Nano Lett., 2007, 7, 3798–3802 CrossRef CAS PubMed.
- X. Cai, W. Li, C.-H. Kim, Y. Yuan, L. V. Wang and Y. Xia, ACS Nano, 2011, 5, 9658–9667 CrossRef CAS PubMed.
- Y.-S. Chen, W. Frey, S. Kim, P. Kruizinga, K. Homan and S. Emelianov, Nano Lett., 2011, 11, 348–354 CrossRef CAS PubMed.
- M. Eghtedari, A. Oraevsky, J. A. Copland, N. A. Kotov, A. Conjusteau and M. Motamedi, Nano Lett., 2007, 7, 1914–1918 CrossRef CAS PubMed.
- J. V. Jokerst, M. Thangaraj, P. J. Kempen, R. Sinclair and S. S. Gambhir, ACS Nano, 2012, 6, 5920–5930 CrossRef CAS PubMed.
- G. Ku and L. V. Wang, Opt. Lett., 2005, 30, 507–509 CrossRef PubMed.
- D. Razansky, C. Vinegoni and V. Ntziachristos, Opt. Lett., 2007, 32, 2891–2893 CrossRef CAS PubMed.
- S. Bhattacharyya, S. Wang, D. Reinecke, W. Kiser, R. A. Kruger and T. R. DeGrado, Bioconjugate Chem., 2008, 19, 1186–1193 CrossRef CAS PubMed.
- S. M. Moghimi, A. C. Hunter and J. C. Murray, Pharmacol. Rev., 2001, 53, 283–318 CAS.
- W. H. De Jong and P. J. Borm, Int. J. Nanomedicine, 2008, 3, 133–149 CrossRef CAS PubMed.
- S. Kim, J.-H. Kim, O. Jeon, I. C. Kwon and K. Park, Eur. J. Pharm. Biopharm., 2009, 71, 420–430 CrossRef CAS PubMed.
- N. R. B. Boase, I. Blakey and K. J. Thurecht, Polym. Chem., 2012, 3, 1384–1389 RSC.
- T. L. Doane and C. Burda, Chem. Soc. Rev., 2012, 41, 2885–2911 RSC.
- C. Solans, P. Izquierdo, J. Nolla, N. Azemar and M. Garcia-Celma, Curr. Opin. Colloid Interface Sci., 2005, 10, 102–110 CrossRef CAS.
- N. Anton, J.-P. Benoit and P. Saulnier, J. Controlled Release, 2008, 128, 185–199 CrossRef CAS PubMed.
- E. C. Cho, C. Kim, F. Zhou, C. M. Cobley, K. H. Song, J. Chen, Z.-Y. Li, L. V. Wang and Y. Xia, J. Phys. Chem. C, 2009, 113, 9023–9028 CAS.
- S. E. Braslavsky and G. E. Heibel, Chem. Rev., 1992, 92, 1381–1410 CrossRef CAS.
- The sound pressure, P, consists of the pressure components of the volume expansion of water and PNP: P = Pw + Pp, where Pw and Pp are the sound pressure component by the volume expansion of the water medium and the PNP, respectively. The value of the Pp can be estimated as the sound pressure at 4 °C because the expansion of water is negligible. Therefore, the pressure component at 20 °C is evaluated by the ratio of the PA signals at 4 and 20 °C.
- S.-S. Chang, C.-W. Shih, C.-D. Chen, W.-C. Lai and C. R. C. Wang, Langmuir, 1999, 15, 701–709 CrossRef CAS.
- J. Brandrup, E. H. Immergut, E. A. Grulke, A. Abe and D. R. Bloch, Polymer Handbook, John Wiley & Sons, New York, 4th edn, 1999 Search PubMed.
- E. Morita, R. Kono and H. Yoshizaki, Jpn. J. Appl. Phys., 1968, 7, 451–461 CrossRef CAS.
- A. M. North, R. A. Pethrick and D. W. Phillips, Polymer, 1977, 18, 324–326 CrossRef CAS.
- I. G. Calasso, W. Craig and G. J. Diebold, Phys. Rev. Lett., 2001, 86, 3550–3553 CrossRef CAS PubMed.
- G. J. Diebold, A. C. Beveridge and T. J. Hamilton, J. Acoust. Soc. Am., 2002, 112, 1780–1786 CrossRef PubMed.
Footnote |
| † Electronic supplementary information (ESI) available. See DOI: 10.1039/c4nr04724a |
| This journal is © The Royal Society of Chemistry 2015 |

