
Preparation, characterization and the effect of PANI coated TiO2 nanocomposites on the performance of polysulfone ultrafiltration membranes
Valeen Rashmi
Pereira
a,
Arun M.
Isloor
*a,
Amir Al
Ahmed
b and
A. F.
Ismail
c
aMembrane Technology Laboratory, Chemistry Department, National Institute of Technology Karnataka, Surathkal, Mangalore 575 025, India. E-mail: isloor@yahoo.com; Fax: +91 824 2474033
bCenter of Research Excellence in Renewable Energy, King Fahd University of Petroleum and Minerals, Dhahran-31261, Saudi Arabia
cAdvanced Membrane Technology Research Center (AMTEC), Universiti Teknologi Malaysia, 81310 Skudai, Johor Bahru, Malaysia
First published on 7th November 2014
Abstract
Polysulfone ultrafiltration (UF) membranes with PANI–TiO2 (polyaniline–titania) nanocomposites and PEG 1000 (Polyethylene Glycol 1000) as additives were prepared by the phase inversion method. PANI–TiO2 nanocomposites were synthesized by coating TiO2 nanotubes with PANI via chemical oxidative polymerization. The synthesized PANI–TiO2 nanocomposite was characterized by Fourier Transform Infrared Spectroscopy (FTIR), X-ray diffraction (XRD) and Transmission Electron Microscope (TEM) analysis. PANI–TiO2 nanocomposites with varying concentrations (0–1.5 wt%) were dispersed in the polysulfone membrane matrix with N-methyl-2-pyrrolidone (NMP) as solvent along with PEG 1000 as the pore former. The effect of addition of PANI–TiO2 nanocomposites with different concentrations (0–1.5 wt%) on the membrane structure, performance, hydrophilicity and the antifouling nature of the membranes was analyzed. PANI–TiO2 nanocomposite membranes showed better hydrophilicity, improved permeability, enhanced porosity, water uptake and good antifouling ability when compared with neat polysulfone membranes. The performance of the membranes improved with the increase in the addition of the PANI–TiO2 nanocomposite. However, the membrane performance decreased slightly at 1.5 wt% addition of PANI–TiO2 due to the agglomeration of PANI–TiO2 at higher concentration. The well performed membranes were also subjected to heavy metal ion rejection. The membranes showed a rejection of 83.75% and 73.41% during the polymer enhanced ultrafiltration (PEUF) process and a rejection of 68% and 53.78% during the UF process for Pb2+ and Cd2+ respectively.
1. Introduction
Ultrafiltration is an important membrane separation process which is used for the purification of water,1 for concentration of solutes and wastewater treatment. A suitable membrane material with good pore structure, permeability, hydrophilicity and antifouling nature plays an important role in the separation process. Polysulfone is one of the widely used materials for the preparation of ultrafiltration membranes,2 because of its excellent mechanical strength, chemical resistance, thermal stability and good film forming ability.3 However polysulfone membranes being hydrophobic in nature are susceptible to fouling. Thus the modification of polysulfone membranes is inevitable. Many efforts such as blending hydrophilic additives, chemical grafting, and surface coating have been devoted to improve the hydrophilicity of polysulfone membranes.4 In recent years, research has been focused on incorporation of nanomaterials into the membranes to improve the separation performance and fouling resistance.5 Various inorganic nanomaterials that have been used to improve the polysulfone membrane include TiO2, SiO2, ZnO, Ag, Al2O3, and Fe2O3. Among these inorganic nanoparticles, TiO2 has received much attention and is one of the most widely used nanoparticles, due to its stability, availability, antibacterial nature and hydrophilicity.6In recent years nanohybrid materials with at least two different nanomaterials have gained interest where the benefits of two different particles could be combined to have improvement in properties.7 Polyaniline (PANI) based nanocomposites have been extensively studied due to their facile preparation and environmental stability.8 A large number of studies have been focused on preparation of PANI–TiO2 composites.9 TiO2 is considered as the best material to prepare hybrid material with PANI.10 Ti of TiO2 has a tendency to form a co-ordinate bond with N of PANI.11 PANI–TiO2 nanocomposites have applications in photocatalysis, charge storage and gas sensors.9,10 Also polymer–PANI and PANI–inorganic materials have shown improvement in the performance of membranes due to the hydrophilicity of PANI. Teli et al. modified the commercial TiO2 nanoparticles with PANI and incorporated them into the polysulfone membranes.11 The obtained membranes had better permeability, higher hydrophilicity and antifouling properties. Daraei et al. prepared a polyether sulfone nanocomposite membrane with core–shell PANI–Fe3O4 nanoparticles which showed enhanced performance for Cu(II) removal from water.12 Zhao et al. prepared a polyaniline–poly(vinylpyrrolidone) (PANI–PVP) nanocomposite and used it as an additive to polysulfone membranes. The membranes showed better permeability and antifouling properties.13
TiO2 nanotubes can act as excellent support materials for PANI due to their high surface area.14 On the other hand, TiO2 nanomaterials are known to undergo agglomeration in order to reduce their surface energy.15 The presence of PANI on TiO2 can prevent the agglomeration, increasing the stability of TiO2 nanomaterials and facilitate uniform dispersion in the polymer matrix. Our previous study indicated that, addition of TiO2 nanotubes has significantly improved the membrane performance.16 Both PANI and TiO2 nanotubes have been reported to be good additives in improving the membrane performance.16,17 The synthesized PANI–TiO2 nanocomposite could combine the merit of both TiO2 and PANI and have a synergistic effect.15 Also PANI–TiO2 having strong interaction between PANI and TiO2 is known to have well dispersible nature in NMP (N-methyl-2-pyrrolidone).18 These merits of PANI–TiO2 are beneficial to the improvement of properties of the membrane and hence enhancement in the performance of the membrane is expected.
In this work, PANI–TiO2 nanocomposites with an average diameter of 50 nm were synthesized by coating PANI over TiO2 nanotubes. PANI coated nanotubes were dispersed in polysulfone membranes containing PEG 1000 as a pore former. The effect of addition of the PANI–TiO2 nanocomposite on the membrane performance, such as permeability, hydrophilicity, porosity and antifouling properties were studied. To the best of our knowledge, it is the first time TiO2 nanotubes coated with PANI have been used as hydrophilic additives for the performance improvement of polysulfone membranes.
2. Materials and methods
2.1. Materials
Polysulfone (Psf) with molecular weight 35![[thin space (1/6-em)]](https://www.rsc.org/images/entities/char_2009.gif) 000 Da, aniline (99.5%) and TiO2 nanoparticles were purchased from Sigma Aldrich Co. Bangalore, India. Polyethylene glycol 1000 (PEG 1000) was purchased from Himedia Laboratories Pvt. Ltd, India. Ammonium peroxydisulfate (APS) and Bovine Serum Albumin (BSA) was purchased from Central Drug House (CDH), New Delhi. Hydrochloric acid (HCl), sodium hydroxide (NaOH) and N-methyl-2-pyrrolidone (NMP) was purchased from Merck India, Ltd. Polyethyleneimine (PEI) (Mn ∼ 60000) 50 wt% aq. solution, branched was purchased from Acros Organics, USA. Lead(II) nitrate and cadmium nitrate tetrahydrate and were purchased from Sigma-Aldrich Co, Bangalore, India.
000 Da, aniline (99.5%) and TiO2 nanoparticles were purchased from Sigma Aldrich Co. Bangalore, India. Polyethylene glycol 1000 (PEG 1000) was purchased from Himedia Laboratories Pvt. Ltd, India. Ammonium peroxydisulfate (APS) and Bovine Serum Albumin (BSA) was purchased from Central Drug House (CDH), New Delhi. Hydrochloric acid (HCl), sodium hydroxide (NaOH) and N-methyl-2-pyrrolidone (NMP) was purchased from Merck India, Ltd. Polyethyleneimine (PEI) (Mn ∼ 60000) 50 wt% aq. solution, branched was purchased from Acros Organics, USA. Lead(II) nitrate and cadmium nitrate tetrahydrate and were purchased from Sigma-Aldrich Co, Bangalore, India.
2.2. Preparation of PANI coated TiO2 nanotubes
Preparation of TiO2 nanotubes from TiO2 nanoparticles was done as per the literature.16 About 50 mL of 10 M NaOH solution was taken in a round bottom flask attached to a condenser with chilling. The solution was first heated to 120 °C followed by the addition of 2 g of TiO2 nanoparticles. The solution was then refluxed at the same temperature for 48 h under stirring. Then the mixture was cooled to room temperature and poured into de-ionised water. After the nanotubes were settled at the bottom, the supernatant solution was decanted and was washed repeatedly with water. 150 mL of 0.1 M HCl was then added to the solution and was stirred for 12 h at 60 °C. Then the nanotubes were again washed with de-ionized water until the neutral pH was obtained. The solution was centrifuged and the obtained nanotubes were calcined at 450 °C for 4 h.Surface modification of the TiO2 nanotubes by PANI was carried out by chemical oxidative polymerization as follows.19 1 mL of aniline was added to 100 mL of 2 M HCl solution. 1 g of TiO2 nanotubes were added to 5 mL of water and sonicated for a few minutes in order to prevent the agglomeration of the TiO2 nanotubes. This solution was then added to the solution containing aniline and stirred for two hours. The polymerization of aniline was carried out by the addition of ammonium persulfate solution with an equal molar ratio to aniline to the above suspension at room temperature. The product formed was isolated from the dispersion by centrifugation, washed with HCl and water and dried at 80 °C for 24 h.
2.3. Preparation of membranes
The nanocomposite membranes were prepared by the phase inversion method. Firstly, PANI coated TiO2 nanotubes were dispersed in NMP and sonicated for a few minutes for good dispersion. 5 wt% of PEG 1000 was dissolved in NMP and was added as a pore former for all the membranes. 2 g of Psf was added to the same dispersion, and was stirred at 60 °C for 6 h. After the complete dissolution of polysulfone, the casting solution was sonicated for 15 min and left still under heating without stirring for 30 min to remove any trapped air bubbles. Then the homogenous solution was casted onto a clean glass plate. After casting, the glass plate was immersed in a coagulation bath (water) for the phase inversion. The obtained membranes were washed thoroughly with water and dried. The composition of the prepared membranes is given in Table 1.| Membranes | Psf (wt%) | PEG (wt%) | PANI–TiO2 (wt%) | NMP (wt%) |
|---|---|---|---|---|
| P-0 | 20 | 5 | 0 | 75 |
| P-0.05 | 20 | 5 | 0.05 | 74.95 |
| P-0.5 | 20 | 5 | 0.5 | 74.5 |
| P-1.0 | 20 | 5 | 1.0 | 74 |
| P-1.5 | 20 | 5 | 1.5 | 73.5 |
2.3.1.1. Morphology of membranes. The morphology of the prepared membranes was examined using a Scanning Electron Microscope (JEOL JSM-6380LA). Before the Scanning Electron Microscope (SEM) analysis, the membranes were dipped and broken in liquid nitrogen and sputtered with gold for conductivity.
2.3.1.2. AFM measurements. The AFM (Atomic Force Microscope) measurements were carried out using an Innova SPM Atomic Force Microscope. The measurements were done on dry membrane samples. The membrane surfaces were imaged in tapping mode. An antimony doped silicon cantilever having a force constant in the range of 20–80 N m−1 was used to analyze the membrane surface topography. The surface roughness of the membranes, expressed in terms of average roughness (Ra) and root mean square roughness (Rq) was measured.
2.3.1.3. Porosity and pore size. The porosity (ε) of the membranes was obtained by a gravimetric method.20
where w1 and w2 is the weight of the wet and dry membranes respectively. ‘A’ is the effective membrane area (m2), ‘l’ is the thickness of the membrane and ‘dw’ is the density of water.

Surface pore size of the membranes in terms of mean pore radius (rm) was analyzed using Guerout–Elford–Ferry equation,20 taking into the account porosity and water flux of the membranes.

2.3.1.4. Water uptake study. In order to study the water uptake capacity of the membranes, membrane samples were cut into 1 cm2 size and kept immersed in distilled water for 24 h. The wet membranes were weighed immediately after blotting the surface water. The membrane samples were then dried in the vacuum oven at 45 °C for a few hours. The weight of the dry membrane samples was noted. From the wet and dry weights of the membranes, percent water uptake by the membranes was calculated using the equation.
where ‘Ww’ and ‘Wd’ are the weights of the wet and dry membranes respectively.

2.3.1.5. Contact angle measurements. To evaluate the hydrophilicity of the membranes, the contact angle between water and the membrane surface was measured by the sessile droplet method using a FTA-200 Dynamic contact angle analyzer.21 In order to minimize the experimental error, for each sample the contact angle was measured at three different locations and the average value was considered.
2.3.1.6. Pure water flux. The permeation properties of the membranes were tested using a dead end filtration cell. An effective membrane area of 5 cm2 was used for permeation studies. The membranes were initially dipped in distilled water for 24 h before the filtration experiments. The membranes were compacted at 0.4 MPa transmembrane pressures (TMP) for 30 min. Then the pressure was reduced to 0.2 MPa, TMP and time dependent pure water flux of the different membranes was measured for every 1 min time interval. The pure water flux (PWF) of the membranes was calculated using the following equation:
where Jw1 is the pure water flux expressed in L m−2 h−1, Q is the quantity of pure water collected (L) in time Δt (h), A is the effective membrane area (m2).

2.3.1.7. Antifouling study. Bovine Serum Albumin (BSA) was taken as a model protein to study the antifouling nature of the prepared membranes. An aqueous solution of BSA with a concentration of 0.8 g L−1 was placed in the filtration cell after the pure water flux measurement Jw1 (L m−2 h−1).22 Then the BSA solution was filtered through the membranes for 30 min at 0.2 MPa, TMP. After the BSA filtration, the fouled membranes were washed with pure water for 20 min and then the water flux Jw2 (L m−2 h−1) was measured again. In order to estimate the fouling resistant ability of the membranes, flux recovery ratio (FRR) was calculated using the equation.

2.3.1.8. Heavy metal ion rejection. Heavy metal ion rejection by the membranes was carried out by a polymer enhanced ultrafiltration (PEUF) and ultrafiltration (UF) process. For PEUF process, aqueous solutions of Pb2+ and Cd2+ were prepared at an initial concentration of 1000 ppm in 1 wt% of the PEI aqueous solution. The pH of the solutions was adjusted to 6.25 by adding small amounts of either 0.1 M HCl or 0.1 M NaOH. Solutions containing the metal ions and PEI were mixed thoroughly and left standing for 5 days for completion of binding between metal ions and PEI. PEI complexed metal ion solutions were filtered through the membranes and the permeate was collected. In the UF process, feed solutions containing 1000 ppm of Pb2+ and Cd2+ were filtered individually through the membranes and the permeate was collected. The %rejection of the metal ions by the membranes during the filtration was determined by analyzing the concentration of feed and permeate solution using an Atomic Absorption Spectrophotometer (GBC 932 Plus). Heavy metal ion rejection percentage by the membranes was calculated using the formula
where Cp (mg ml−1) and Cf (mg ml−1) are concentration of metal ions in the permeate and the feed respectively.

3. Results and discussion
3.1. PANI coated TiO2 nanotube characteristics
PANI coated TiO2 nanotubes were prepared via chemical oxidative polymerization. Firstly, the synthesised TiO2 nanotubes were dispersed in HCl solution containing aniline. In the presence of HCl, aniline gets transformed to anilinium cation. Under acidic conditions, the anilinium ions adsorb on the surface of TiO2 nanotubes and then undergo oxidative polymerization in the presence of ammonium persulfate (NH4)2S2O8, leading to the formation of PANI coating on TiO2.15FTIR spectra of pure TiO2, pure PANI and a PANI–TiO2 nanocomposite were obtained in the range of 500–3700 cm−1. Fig. 1 shows FTIR spectra. Pure TiO2 shows a broad peak at around 3400 cm−1 and a small peak at 1638 cm−1 which is due to the stretching vibration of the hydroxyl group (–OH) and adsorbed water present on TiO2.23 A broad peak at 600 cm−1 ranging from 1000 to 550 cm−1 is due to the Ti–O–Ti bonds. The FTIR spectrum of PANI shows a peak at 1567 cm−1 and 1487 cm−1 which is due to the C![[double bond, length as m-dash]](https://www.rsc.org/images/entities/char_e001.gif) N and CC stretching vibrations of quinoid and benzenoid rings of PANI respectively. Further peaks at 1298 cm−1 and 1246 cm−1 can be ascribed to the C–N stretching mode of the benzenoid ring. Peaks at 1141 cm−1 and 812 cm−1 correspond to the C–H in plane and out of plane bending vibrations respectively.24 All these peaks of PANI were observed in the IR spectrum of the PANI–TiO2 nanocomposite along with the broad –OH peak at 3400 cm−1 which was due to the surface hydroxyl group of TiO2. Also the broad peak ranging from 1000 to 550 cm−1 due to Ti–O–Ti vibrations was observed in the PANI–TiO2 nanocomposite, indicating the presence of PANI on TiO2.
N and CC stretching vibrations of quinoid and benzenoid rings of PANI respectively. Further peaks at 1298 cm−1 and 1246 cm−1 can be ascribed to the C–N stretching mode of the benzenoid ring. Peaks at 1141 cm−1 and 812 cm−1 correspond to the C–H in plane and out of plane bending vibrations respectively.24 All these peaks of PANI were observed in the IR spectrum of the PANI–TiO2 nanocomposite along with the broad –OH peak at 3400 cm−1 which was due to the surface hydroxyl group of TiO2. Also the broad peak ranging from 1000 to 550 cm−1 due to Ti–O–Ti vibrations was observed in the PANI–TiO2 nanocomposite, indicating the presence of PANI on TiO2.
 | ||
| Fig. 1 FTIR spectra of PANI, a PANI–TiO2 nanocomposite and TiO2. | ||
X-Ray diffraction patterns of the PANI–TiO2 nanocomposite, compared with pure PANI and pure TiO2 are shown in Fig. 2. Pure PANI shows two broad peaks at 2θ = 17° and 23° which can be ascribed to the (111) and (110) planes. The XRD pattern of pure TiO2 shows sharp peaks at 25.3°, 37.8°, 48.1°, 54.6° and 62.6° with respect to (101), (103), (200), (105) and (213) planes respectively of the anatase phase of TiO2.10,25 The PANI–TiO2 nanocomposite showed two broad peaks at 2θ = 17° and 23° and also all sharp peaks of TiO2 which confirmed the presence of PANI coating on TiO2 nanotubes.
 | ||
| Fig. 2 X-Ray diffraction patterns of pure PANI, a PANI–TiO2 nanocomposite and pure TiO2. | ||
TEM was carried out to observe the shape and size of PANI coated TiO2 nanotubes. TEM images of PANI coated TiO2 nanotubes are shown in Fig. 3. PANI coated TiO2 nanotubes had diameter in the range of 40–50 nm.
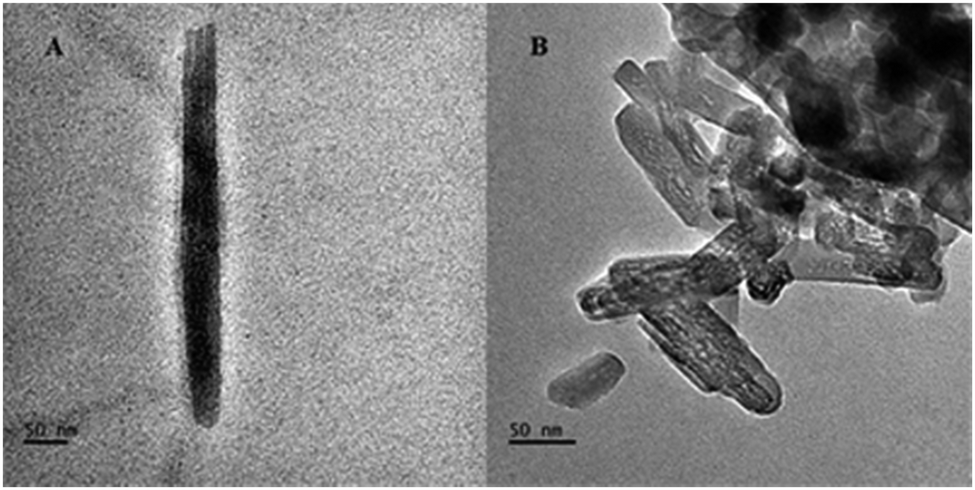 | ||
| Fig. 3 TEM images of PANI coated TiO2 nanotubes (A and B). | ||
3.2. Membrane characterization
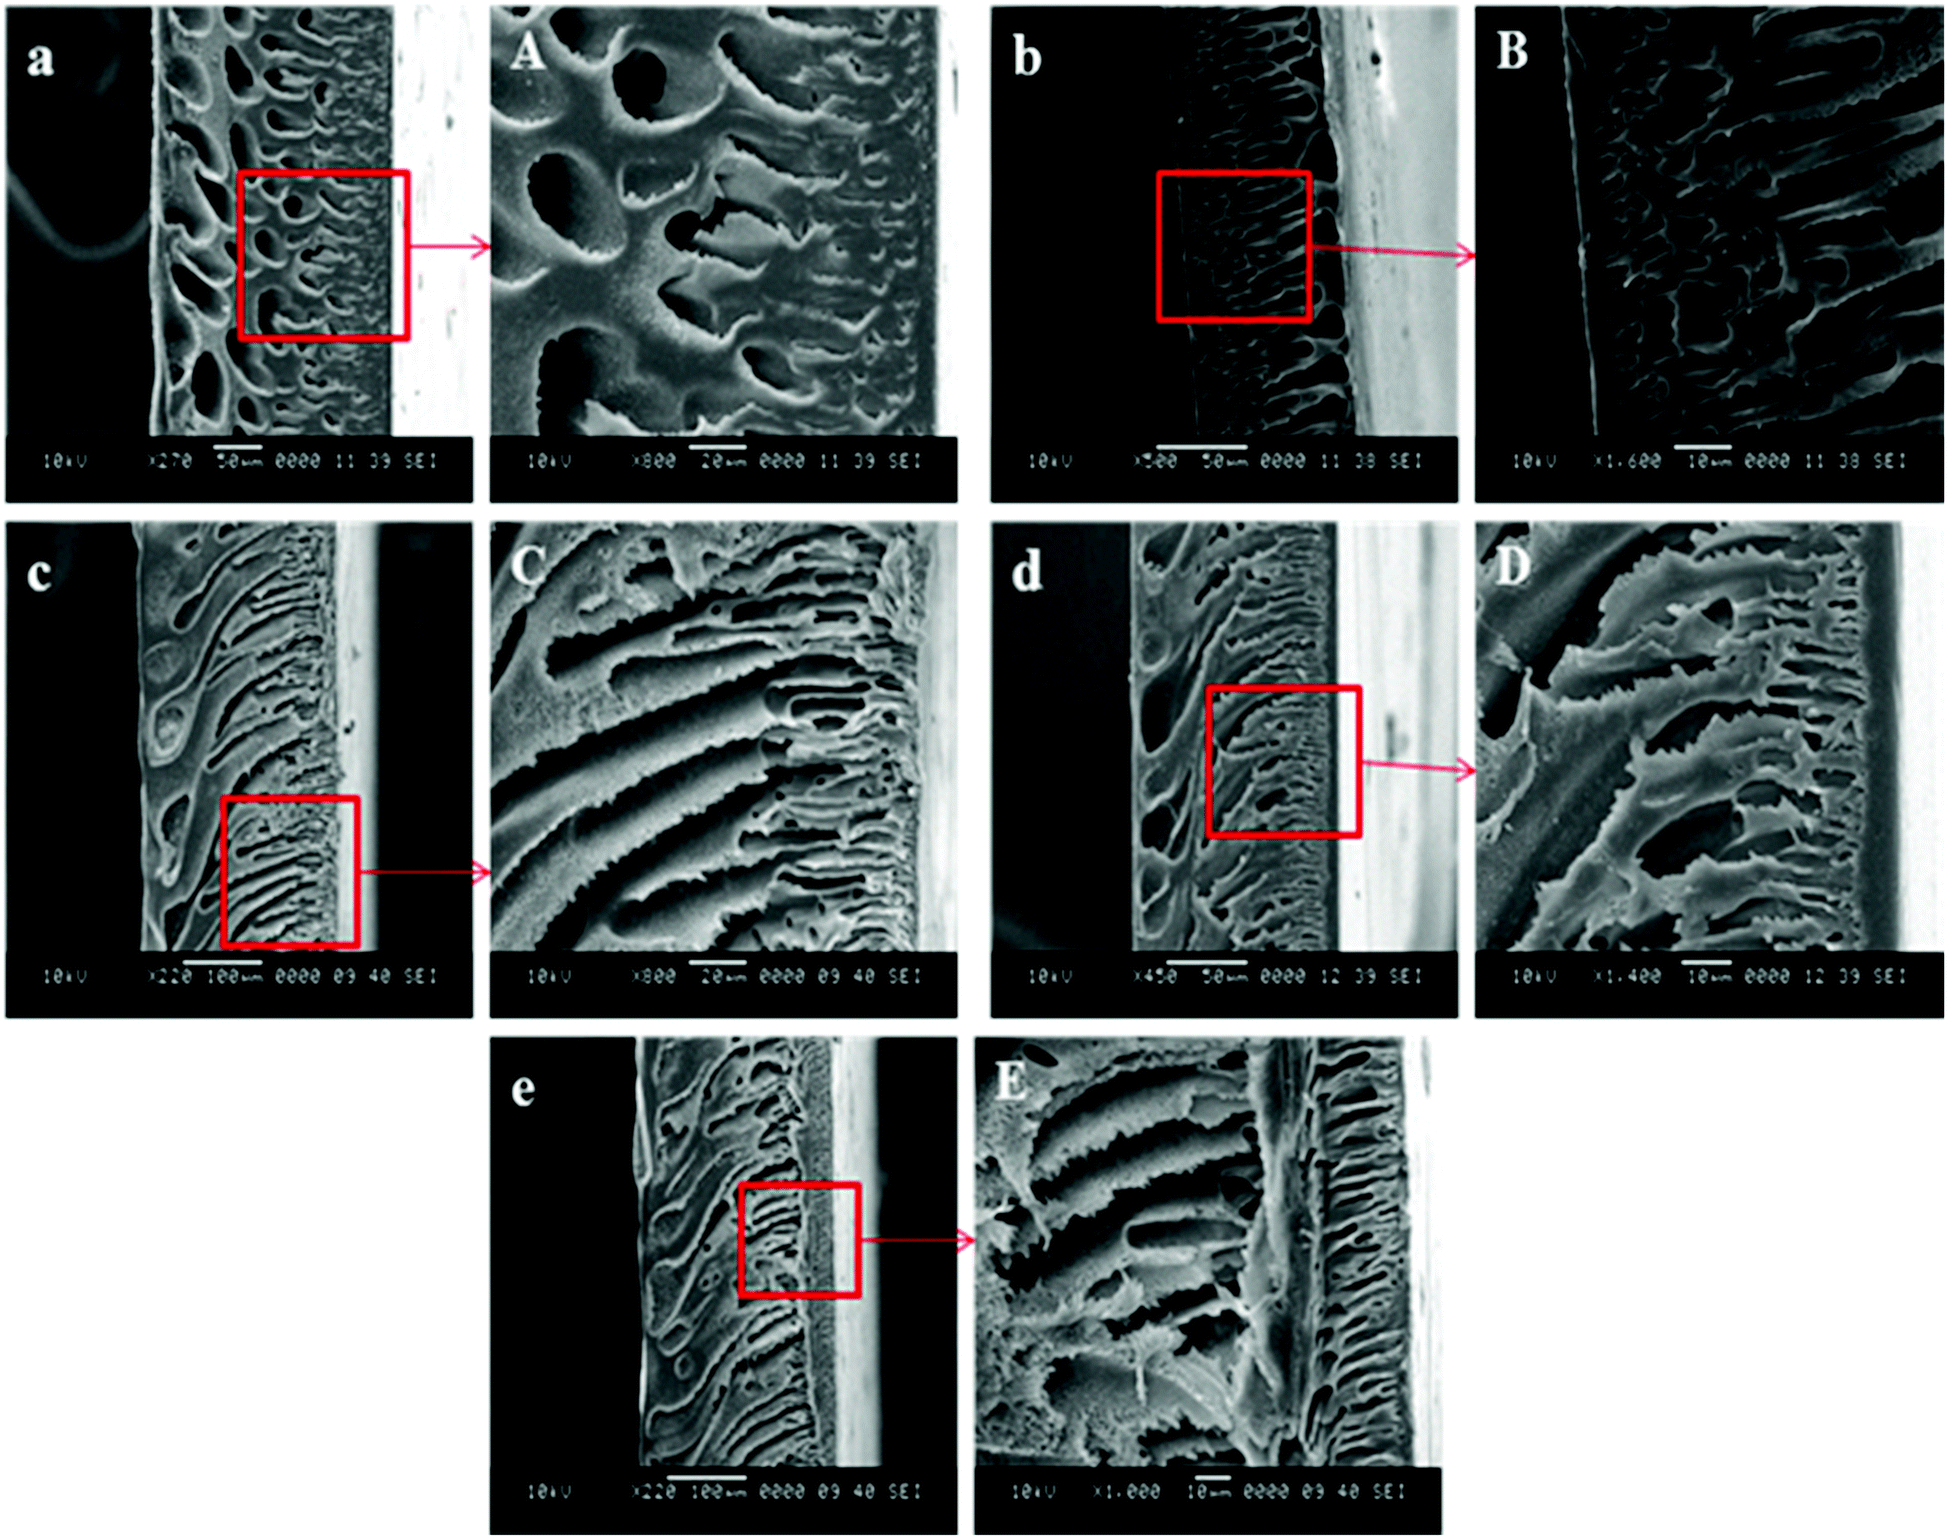 | ||
| Fig. 4 Cross sectional images of (a) P-0 (b) P-0.05 (c) P-0.5 (d) P-1.0 and (e) P-1.5 membranes (A, B, C, D and E are the enlarged images of a, b, c, d and e respectively). | ||
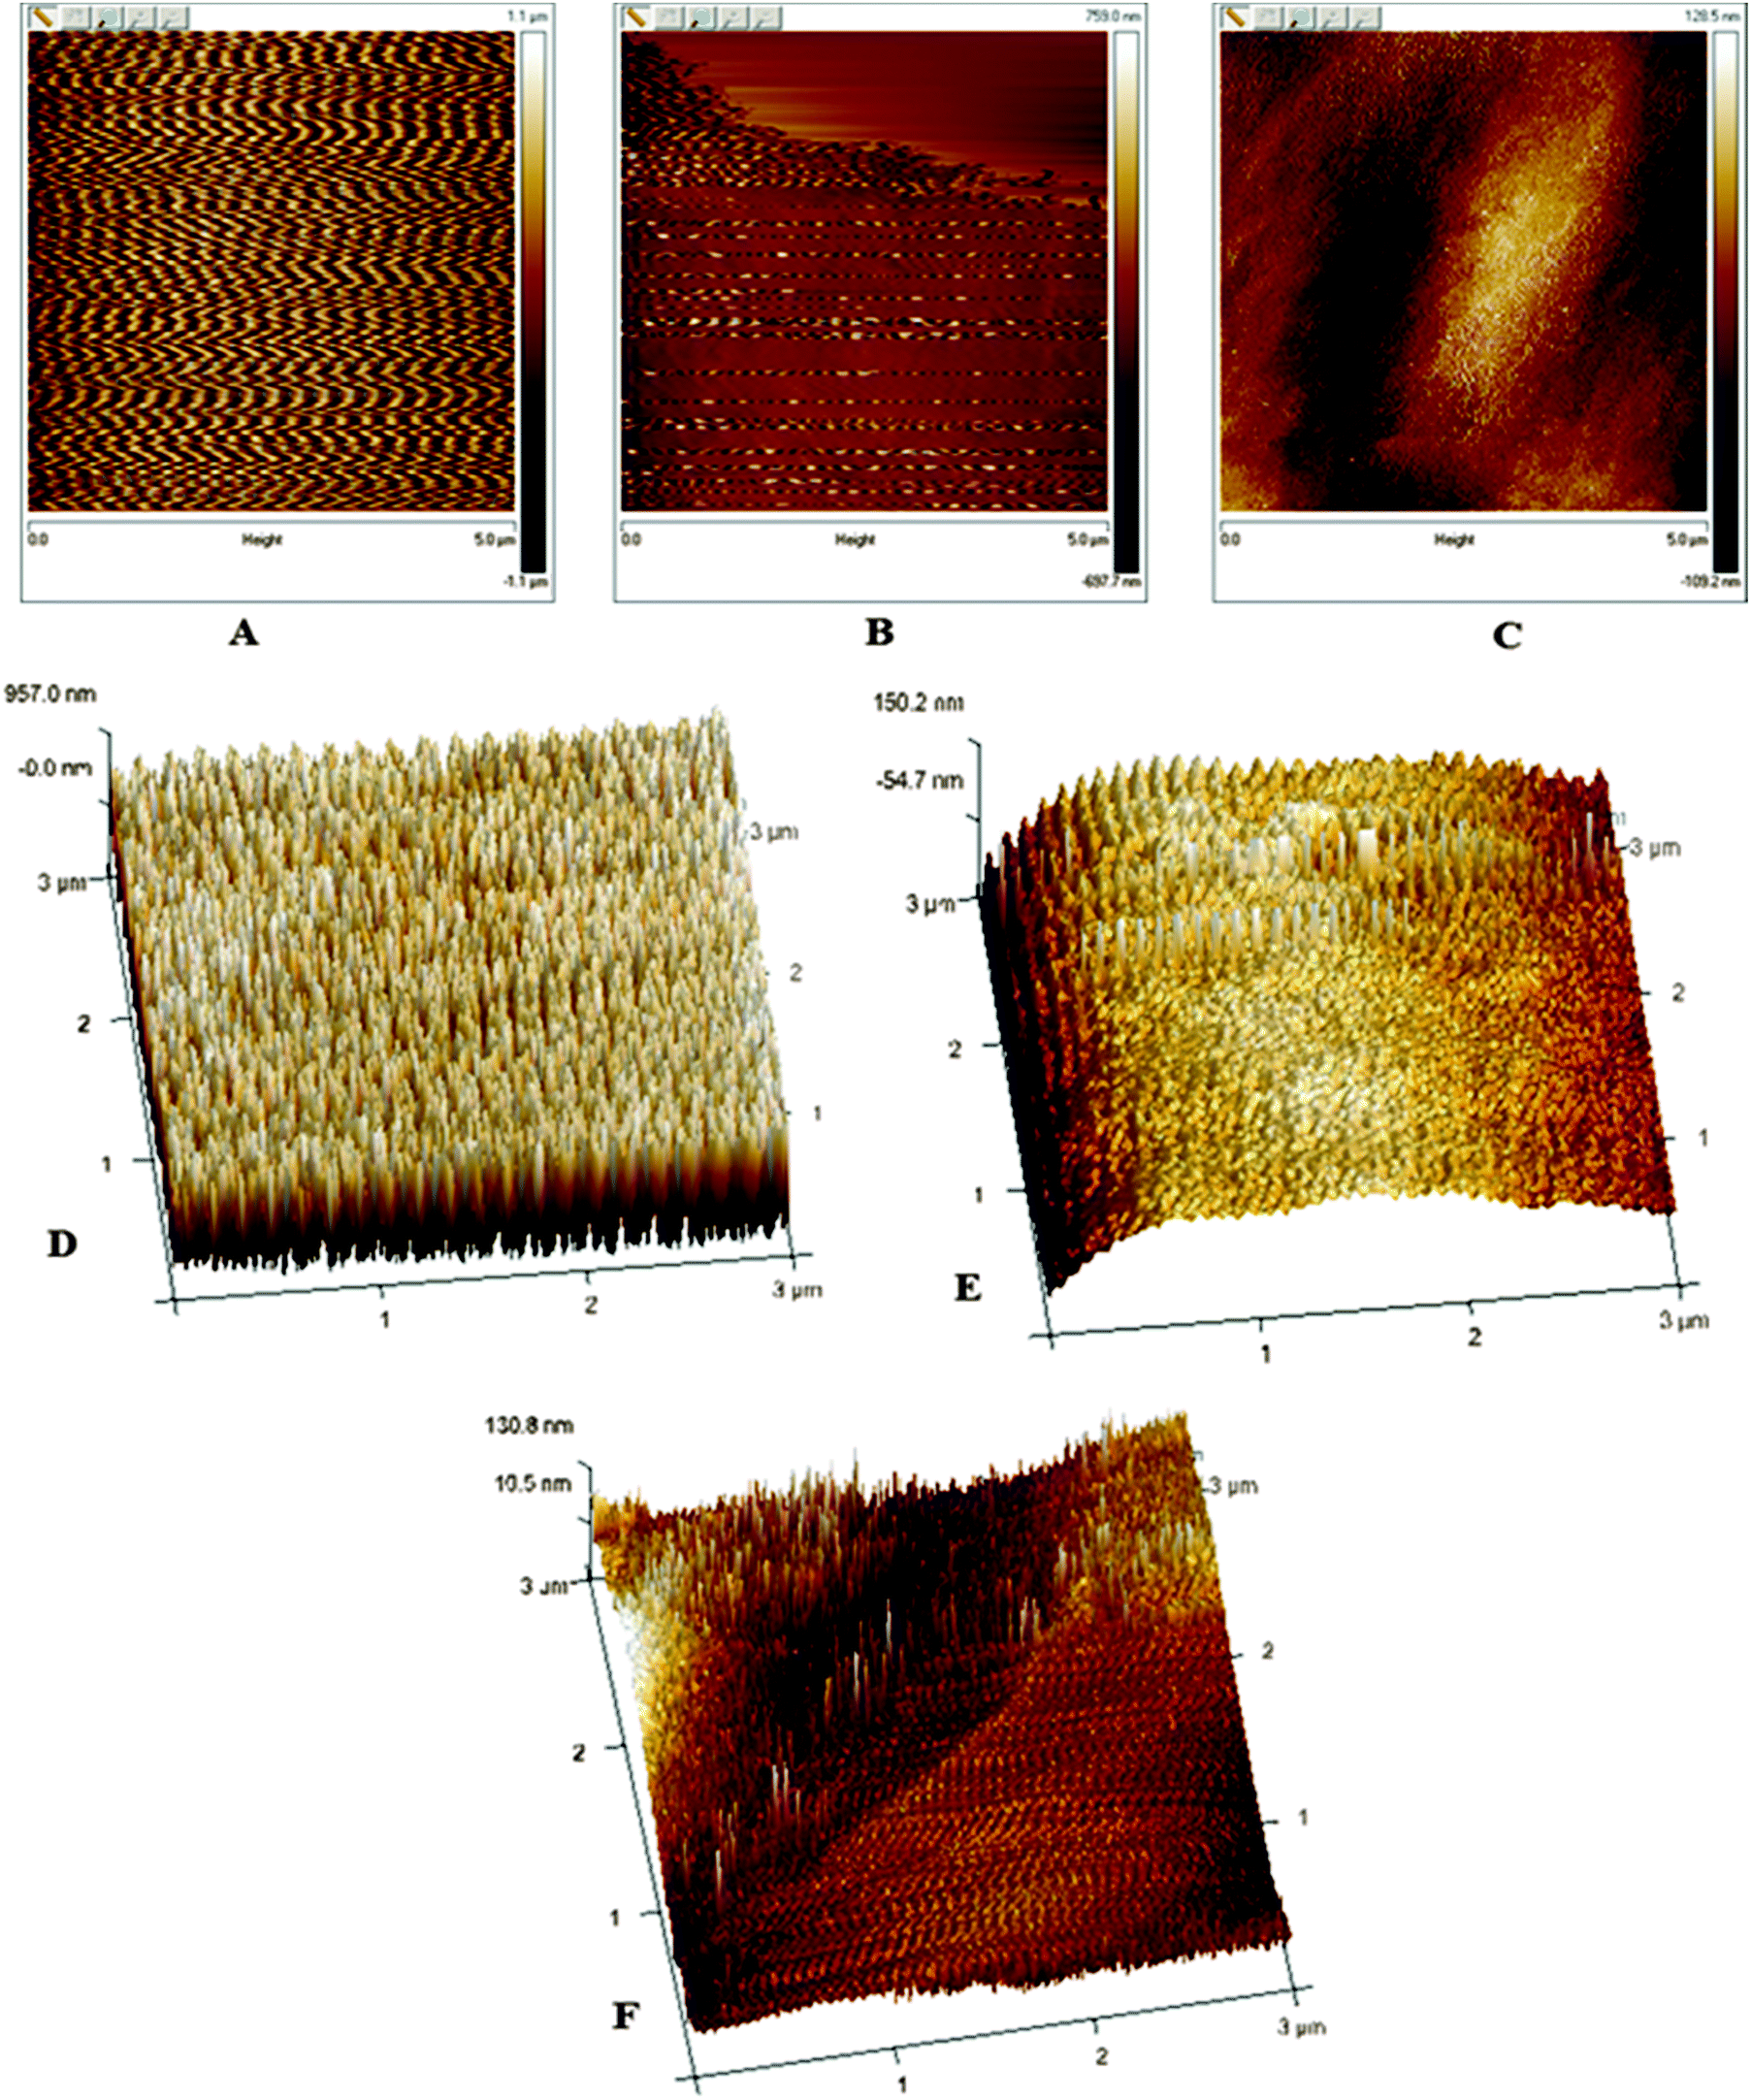 | ||
| Fig. 5 Two-dimensional scans of (A) P-0, (B) P-0.5 and (C) P-1.0 membranes and three-dimensional scans of (D) P-0, (E) P-0.5 and (F) P-1.0 membranes. | ||
| Membranes | Roughness parameters | |
|---|---|---|
| R a (nm) | R q (nm) | |
| P-0 | 334 ± 17.2 | 402 ± 29.0 |
| P-0.5 | 54.2 ± 6.9 | 67 ± 7.1 |
| P-1.0 | 41.6 ± 1.5 | 51.8 ± 4.8 |
| Membranes | Mean pore radius (nm) | Porosity (%) |
|---|---|---|
| P-0 | 8.25 | 53.36 |
| P-0.05 | 14.21 | 69.60 |
| P-0.5 | 7.02 | 76.09 |
| P-1.0 | 10.72 | 72.34 |
| P-1.5 | 8.52 | 82.60 |
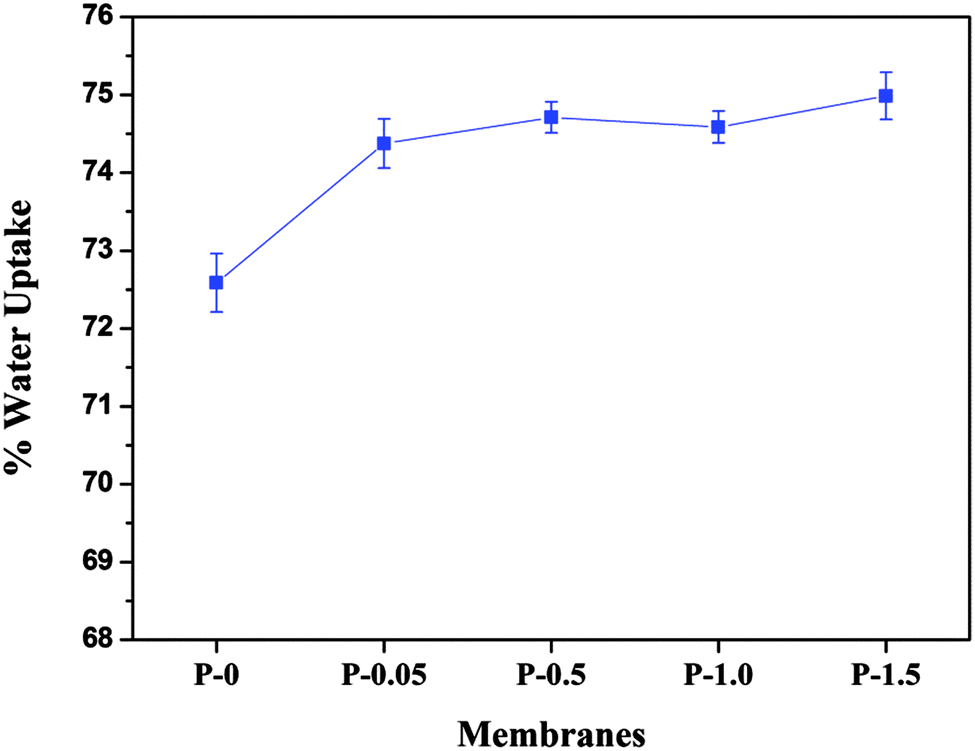 | ||
| Fig. 6 Water uptake by the membranes. | ||
 | ||
| Fig. 7 Contact angle of the membranes. | ||
 | ||
| Fig. 8 Images of contact angle measured on the membranes. | ||
 | ||
| Fig. 9 Pure water flux of the membranes. | ||
 | ||
| Fig. 10 Flux of the membranes during BSA filtration. | ||
 | ||
| Fig. 11 %FRR values of the membranes. | ||
The P-0 membrane had the least FRR value among all the membranes. The membranes showed increase in the FRR value with PANI–TiO2 content, indicating that addition of PANI–TiO2 enhance the fouling resistance of membranes. As the hydrophilicity of the membranes increased with PANI–TiO2 content, it weakened the interaction between the membrane surface and the protein molecules. Thus the adsorbed BSA molecules on the membrane surface were easily removed by simple washing resulting in a high flux recovery ratio. The P-1.5 membrane showed little decrease in FRR value. This may be due to the decrease in hydrophilicity as observed by contact angle measurement.
The AFM results further confirmed that, addition of the PANI–TiO2 nanocomposite into the membranes improved the antifouling nature of membranes. It is well known that, lower the surface roughness of the membranes, better is the antifouling ability. From Fig. 5 and Table 2 it can be seen that membrane P-0 with no PANI–TiO2 content was rough and surface roughness was reduced for P-0.5 and P-1.0 membranes. This decrease in surface roughness increased the antifouling nature of the membranes since the foulants are more likely to adsorb on course surfaces than smooth surface.28
 | ||
| Fig. 12 Heavy metal ion rejection by the membranes. | ||
 | ||
| Fig. 13 Adsorption of Pb and Cd on the membranes. | ||
4. Conclusions
The performance of the polysulfone membranes can be improved by using a PANI–TiO2 nanocomposite as a hydrophilic additive. The properties of the membranes such as hydrophilicity, permeability, water uptake, porosity, antifouling nature were enhanced with the addition of the PANI–TiO2 nanocomposite. The nanocomposite membranes also showed good rejection for Pb2+ and Cd2+ ions by the PEUF process. Taking into account the contact angle, PWF, %FRR value, it is found that the properties of the membranes improved when the addition of the PANI–TiO2 nanocomposite was increased up to 1.0 wt%. When the concentration of the PANI–TiO2 nanocomposite in the membranes was further increased to 1.5 wt%, the membranes showed slight decrease in performance. The decrease in performance by the membranes may be due to the agglomeration of the nanocomposite at higher concentration leading to clogging of pores. Thus it can be concluded that 1.0 wt% of the PANI–TiO2 nanocomposite is the threshold content for the synthesized membranes, beyond which the membranes show a decrease in performance.Acknowledgements
AMI is thankful to Prof. Swapan Bhattacharya, Director, National Institute of Technology Karnataka, Surathkal, India, for providing the research facilities. The authors thank Universiti Teknologi Malaysia for the TEM analysis. The authors also thank Prof. K. Narayan Prabhu and Prof. Rajendra Udupa of Department of Metallurgical and Materials Engineering, NITK Surathkal, India, for providing the contact angle measurement facility and SEM facility.References
- X. Yi, S. Yu, W. Shi, S. Wang, N. Sun, L. Jin and C. Ma, Desalination, 2013, 319, 38–46 CrossRef CAS PubMed.
- H. Song, Y. Jo, S.-Y. Kim, J. Lee and C. Kim, J. Membr. Sci., 2014, 466, 173–182 CrossRef CAS PubMed.
- R. Kumar, A. M. Isloor, A. F. Ismail, S. A. Rashid and T. Matsuura, RSC Adv., 2013, 3, 7855 RSC.
- J. Zhang, Y. Zhang, Y. Chen, L. Du, B. Zhang, H. Zhang, J. Liu and K. Wang, Ind. Eng. Chem. Res., 2012, 51, 3081–3090 CrossRef CAS.
- V. Moghimifar, A. Raisi and A. Aroujalian, J. Membr. Sci., 2014, 461, 69–80 CrossRef CAS PubMed.
- G. Zhang, S. Lu, L. Zhang, Q. Meng, C. Shen and J. Zhang, J. Membr. Sci., 2013, 436, 163–173 CrossRef CAS PubMed.
- H. Wu, B. Tang and P. Wu, J. Membr. Sci., 2014, 451, 94–102 CrossRef CAS PubMed.
- B. Wang, C. Liu, Y. Yin, S. Yu, K. Chen, P. Liu and B. Liang, Compos. Sci. Technol., 2013, 86, 89–100 CrossRef CAS PubMed.
- Y.-G. Han, T. Kusunose and T. Sekino, J. Ceram. Process. Res., 2009, 10, 208–211 Search PubMed.
- Y. Li, Y. Yu, L. Wu and J. Zhi, Appl. Surf. Sci., 2013, 273, 135–143 CrossRef CAS PubMed.
- S. B. Teli, S. Molina, A. Sotto, E. G. a. Calvo and J. d. Abajob, Ind. Eng. Chem. Res., 2013, 52, 9470–9479 CrossRef CAS.
- P. Daraei, S. S. Madaeni, N. Ghaemi, E. Salehi, M. A. Khadivi, R. Moradian and B. Astinchap, J. Membr. Sci., 2012, 415–416, 250–259 CrossRef CAS PubMed.
- S. Zhao, Z. Wang, X. Wei, B. Zhao, J. Wang, S. Yang and S. Wang, Ind. Eng. Chem. Res., 2012, 51, 4661–4672 CrossRef CAS.
- S. Xie, M. Gan, L. Ma, Z. Li, J. Yan, H. Yin, X. Shen, F. Xu, J. Zheng and J. Zhang, Electrochim. Acta, 2014, 120, 408–415 CrossRef CAS PubMed.
- A. Katoch, M. Burkhart, T. Hwang and S. S. Kim, Chem. Eng. J., 2012, 192, 262–268 CrossRef CAS PubMed.
- R. Kumar, A. M. Isloor, A. Ismail, S. A. Rashid and A. A. Ahmed, Desalination, 2013, 316, 76–84 CrossRef CAS PubMed.
- Z. Fan, Z. Wang, N. Sun, J. Wang and S. Wang, J. Membr. Sci., 2008, 320, 363–371 CrossRef CAS PubMed.
- X. Li, W. Chen, C. Bian, J. He, N. Xu and G. Xue, Appl. Surf. Sci., 2003, 217, 16–22 CrossRef CAS.
- B. G. Lokesh, K. S. V. K. Rao, K. M. Reddy, K. C. Rao and P. S. Rao, Desalination, 2008, 233, 166–172 CrossRef CAS PubMed.
- R. Kumar, A. Ismail, M. Kassim and A. M. Isloor, Desalination, 2013, 317, 108–115 CrossRef CAS PubMed.
- M. Padaki, A. M. Isloor, G. Belavadi and K. N. Prabhu, Ind. Eng. Chem. Res., 2011, 50, 6528–6534 CrossRef CAS.
- A. K. Nair, A. M. Isloor, R. Kumar and A. F. Ismail, Desalination, 2013, 322, 69–75 CrossRef CAS PubMed.
- F. Cheng, S. M. Sajedin, S. M. Kelly, A. F. Lee and A. Kornherr, Carbohydr. Polym., 2014, 114, 246–252 CrossRef CAS PubMed.
- V. R. Pereira, A. M. Isloor, U. K. Bhat and A. F. Ismail, Desalination, 2014, 351, 220–227 CrossRef CAS PubMed.
- S. Nasirian and H. Milani Moghaddam, Int. J. Hydrogen Energy, 2014, 39, 630–642 CrossRef CAS PubMed.
- V. Vatanpour, S. S. Madaeni, L. Rajabi, S. Zinadini and A. A. Derakhshan, J. Membr. Sci., 2012, 401–402, 132–143 CrossRef CAS PubMed.
- S. Zhao, Z. Wang, X. Wei, B. Zhao, J. Wang, S. Yang and S. Wang, J. Membr. Sci., 2011, 385–386, 251–262 CrossRef CAS PubMed.
- A. Razmjou, J. Mansouri and V. Chen, J. Membr. Sci., 2011, 378, 73–84 CrossRef CAS PubMed.
- A. Eisazadeh, H. Eisazadeh and K. A. Kassim, Synth. Met., 2013, 171, 56–61 CrossRef CAS PubMed.
- M. Min, L. Shen, G. Hong, M. Zhu, Y. Zhang, X. Wang, Y. Chen and B. S. Hsiao, Chem. Eng. J., 2012, 197, 88–100 CrossRef CAS PubMed.
| This journal is © The Royal Society of Chemistry and the Centre National de la Recherche Scientifique 2015 |