Solvothermal synthesis of MnFe2O4 colloidal nanocrystal assemblies and their magnetic and electrocatalytic properties†
Zhen
Li
ab,
Kai
Gao
a,
Guangting
Han
a,
Rongyue
Wang
ab,
Hongliang
Li
*ab,
X. S.
Zhao
abc and
Peizhi
Guo
*ab
aState Key Laboratory Breeding Base of New Fiber Materials and Modern Textile, Collaborative Innovation Center for Marine Biomass Fibers, Materials and Textiles of Shandong Province, Qingdao University, Qingdao, 266071, P. R. China. E-mail: pzguo@qdu.edu.cn; guopz77@yahoo.com; lhl@qdu.edu.cn; Fax: +86 532 85955529; Tel: +86 532 85951290
bSchool of Chemical Science and Engineering, Qingdao University, Qingdao, 266071, P. R. China
cSchool of Chemical Engineering, The University of Queensland, St. Lucia, QLD 4072, Australia
First published on 22nd October 2014
Abstract
Submicrometer MnFe2O4 colloidal nanocrystal assemblies (CNAs) have been synthesized controllably by using a solvothermal method through simply adjusting synthetic reagents. The size and microstructure of MnFe2O4 CNAs were characterized by X-ray diffraction (XRD), scanning electron microscopy (SEM) and transmission electron microscopy (TEM). Results showed that MnFe2O4 CNAs were well-separated and uniform with the size scales ranging from 230 nm to 950 nm, which were composed of primary crystalline nanoparticles with the sizes ranging from 16 nm to 43 nm. Room-temperature magnetic measurement results showed that MnFe2O4 CNAs were weakly ferromagnetic with small remnant saturation and coercivity values. The magnetization saturation values of CNAs were increased with the increase of the size of primary nanoparticles. Electrochemical measurements showed that the size of primary nanoparticles of MnFe2O4 CNAs had an important effect on the electrochemical reduction of H2O2. However, the electrocatalytic activity of MnFe2O4 CNAs for oxygen reduction reaction closely correlated with both the crystal size and self-assembly of primary nanoparticles. Based on the experimental results, the formation mechanisms of MnFe2O4 CNAs as well as the relationship between their structures and properties have been analyzed and discussed.
Introduction
Recently, spinel ferrite nanostructures have attracted great interest in many important fields due to their excellent properties such as magnetic, photoelectrochemical behaviour, catalytic and biomedical performances.1–8 It is proved that the morphology and assembly of spinel ferrite nanoparticles have strong effects on their physicochemical properties, which are different from the corresponding bulk materials.9,10 So far, various ferrite nanostructures have been synthesized including nanocrystals, nanorods/nanotubes, core–shell nanoparticles, spheres and colloidal nanocrystal clusters.8–14 The construction of synthetic methodologies and systems plays a key role in synthesizing targeted nanomaterials, which not only helps in the fabrication of specific nanostructures but also gives the chance to adjust the size and structures of nanomaterials.11–14 Many synthetic techniques have been developed and used to synthesize nanostructured materials, which include the sol–gel process, microemulsion, hydrothermal/solvothermal methods, coprecipitation methods, and so on.15–28Solvothermal synthesis has been one of the most important methods for the synthesis of nanomaterials with controlled morphology, high yield and purity in recent years.11,20,26 These should be attributed to the existence of adjustable experimental parameters in the solvothermal synthetic technique, such as abundant reagents and solvents as well as reaction time and temperature. For example, superparamagnetic nanotubes were prepared based on the Kirkendall effect and can be used for magnetic resonance contrast agents with enhanced signals.29 Length-tunable magnetite nanorods were obtained through a solvothermal route by varying the synthetic time or content of hexadecylamine.30
Recently, great progress has been made in the assembly of inorganic nanoparticles formed by the in situ synthetic approaches or ex situ ordered assembly of the tiny nanocrystals.14,31–33 For example, monodispersed supraparticles were formed by the self-limiting assembly of polydisperse nanoparticles caused by the interaction balance between the electrostatic repulsion and van der Waals attraction.31 The synthesis of copper sulfide nanoparticles as well as their in situ assembly with controlled morphologies was realized simultaneously by a simple hydrothermal process.32 It is also found that colloidal nanocrystal assemblies (CNAs), which are formed by the self-assembly of primary nanoparticles in highly preferred orientations, can display unique properties compared with those of primary nanoparticles or the particles with the size similar to that of CNAs.8,10 For instance, submicrometer CNAs of magnetite and ferrite showed superparamagnetic behavior with high saturation magnetization (Ms) values due to the ordered assembly of primary nanoparticles.14,33 However, it is still a great challenge to synthesize large suprastructures based on the in situ assembly of nanoparticles.
In this paper, MnFe2O4 CNAs with the sizes ranging from 230 nm to 950 nm have been synthesized by using a facile solvothermal method, which were formed by the assembly of primary nanoparticles with the size of 16 nm to 43 nm. It was found that all the MnFe2O4 CNAs were ferromagnetic with a very small hysteresis loop. The Ms values of the CNAs were correlated positively with the crystal size of primary nanoparticles. Electrochemical data showed that the crystal size and self-assembly of primary nanoparticles within CNAs played important roles in determining the electrochemical performances both in the electroreduction of hydrogen peroxide and oxygen reduction reaction.
Results and discussion
Crystal structure
Fig. 1 shows the powder X-ray diffraction (XRD) patterns of the products obtained at the synthetic temperature of 200 °C for 12 h. The products were named MnFe-Na10, MnFe-Na20, MnFe-Ac20 and MnFe-Ac30, where Na and Ac respectively represented the synthetic systems containing HCOONa and CH3COONH4 and numbers denoted the concentration (mM) of HCOONa or CH3COONH4. It can be seen from Fig. 1 that distinct diffraction peaks were obtained, which can be well indexed to the cubic spinel structure of MnFe2O4 (JCPDS No. 10-0319). The peaks observed at 2θ degrees of 30.2, 35.5, 43.1, 53.6, 57.0 and 62.6 respectively corresponded to the (220), (311), (400), (422), (511) and (440) planes of the cubic spinel MnFe2O4. It can also be observed that the shape of the diffraction peaks, taking the (311) peak as an example, was gradually sharper and narrower from sample MnFe-Na20 to MnFe-Na10, MnFe-Ac20 and MnFe-Ac30, indicating that the crystal size of these samples obeys the order of MnFe-Na20 < MnFe-Na10 < MnFe-Ac20 < MnFe-Ac30. These can be confirmed by the calculation according to the Scherrer equation based on the measurements of the full width at half-maximum (fwhm) of the (311) peaks. The calculated grain sizes of MnFe-Na10, MnFe-Na20, MnFe-Ac20 and MnFe-Ac30 were about 23, 16, 40 and 43 nm, respectively.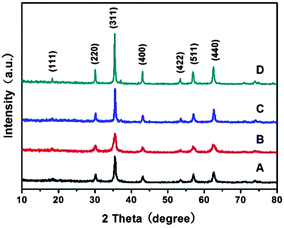 | ||
| Fig. 1 XRD patterns of MnFe2O4 samples: (A) MnFe-Na10, (B) MnFe-Na20, (C) MnFe-Ac20 and (D) MnFe-Ac30. | ||
Morphology and microstructure
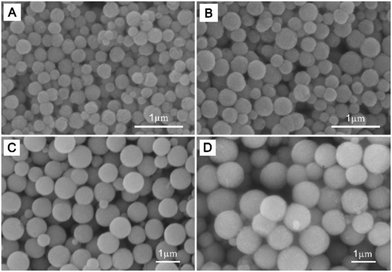
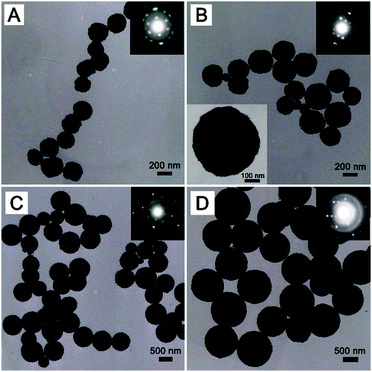
The morphology of MnFe2O4 samples was investigated by SEM measurements. It was seen from Fig. 2 that all of the samples exhibited a spherical shape with well-separated structures. Obviously, the sizes of these MnFe2O4 CNAs were increased greatly by adding ammonium acetate into the synthetic systems instead of sodium formate. The average sizes were about 230, 400, 800 and 950 nm for MnFe-Na10, MnFe-Na20, MnFe-Ac20 and MnFe-Ac30, respectively. Namely, increasing the concentration of sodium formate from 0.01 M to 0.02 M led to the increase of about 70% in the size of the spheres (Fig. 2A and B). In contrast, the size was slightly increased (∼20%) with the concentration of ammonium acetate increasing from 0.02 M to 0.03 M (Fig. 2C and D). The morphology of these spheres was similar to our recent results on the CNAs of MnFe2O4 and ZnFe2O4 with a smaller size than that in the present study.8,11 It was obvious that these MnFe2O4 CNAs were formed from the assembly of large nanocrystals compared with those reported in the literature.8,11,14Fig. 3 shows the TEM images of all the MnFe2O4 CNAs. Clearly, submicrometer spherical structures were indeed formed for all the samples. As depicted in Fig. 3A, MnFe-Na10 had a size of about 230 ± 20 nm similar to that derived from the corresponding SEM image (Fig. 2A). Most of sample MnFe-Na20 had the mean dimension increased to about 420 ± 40 nm (Fig. 2B). It can be concluded from Fig. 3C and D that the sizes of samples MnFe-Ac20 and MnFe-Ac30 were respectively about 800 ± 50 nm and 950 ± 60 nm and much larger than those from the system containing sodium formate, which were in good agreement with the SEM results (Fig. 2C and D). The crystalline nature of MnFe2O4 CNAs can be roughly deduced by the selected area electron diffraction (SAED) patterns of the samples. As shown in the inset in Fig. 3A, the SAED pattern of a single MnFe-Na10 CNA showed bright arc-like diffraction spots with a circular shape, not a typical pattern of a single crystal, which was similar to those of the CNAs of manganese ferrite and magnetite.8,14 These indicated that sample MnFe-Na10 was formed by the ordered assembly of primary nanoparticles with the size of about 23 nm in a slightly misaligned manner combined with the corresponding XRD results (Fig. 1A).8,14 Similar results can also be derived for sample MnFe-Na20 although its dimension increased to more than 400 nm based on the SAED and XRD data (Fig. 3B and 1B). Furthermore, the surface of these ferrite CNAs was found to be embraced by MnFe2O4 nanoparticles, as shown in the enlarged TEM image, as shown in the inset in Fig. 3B. It is also found that the size of MnFe2O4 CNAs can be slightly affected by changing the sodium formate concentration (Fig. S1 and S2, ESI†).
If the synthetic system contained ammonium acetate, the as-made manganese ferrite CNAs were obviously larger than those collected from the sodium formate systems. On the one hand, compared with the results from Fig. 3B and D, the surface of the CNAs seemed to be more smooth than that of sample MnFe-Ac30 due to the visual observation although both samples were composed of small crystalline nanoparticles. On the other hand, the used electron beam in the TEM measurements can hardly penetrate the large solid CNAs and thus the corresponding SAED pattern was difficult to get a wholly typical diffraction pattern. However, it can still be observed from the SAED patterns of MnFe-Ac20 and MnFe-Ac30 (the insets in Fig. 3C and D) that small bright spots can be obtained, denoting the existence of highly crystalline nanoparticles. These indicated that the microstructures were slightly different for those MnFe2O4 CNAs obtained from the synthetic systems containing sodium formate and ammonium acetate. It is suggested that the spherical assembly structures were formed due to the highly preferred orientations of primary nanoparticles for all the samples.14 Furthermore, the large difference in the size of CNAs obtained from these two systems should be ascribed to the differences in the structure and coordination ability of formate and acetate ions.14,33 However, primary nanoparticles in the CNAs collected from ammonium acetate systems may have more misaligned attachment than those from sodium formate systems because the sizes of the former nanoparticles were much larger than the latter ones.
Evolution of the intermediates
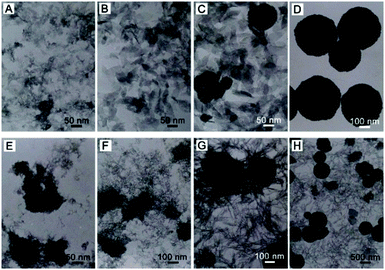
In order to understand the formation process of these MnFe2O4 CNAs, intermediate products were selectively collected through controlling the synthetic time from these two starting systems. The morphology and phase of the intermediates were characterized by TEM (Fig. 4) and XRD (Fig. S3, ESI†) measurements. The color change of the intermediate products obtained from these two systems was rather different and can be observed clearly by the naked eye. For the sodium formate system, the collected intermediate was brown when the reaction time was less than 2 h. With the synthetic time extended to 4 h, burgundy products were obtained and can be tempted by block magnets. However, the color changed from brown for the intermediate obtained at the first 4 h to black with the reaction time extended further for the ammonium acetate system. The color change can also be reflected by the XRD patterns (Fig. S3, ESI†).As depicted in Fig. 4A, flocculent products with no specific shape were obtained when the reaction time was 1 h. With the synthetic time up to 2 h, the ferric oxide phase was formed (Fig. S3, ESI†) and spindle-like or sheet-like structures were formed with an obvious tendency to agglomerate (Fig. 4C). Two diffraction peaks at 2θ degrees of about 30 and 36 can be observed for the intermediate collected after 3 h reaction (Fig. S3, ESI†), corresponding to the (220) and (311) planes of cubic spinel MnFe2O4, respectively. This indicated that the phase transformation occurred from the ferric oxide to manganese ferrite phase during the continuously synthetic process, which was in good agreement with our previous results about the synthesis of similar structures of manganese ferrite and zinc ferrite.8,11 Accordingly, submicrometer spherical structures in addition to spindle structures were observed in the corresponding TEM image (Fig. 4C). Pure manganese ferrite phase was gained when the synthetic time was further extended to 4 h and only spherical microstructures were obtained (Fig. 4D). Furthermore, the size of CNAs can be well controlled by adjusting the concentration of sodium formate in the solutions (Fig. S1 and S2, ESI†).
For the ammonium acetate system, the formation process of manganese ferrite CNAs was somewhat different from that of the sodium formate system. As depicted in Fig. 4E and F, thin wire nanostructures as well as loose aggregates with the size larger than 100 nm were formed when the synthetic time was no more than 2 h. If the reaction time was prolonged to 4 h, three types of nanostructures can be observed as shown in Fig. 4G, namely distinct spheres with the size less than 200 nm, aggregates rounded by nanowires (the possible precursors of spherical structures) and nanowires. With the reaction further elongated to 6 h, large spheres with the sizes of about 500 nm and nanowires were also observed (Fig. 4H). In the meantime, thin structures with the size of about 400–600 nm can also be obtained. It is proposed that the growth of submicrometer spheres or thin structures should be attributed to the expense of slim nanowires based on Ostwald ripening, in which the tendency to reduce the high surface energy of small particles through preferred orientations as well as electrostatic interactions should play key roles in the formation of manganese ferrite nanoparticle clusters. Finally, submicrometer uniform CNAs were formed when the reaction time was 12 h. On the basis of these experimental data, the formation mechanisms of the CNAs were proposed to be similar for the synthetic systems containing sodium formate or ammonium acetate, as schematically illustrated in Scheme 1.
Magnetic characterization
Magnetic properties of MnFe2O4 CNAs were performed at room temperature (Fig. 5), and the strength of the magnetic field was H = 1.4 × 10⁴ Oe. Clearly, the hysteresis loop cannot be clearly observed at the full scale in the magnetization curves of the samples (Fig. 5A). In a partial enlarged view (Fig. 5B), magnetization curves of MnFe2O4 CNAs show a relatively small hysteresis loop, indicating that these spheres displayed a ferromagnetic behavior. The saturation magnetization (Ms) values of MnFe-Na10 and MnFe-Na20 were 61.6 and 60.0 emu g−1 with the sizes of primary nanoparticles of 23 and 16 nm, respectively. The remnant saturation (Mr) and coercivity (Hc) values of MnFe-Na20 were rather small, indicating that the superparamagnetic–ferromagnetic transformation was nearly observed similar to that of separated ferrite nanoparticles. However, the Ms value of MnFe-Na20 was slightly lower than that of manganese ferrite CNAs composed of primary nanoparticles with the size of about 10 nm.11 This may denote that the formation of superparamagnetic CNAs should be determined by the nature of primary nanoparticles. It is suggested that the variation of the cationic distribution between octahedral and tetrahedral sites in CNAs should also contribute to the unique magnetic behaviour of MnFe-20 at room temperature.34,35 However, large nanoparticles would hinder the preferred attachments among the particles, which was in accord with the TEM observations of samples MnFe-Ac20 and MnFe-Ac30 (Fig. 3C and D).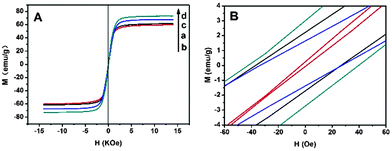 | ||
| Fig. 5 Magnetization hysteresis (A) of MnFe-Na10 (a), MnFe-Na20 (b), MnFe-Ac20 (c) and MnFe-Ac30 (d), and (B) the partially magnified graph of A. | ||
It can also be derived from Fig. 5A that the Ms values were 67.6 and 73.1 emu g−1 for MnFe-Ac20 and MnFe-Ac30, respectively. Namely, the Ms values were gradually increased with the order of MnFe-Na20 < MnFe-Na10 < MnFe-Ac20 < MnFe-Ac30, which was consistent with the crystal size of their primary nanoparticles.36–40 The decrease of the grain size led to superparamagnetic–ferromagnetic transformation, which not only made the saturation magnetization to decrease, but also further decreased ferromagnetism.16 Typically, when the nanocrystal size decreases, the increasing proportion of atoms on the surface results in surface effects, which play an important role in determining the saturation magnetization of the sample. Thereafter, the Ms values of all the samples were lower than the reported bulk value of 110 emu g−1 for MnFe2O4, which were indeed influenced by many factors, such as the particle size, surface effect and crystalline nature.41–43
Electrochemical sensing performance
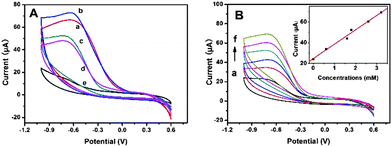
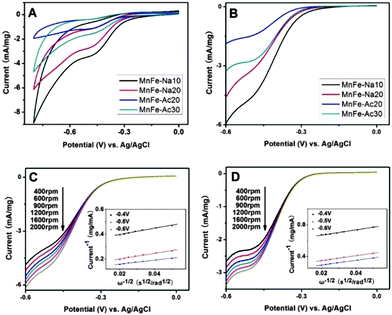
In order to investigate the effect of the particle size of MnFe2O4 CNAs on their electrocatalytic properties, the CNAs were used to the electroreduction of H2O2 in physiological systems (Fig. 6).11,41Fig. 6A shows the cyclic voltammograms (CVs) of the MnFe2O4-modified glass carbon electrodes (GCEs) in aqueous phosphate buffer solutions (PBS, pH 7.4) containing H2O2 with the concentration of 1.8 mM, which showed typical features of the electrochemical reduction of H2O2 compared with the CV curve in the electrolyte without hydrogen peroxide. It was noticeable that the peak currents and on-set potentials were gradually changed with the crystal size of primary nanoparticles. The on-set potentials were about 0.06, 0.10, −0.12 and −0.13 V for the GCEs modified with MnFe-Na10, MnFe-Na20, MnFe-Ac20, and MnFe-Ac30, respectively. It was clear that the peak currents of the CNAs from sodium formate systems were obviously higher than those of the CNAs from ammonium acetate systems. Furthermore, the order of the peak currents and potentials of the samples obey the same order as that derived from the results of on-set potentials. Namely, the electrochemical activity of the CNAs toward the reduction of H2O2 should be determined by the size of primary nanoparticles, not the size of the CNAs. As shown in Fig. 6B, the peak current intensities of the CNAs increased with increasing H2O2 concentration. Clearly, the electrochemical sensor presented a linear response to H2O2 concentration in the experimental range, with the correlation coefficient of r = 0.990 for MnFe-Ac20. It can also be concluded from Fig. 6 that the peak potentials of the CNAs were closer to zero than those of hematite structures,44 indicating the improvement of the electrocatalytic performances for MnFe2O4 samples. Furthermore, these GCEs can be reused for the electroreduction of H2O2. It was suggested that smaller nanoparticles had a higher specific surface area than larger nanoparticles and thus there were more active sites exposed.45Oxygen reduction reaction activity
An efficient oxygen reduction reaction (ORR) can help to develop fuel cells and metal–air batteries under mild conditions. Recently, the exploration of the electrocatalysts for ORR with low cost and acceptable catalytic activity has received increasing interest and made great progress.46,47 The CVs of the MnFe2O4-modified glass carbon rotating disk electrodes (GCRDEs) in aqueous O2-saturated 0.1 M KOH solutions at room temperature were depicted in Fig. 7A with the scan rate of 50 mV s−1, which clearly showed ORR peaks for all the modified electrodes. Interestingly, the onset reduction potentials for MnFe2O4 CNAs were gradually shifted positively in the order of MnFe-Ac20, MnFe-Ac30, MnFe-Na20 and MnFe-Na10. In the meantime, the peak potentials of our MnFe2O4 samples also obey the former mentioned order. The weak peak potentials were observed at −0.48 V for all the MnFe2O4 CNAs. The ORR kinetics of the MnFe2O4 CNAs was investigated and Fig. 7B depicted the ORR polarization curves of the MnFe2O4 CNAs in O2-saturated 0.1 M KOH solution at a scan rate of 10 mV s−1 using a rotating disk electrode (RDE) at 1600 rpm. It was observed that MnFe-Na10, MnFe-Na20, MnFe-Ac20 and MnFe-Ac30 have the half-wave potentials at −0.378 V, −0.386 V, −0.407 V and −0.392 V, respectively.Based on these above observations, it can be concluded that the crystal size of primary nanoparticles, not the size of MnFe2O4 CNAs, and self-assembly of MnFe2O4 nanoparticles played important roles in determining the ORR activity of these MnFe2O4 CNAs.48,49 It is noticeable that the onset reduction potential was shifted to a positive value with the decrease of crystallinity except for sample MnFe-Na20. This should be ascribed to the assembly nature of sample MnFe-Na20, which was formed by the in situ self-assembly of the smallest primary nanoparticles among the four MnFe2O4 CNAs. Namely, MnFe2O4 CNAs are apt to display the features of individual primary nanoparticles when primary nanoparticles are large, which can be verified by the results of the corresponding SAED patterns and magnetic measurements. These deductions can be further confirmed by the combined results of the peak potentials, half-wave potentials and catalytic current densities of these MnFe2O4 CNAs.
ORR polarization curves of MnFe-Na10 and MnFe-Ac30 at different rotation speeds were respectively given in Fig. 7C and D, which could also be used to qualitatively analyze the catalytic activity of the ORR. With the rotation speeds increasing, the current density increases smoothly, which may be caused by the fast oxygen flux to the electrode surface. As depicted in the insets in Fig. 7C and D, the linearity of the Koutecky–Levich plots and near parallelism of the fitting lines indicated the first order reaction kinetics toward oxygen gas on MnFe-Na10 and MnFe-Ac30 within the potential window ranging from −0.4 V to −0.6 V. The downward slope in the potential window of 0 to −0.18 V in Fig. 7C should be associated with the valent change of manganese.44 The electron transfer number was calculated to be ∼3.44, ∼4.26, ∼1.49 and ∼3.21 for MnFe-Ac20, MnFe-Ac30, MnFe-Na20 and MnFe-Na10, respectively, demonstrating the existence of a 4e-oxygen reduction process for MnFe-Ac20 and MnFe-Ac30 formed from large primary nanoparticles. However, the ORR kinetics of the CNAs from small primary nanoparticles was rather different, which should be ascribed to the assembly nature of MnFe-Na20 and MnFe-Na10. Furthermore, the smaller the primary nanoparticles were, the greater the influences on the ORR activities of MnFe2O4 CNAs.
Discussion
Based on the above experimental results, it can be concluded that the crystal size and self-assembly of primary nanoparticles in MnFe2O4 CNAs play important roles in determining their structures, magnetic and electrocatalytic properties.8,14 On the one hand, the formation of submicrometer nanocrystal clusters is suggested to be caused by the synergic effects to reduce the surface energy of the CNAs through the highly preferred orientation of primary nanoparticles.11,14 The interactions among primary nanoparticles would lead to the change in the structure because the SAED pattern of a single CNA is different from separated small or large nanoparticles with single crystalline nature. In this work, however, it is proposed that the strength of the interactions among primary nanoparticles depends on their sizes. Namely, the SAED pattern of the CNAs composed of large primary nanoparticles is more like separated single crystalline nanoparticles. In this regard, the critical crystal size of primary nanoparticles should be less than 16 nm for the formation of those CNAs with the SAED patterns composed of bright arc spots.On the other hand, the physicochemical properties of the CNAs are closely related to their structural features. For magnetic primary nanoparticles with a small size, the as-formed CNAs usually show superparamagnetic behavior with large Ms values due to the preferred assembly nature of primary nanoparticles. While for the large primary nanoparticles, the as-made CNAs are apt to display ferromagnetic properties with Mr and Hc values similar to those of large nanoparticles. However, the electrocatalytic performance of the CNAs depends on the crystal size of the corresponding nanoparticles. In the meantime, the size of targeted molecules in the electrolytes could also affect the electrocatalytic activity of the CNAs.8,33 It is obvious that the assembly of small nanoparticles could hinder the electrocatalysis of large molecules, such as uric acid and ascorbic acid.33 These deductions can also be confirmed by the electrocatalysis for ORR. It is interesting to note that even large nanoparticles with the sizes larger than 40 nm can also form the submicrometer CNAs through a one-step solvothermal synthetic method in an in situ manner. Thereafter, the interfacial regulation of primary nanoparticles in CNAs should be closely related to their shape and size, which are responsible for the enhancement or regulation of physicochemical properties of the CNAs compared with those nanoparticle components. These can also be confirmed by the nitrogen adsorption–desorption measurements (Fig. S4, ESI†) with the Brunauer–Emmett–Teller (BET) specific surface areas of 60.2, 48.8, 10.8 and 4.14 m2 g−1 for MnFe-Na10, MnFe-Na20, MnFe-Ac20 and MnFe-Ac30, respectively.
Conclusions
MnFe2O4 colloidal nanocrystal assemblies (CNAs) with the sizes ranging from 230 nm to 950 nm have been synthesized controllably by a solvothermal synthetic method. Experimental data show that these MnFe2O4 CNAs are formed from the in situ self-assembly of small primary nanoparticles. It is found that the size of MnFe2O4 CNAs and primary nanoparticles can be adjusted by changing the starting reagents. Experimental results show that the CNAs formed by smaller primary nanoparticles display typical features of the ordered nanoparticle assembly, which have unique SAED patterns and magnetic and electrocatalytic properties. Increasing the size of primary nanoparticles, the saturation magnetization values of the CNAs are increased gradually. Furthermore, MnFe2O4 CNAs from the assembly of large nanoparticles show electrochemical catalytic properties toward the reduction of hydrogen peroxide and oxygen reduction reaction similar to those separated nanoparticles. These results presented in this paper should be helpful to the controlled synthesis of inorganic ordered assembly by rational design of the synthetic systems.Experimental
Materials
All chemicals, including FeCl3·6H2O, Mn(CH3COO)2·4H2O, HCOONa·2H2O, MnCl2·4H2O, CH3COONH4, ethylene glycol (EG), ethanol and hydrogen peroxide (30%) were of analytical grade (Sinopharm Chemical Reagent Co.) and used as received. Double distilled water was used except ultrapure water (18.2 MΩ cm) for electrochemical measurements.Synthesis of MnFe2O4 colloidal nanocrystal assemblies
In a typical synthesis, FeCl3·6H2O and Mn(CH3COO)2·4H2O or MnCl2·4H2O in a stoichiometric ratio of 2![[thin space (1/6-em)]](https://www.rsc.org/images/entities/char_2009.gif) :
:![[thin space (1/6-em)]](https://www.rsc.org/images/entities/char_2009.gif) 1 were dissolved in 30 mL of ethylene glycol solution under magnetic stirring at room temperature. Different dosages of HCOONa·2H2O or CH3COONH4 were added to the solution when the solution became clear, while stirring was maintained. The obtained homogeneous mixture was transferred into a 40 mL Teflon-lined stainless autoclave. And then the autoclave was sealed and heated at 200 °C for 12 h in an oven.8,11 Subsequently, the autoclave was left to cool down to room temperature. Solid products were collected by centrifugation, washed separately with distilled water and ethanol for several times, and then dried in an oven at 60 °C for 8 h. The final yields of MnFe-Na10, MnFe-Na20, MnFe-Ac20 and MnFe-Ac30 were 51.3%, 52.2%, 47.1%, and 46.3%, respectively.
1 were dissolved in 30 mL of ethylene glycol solution under magnetic stirring at room temperature. Different dosages of HCOONa·2H2O or CH3COONH4 were added to the solution when the solution became clear, while stirring was maintained. The obtained homogeneous mixture was transferred into a 40 mL Teflon-lined stainless autoclave. And then the autoclave was sealed and heated at 200 °C for 12 h in an oven.8,11 Subsequently, the autoclave was left to cool down to room temperature. Solid products were collected by centrifugation, washed separately with distilled water and ethanol for several times, and then dried in an oven at 60 °C for 8 h. The final yields of MnFe-Na10, MnFe-Na20, MnFe-Ac20 and MnFe-Ac30 were 51.3%, 52.2%, 47.1%, and 46.3%, respectively.
Characterization
The XRD patterns of samples were measured on an X-ray diffractometer (Bruker D8) equipped with CuKα radiation (λ = 0.15418 nm). The SEM images of samples were examined on a scanning electron microscope (JSM-6390LV) with an operating voltage of 20 kV. TEM images of the samples were recorded on a transmission electron microscope (JEM-2000EX) with an operating voltage of 160 kV. Magnetic measurements of the samples were obtained using a vibrating sample magnetometer (VSM, LDJ9500) at room temperature. The specific surface areas were estimated by the BET method and by N2 adsorption data in the relative pressure range of P/P0 = 0.05–0.35 using a TriStar 3000 surface area and pore analyzer (Micromeritics).Electrochemical sensing measurements
The electrochemical sensing measurements of MnFe2O4 CNAs were performed on an electrochemical workstation (CHI760E) with a three-electrode cell at room temperature. A saturated calomel electrode was used as the reference electrode and a platinum plate electrode as the counter electrode. The buffer solution was aqueous phosphate PBS (0.1 M, pH 7.4). The working electrodes were a bare glass carbon electrode (GCE) with a diameter of 3 mm and MnFe2O4-modified GCEs. MnFe2O4 suspension (1 mg mL−1) was ultrasonicated for 30 min, and then 10 μL of suspension was uniformly dropped onto the surface of the GCE. Before being used, the modified electrode obtained above was dried under temperate conditions. In the experiments, to adjust the targeted concentration of H2O2 in the electrolytes, H2O2 solutions (30%) with different amounts were injected into the phosphate buffer solution.Electrochemical measurements for ORR were conducted by using a three-electrode cell at room temperature on a CHI700E electrochemical workstation. A rotating disk electrode (RDE) coated with the MnFe2O4 catalyst was used as the working electrode. An Ag/AgCl electrode and a platinum wire were used respectively as the reference electrode and the counter electrode in aqueous 0.1 M KOH solutions. The linear sweep voltammetry for ORR was obtained in the potential range −0.8 V to 0 V at a scan rate of 50 mV s−1 with a RDE at different rotate speeds in O2-saturated 0.1 M KOH aqueous solution. The slopes of the Koutecky–Levich plots were used to calculate the electron transfer number (n) according to:
Acknowledgements
This work was financially supported by the National Key Project on Basic Research (Grant No. 2012CB722705), the National High Technology Research and Development Program of China (2012AA110407), the National Natural Science Foundation of China (No. 21143006 and U1232104), and the Foundation of “Taishan Scholar” program of Shandong Province, China.Notes and references
- J. H. Lee, J. T. Jang, J. S. Choi, S. H. Moon, S. H. Noh, J. W. Kim and J. Cheon, Nat. Nanotechnol., 2011, 6, 418 CrossRef CAS PubMed.
- B. R. Hao, R. J. Xing, Z. C. Xu, Y. L. Hou, S. Gao and S. H. Sun, Adv. Mater., 2010, 22, 2729 CrossRef PubMed.
- S. Mohapatra, S. R. Rout, S. Maiti, T. K. Maiti and A. B. Panda, J. Mater. Chem., 2011, 21, 9185 RSC.
- D. K. Pan, H. Zhang, T. Fan, J. G. Chen and X. Duan, Chem. Commun., 2011, 47, 908 RSC.
- F. P. Gao, Y. Y. Cai, J. Zhou, X. X. Xie, W. W. Ouyang, Y. H. Zhang, X. F. Wang, X. D. Zhang, X. W. Wang, L. Y. Zhao and J. T. Tang, Nano Res., 2010, 3, 23 CrossRef CAS.
- D. Kim, N. Lee, M. Park, B. H. Kim, K. An and T. Hyeon, J. Am. Chem. Soc., 2009, 131, 454 CrossRef CAS PubMed.
- C. Zhang, H. Zhang, B. Du, R. Hou and S. H. Guo, J. Colloid Interface Sci., 2011, 50, 9009 Search PubMed.
- P. Z. Guo, L. J. Cui, Y. Q. Wang, M. Lv, B. Y. Wang and X. S. Zhao, Langmuir, 2013, 29, 8997 CrossRef CAS PubMed.
- C. Burda, X. B. Chen, R. Narayanan and M. A. El-Sayed, Chem. Rev., 2005, 105, 1025 CrossRef CAS PubMed.
- Z. D. Lu and Y. D. Yin, Chem. Soc. Rev., 2012, 41, 6874 RSC.
- P. Z. Guo, G. L. Zhang, J. Q. Yu, H. L. Li and X. S. Zhao, Colloids Surf., A, 2012, 395, 168 CrossRef CAS.
- S. Laurent, D. Forge, M. Port, A. Roch, C. Robic, L. V. Elst and R. N. Muller, Chem. Rev., 2008, 108, 2064 CrossRef CAS PubMed.
- H. Naeimi, Z. Rashid, A. H. Zarnani and R. Ghahremanzadeh, New J. Chem., 2014, 38, 348 RSC.
- J. P. Ge, Y. X. Hu, M. Biasini, W. P. Beyerann and Y. D. Yin, Angew. Chem., Int. Ed., 2007, 46, 4342 CrossRef CAS PubMed.
- N. Z. Bao, L. M. Shen, Y. H. A. Wang, J. X. Ma, D. Mazumdar and A. Gupta, J. Am. Chem. Soc., 2009, 131, 12900 CrossRef CAS PubMed.
- M. Popa, P. Bruna, D. Crespo and J. M. C. Morenoz, J. Am. Ceram. Soc., 2008, 91, 2488 CAS.
- Y. C. Zhao, X. Y. Song, Z. L. Yin and Q. S. Song, J. Phys. Chem. C, 2008, 112, 13163 Search PubMed.
- M. Stjerndahl, M. Andersson, H. E. Hall, D. M. Pajerowski, M. W. Meisel and R. S. Duran, Langmuir, 2008, 24, 3532 CrossRef CAS PubMed.
- T. E. Quickel, V. H. Le, T. Brezesinski and S. H. Tolbert, Nano Lett., 2010, 10, 2982 CrossRef CAS PubMed.
- G. Chen, J. Y. Wang, L. B. Zhou, W. Ma, D. Zhang, F. L. Ren, H. L. Yan, G. Z. Qiu and X. H. Li, J. Am. Ceram. Soc., 2012, 95, 3569 CrossRef CAS.
- Z. G. Jia, D. P. Ren, Y. C. Liang and R. S. Zhu, Mater. Lett., 2011, 65, 3116 CrossRef CAS.
- J. S. Chen, Y. Zhang and X. W. Lou, ACS Appl. Mater. Interfaces, 2011, 3, 3276 CAS.
- Y. Meng, D. Chen and X. Jiao, Eur. J. Inorg. Chem., 2008, 4019 CrossRef CAS.
- Z. M. Li, X. Y. Lai, H. Wang, D. Mao, X. J. Xing and D. Wang, J. Phys. Chem. C, 2009, 113, 2792 CAS.
- T. G. Glover, D. Sabo, L. A. Vaughan, J. A. Rossin and Z. J. Zhang, Langmuir, 2012, 28, 5695 CrossRef CAS PubMed.
- M. K. Devaraju, S. Yin and T. Sato, ACS Appl. Mater. Interfaces, 2009, 1, 2694 CAS.
- M. Y. Li, Y. C. Mao, H. Yang, W. Li, C. S. Wang, P. Liu and Y. X. Tong, New J. Chem., 2013, 37, 3116 RSC.
- S. Verma and D. Pravarthana, Langmuir, 2011, 27, 13189 CrossRef CAS PubMed.
- M. Y. Liao, C. C. Huang, M. C. Chang, S. F. Lin, T. Y. Liu, C. H. Su, C. S. Yeh and H. P. Lin, J. Mater. Chem., 2011, 21, 7974 RSC.
- H. Y. Sun, B. Chen, X. L. Jiao, Z. Jiang, Z. H. Qin and D. R. Chen, J. Phys. Chem. C, 2012, 116, 5476 CAS.
- Y. S. Xia, T. Nguyen, M. Yang, B. Lee, A. Santos, P. Podsiadlo, Z. Y. Tang, S. C. Glotzer and N. A. Kotov, Nat. Nanotechnol., 2011, 6, 580 CrossRef CAS PubMed.
- Q. Y. Lu, F. Gao and D. Y. Zhao, Nano Lett., 2002, 2, 725 CrossRef CAS.
- L. J. Cui, P. Z. Guo, G. L. Zhang, Q. Li, R. Y. Wang, M. Zhou, L. N. Ran and X. S. Zhao, Colloids Surf., A, 2013, 423, 170 CrossRef CAS.
- J. P. Chen, C. M. Sorensen, K. J. Klabunde, G. C. Hadjipanayis, E. Devlin and A. Kostikas, Phys. Rev. B: Condens. Matter Mater. Phys., 1996, 54, 9288 CrossRef CAS.
- D. Carta, M. F. Casula, G. Mountjoy and A. Corrias, Phys. Chem. Chem. Phys., 2008, 10, 3108 RSC.
- P. C. Chang, C. J. Chien, D. Stichtenoth, C. Ronning and J. G. Lu, Appl. Phys. Lett., 2007, 90, 113101 CrossRef.
- L. He, C. Chen, N. Wang, W. Zhou and L. Guo, J. Appl. Phys., 2007, 102, 103911 CrossRef.
- J. R. Greer and J. T. M. De Hosson, Prog. Mater. Sci., 2011, 56, 654 CrossRef CAS.
- C. Vázquez-Vázquez, M. A. López-Quintela, M. C. Bujan-Nunez, M. C. Buján-Núñez and J. Rivas, J. Nanopart. Res., 2011, 13, 1663 CrossRef.
- F. S. Li, H. B. Wang, L. Wang and J. B. Wang, J. Magn. Magn. Mater., 2007, 309, 295 CrossRef CAS.
- K. Hayashi, W. Sakamoto and T. J. Yogo, J. Magn. Magn. Mater., 2009, 321, 450 CrossRef CAS.
- M. Moriya, K. Yoshikawa, W. Sakamoto and T. Yogo, Inorg. Chem., 2009, 48, 8544 CrossRef CAS PubMed.
- R. Y. Hong, J. H. Li, H. Z. Li, J. Ding, Y. Zheng and D. G. Wei, J. Magn. Magn. Mater., 2008, 320, 1605 CrossRef CAS.
- P. Z. Guo, Z. B. Wei, B. Y. Wang, Y. H. Ding, H. L. Li, G. L. Zhang and X. S. Zhao, Colloids Surf., A, 2011, 380, 234 CrossRef CAS.
- S. J. Guo, D. Wen, Y. M. Zhai, S. J. Dong and E. K. Wang, ACS Nano, 2010, 4, 3959 CrossRef CAS PubMed.
- J. B. Wu and H. Yang, Acc. Chem. Res., 2013, 46, 1848 CrossRef CAS PubMed.
- H. Y. Zhu, S. Zhang, Y. X. Huang, L. H. Wu and S. H. Sun, Nano Lett., 2013, 13, 2947 CrossRef CAS PubMed.
- M. H. Shao, A. Peles and K. Shoemaker, Nano Lett., 2011, 11, 3714 CrossRef CAS PubMed.
- V. Stamenkovic, B. S. Mun, K. J. J. Mayrhofer, P. N. Ross, N. M. Markovic, J. Rossmeisl, J. Greeley and J. K. Nørskov, Angew. Chem., Int. Ed., 2006, 45, 2897 CrossRef CAS PubMed.
Footnote |
| † Electronic supplementary information (ESI) available: Fig. S1–S5. See DOI: 10.1039/c4nj01466a |
| This journal is © The Royal Society of Chemistry and the Centre National de la Recherche Scientifique 2015 |

