Ga doped RGO–TiO2 composite on an ITO surface electrode for investigation of photoelectrocatalytic activity under visible light irradiation
Md. Rakibul
Hasan
*a,
Sharifah Bee
Abd Hamid
a,
Wan Jeffrey
Basirun
a,
Zaira Zaman
Chowdhury
a,
Ahmad Esmaielzadeh
Kandjani
b and
Suresh K.
Bhargava
b
aNanotechnology & Catalysis Research Center (NANOCAT), Institute of Postgraduate Studies (IPS), University of Malaya, 3rd floor, Block A, 50603 Kuala Lumpur, Malaysia. E-mail: rakibacctdu@gmail.com; sharifahbee@um.edu.my; wjeffreyb@yahoo.com; zaira.chowdhury76@gmail.com
bCentre of Advanced Materials & Industrial Chemistry, School of Applied Science, RMIT University, GPO BOX 2476, Melbourne 3000, Australia. E-mail: ahmad.kandjani@rmit.edu.au; suresh.bhargava@rmit.edu.au
First published on 17th October 2014
Abstract
Gallium (Ga) doped reduced graphene oxide–titania (RGO–TiO2) composites were successfully synthesized by a sol–gel method and deposited on an ITO coated glass substrate via an electrophoretic deposition method. The photocatalyst materials were tested in the CO2 conversion reaction in aqueous media. Prior to this, the catalysts were characterized by X-ray diffraction (XRD), scanning electron microscopy (SEM), UV-vis reflectance spectroscopy and Fourier transform infrared spectroscopy (FTIR). The synergistic effect of RGO and Ga doping on TiO2 was investigated. Electron–hole recombination on the catalyst surface can be minimized greatly by using RGO with TiO2 while Ga doping assists in reducing the band gap energy. The corresponding expansion of the absorption range towards the visible region was also observed. The results showed that both RGO and Ga enhance CO2 adsorption on the catalyst surface, hence facilitating a high CO2 conversion yield. The photoreduction products were mostly formic acid and trace amounts of methanol. A higher yield of formic acid was produced by the Ga–RGO–TiO2 composite films compared to the RGO–TiO2 composite and pure TiO2 film during a 120 min period of visible light irradiation.
1. Introduction
Present day human life is very much influenced by energy and environment related problems as the total world energy consumption is still dependent on conventional energy resources rather than renewable energy.1 The burning of fossil fuels (natural gas, coal, petroleum etc.) releases carbon dioxide (CO2) into the atmosphere. The environment is increasingly affected by the so-called greenhouse effect with the increase of CO2 concentration in the atmosphere.2 Hence, mitigation of CO2 in the atmosphere with the help of abundant renewable energy sources is becoming one of the key areas of present day research. The CO2 conversion process is not a new phenomenon and processes such as chemical reduction, thermochemical, photochemical and electrochemical conversions have already been established.3 Although some conversion processes have been practised on an industrial scale,4 the conversion yield is unsatisfactory and hence these processes are not economically feasible. Although the catalytic reduction of CO2 to hydrocarbons (i.e. formic acid, methanol, methane etc.) using hydrogen gas as a reducing agent is attainable, a renewable energy source which closely mimics the photosynthetic process to produce synthetic fuels should be involved in the total conversion process to attain feasibility. Hence, the photoreduction of CO2 in aqueous media draws attention in this context.5Solar energy is a viable renewable energy source due to its abundance and availability.6 The photoreduction of CO2 using solar energy is a process which can readily couple this free energy with an inexpensive reducing agent (i.e. water) to achieve rapid and selective production of various hydrocarbon fuels such as HCHO, CH3OH, HCOOH, CH4etc.7 Furthermore, some of the reduced species could be valuable feedstocks as industrial raw materials for various processes.
The key part of the total conversion process depends on an efficient photocatalytic material for solar irradiation. Various metal oxides and carbon nanomaterials such as WO3, TiO2, CdS, GaP, ZrO2, ZnO, SiC, graphene, and carbon nanotubes (CNTs) have been studied.8,9 Among them, the wide band gap TiO2 photocatalyst (3.2 eV) is considered the most appropriate metal oxide due to its promising features. Titania nanomaterials are commercially established photocatalytic materials. This is due to their wonderful tunable microstructure, chemical stability, non-toxicity, easy availability and low cost.10 Graphene, a two dimensional layer of sp2 hybridized carbon atoms in a honeycomb structure, has attracted great interest in the development of advanced nanomaterials11 due to its excellent optical, thermal, electrical and mechanical properties. Graphene has seen applications in the fabrication of catalysts, capacitors and biosensors due to these exceptional features. Due to the absence of functional groups and the low solubility of graphene in most common solvents, the more soluble graphene oxide and reduced graphene oxide have been used in these applications.12
Graphene oxide (GO) in its reduced form, i.e. reduced graphene oxide (RGO), has less defect sites and hence shows high electron mobility and optical transparency.13 Large specific surface area, strong mechanical properties and high stability are the unique properties of RGO that make it a desirable electrocatalyst and photocatalyst material.14 In the field of photocatalysis, both TiO2 and RGO are very attractive materials due to their light absorption properties and stability.15 Recent research showed that a RGO–TiO2 composite can be used for the photodegradation of pollutants, in solar cells and for H2 production.16 Some reports on CO2 conversion using RGO–TiO2 composites are also available.5
The utilization of solar energy in the visible region, which forms almost 40% of the total solar spectrum, can be achieved by using a semiconductor with an appropriate band gap. TiO2 nanomaterials still have some limitations in being photocatalytically activated in the visible region. A fast photogenerated charge recombination rate is still a major drawback in achieving higher photocatalytic efficiency.17
The photoelectrocatalysis (PEC) process, which combines photocatalysis and an electrochemical redox process, can minimize the charge recombination losses and photo-instabilities of the photo-excited semiconductors18 to a great extent. In this case, the immobilization of a photocatalyst powder onto a conducting substrate is an efficient strategy for a successful PEC process.19 Hence, there are still plenty of opportunities for enhancing the photocatalytic efficiency of TiO2 nanomaterials.
For this reason, a higher efficiency could be reached by replacing 3d0 Ti atoms with 3d10 Ga cations thus inducing O 2p vs. cation 3d10 repulsion. The coupling of TiO2 with Ga2O3 can promote easy electron–hole separation under irradiation and decrease the recombination effect for higher photocatalytic activity. Furthermore, Ga2O3 is also an effective activation site for the reaction of a CO2 molecule.20
In this work, a Ga–RGO–TiO2 nanocomposite powder produced by an acid catalyzed sol–gel process was deposited onto an ITO substrate via electrophoretic deposition. The thin film catalyst was assembled in a PEC reactor for the photocatalytic reduction of CO2 under solar simulator irradiation.
2. Experimental methods
2.1 Materials
Graphite flakes nominally sized at 7–10 μm were procured from Alfa Aesar. Tetra-n-butyl ortho titanate [Ti(OBu)4] (TBOT) was procured from Sigma-Aldrich and all other chemicals used in this work were of analytical grade. The indium tin oxide (ITO) coated conducting glass plates (0.7 mm thickness) were procured from Osaka, Japan. Deionized water (18.2 MΩ cm) used for all experiments was obtained from a Milli-Q system (Millipore, Bedford with Mega-Pure System, Model MP-290). The light source, a 150 W (Xe arc lamp) solar simulator, was purchased from OSRAM photo optic, Germany. It has a consistent spectrum profile of sunlight i.e. almost the same characteristic features of solar light under standard air conditions. Carbon dioxide was used from a gas cylinder containing 99.9% pure gas.2.2 Preparation of reduced graphene oxide (RGO)
Graphene oxide (GO) was prepared using the modified Hummer's method.21–23 1 g graphite flakes was mixed with sulfuric acid and phosphoric acid (120 ml![[thin space (1/6-em)]](https://www.rsc.org/images/entities/char_2009.gif) :
:![[thin space (1/6-em)]](https://www.rsc.org/images/entities/char_2009.gif) 13 ml). Then, 6 g KMnO4 was gradually added and the mixture was kept under stirring for 3 days. Then, with the addition of 7 ml H2O2 solution (30%) and 135 ml ice water, the mixture turned a brown color. The mixture was then centrifuged at 4000 rpm for 10 minutes. After the centrifugation process the GO suspension was washed with 1 M HCl via the same sonication process. The GO suspension was dried in an oven and later subjected to hydrazine treatment to obtain reduced graphene oxide (RGO).24 300 mg of GO powder was mixed with 600 ml ultrapure Milli-Q water and kept under sonication for 15 minutes. Then 3 ml hydrazine hydrate was added and the solution was kept under vigorous stirring at 90 °C for 6 hours. The RGO was precipitated as a black solid.25 The solution was filtered and washed with ethanol and water several times to obtain the RGO powder. The powder was dried in an oven at 80 °C.
13 ml). Then, 6 g KMnO4 was gradually added and the mixture was kept under stirring for 3 days. Then, with the addition of 7 ml H2O2 solution (30%) and 135 ml ice water, the mixture turned a brown color. The mixture was then centrifuged at 4000 rpm for 10 minutes. After the centrifugation process the GO suspension was washed with 1 M HCl via the same sonication process. The GO suspension was dried in an oven and later subjected to hydrazine treatment to obtain reduced graphene oxide (RGO).24 300 mg of GO powder was mixed with 600 ml ultrapure Milli-Q water and kept under sonication for 15 minutes. Then 3 ml hydrazine hydrate was added and the solution was kept under vigorous stirring at 90 °C for 6 hours. The RGO was precipitated as a black solid.25 The solution was filtered and washed with ethanol and water several times to obtain the RGO powder. The powder was dried in an oven at 80 °C.
2.3 Preparation of the Ga–RGO–TiO2 nanocomposite
For the preparation of the TiO2 nanocomposite, 20 ml TBOT was added to 80 ml of absolute ethanol and kept under stirring. Then 6 ml ultrapure water, 6 ml ethanol, 1 mol% Ga(NO3)3·xH2O and 1 wt% RGO powder were mixed and kept under sonication for 1.5 hours. This mixture was added to the TBOT solution dropwise for 30 minutes. Acetic acid was added to lower the pH of the solution to <3. The total mixture was kept under vigorous stirring for 30 minutes to obtain a homogeneous solution. The dark colored solution was then kept at room temperature for 48 hours for complete gel formation. The gel was dried at 100 °C overnight. The dry porous gel was milled with a steel made mortar and pestle. The fine powder catalyst was then calcined at 550 °C for 4 hours.2.4 Fabrication of the Ga–RGO–TiO2/ITO photoanodes
The Ga–RGO–TiO2/ITO films were synthesized using an electrophoretic deposition method. The prepared composite powder was dispersed in DI water at a concentration of 0.1 mg ml−1, at pH ∼ 3.5. The mixture was sonicated to ensure a homogeneous dispersion of the composite powder before the deposition process. Fig. 1 shows the preparation steps where 1(c) shows the Ga–RGO–TiO2/ITO photocatalyst thin film.2.5 Photoelectrochemical measurements
All photoelectrochemical measurements were carried out in a cubic quartz cell using an Autolab PGSTAT30 potentiostat/galvanostat (Ecochemie, Netherlands). A standard three-electrode system was used where the photoanodes with an area of 1 cm2 were the working electrode (WE). A platinum (Pt) wire was the counter electrode and a saturated calomel electrode (SCE) was the reference. The electrolyte used in these experiments was 0.1 M Na2SO4. The voltammetric measurements were performed in a potential range of 0.0 V to −1.5 V (vs. SCE) with a scan rate of 50 mV s−1. Electrochemical impedance spectroscopy (EIS) was measured at the open circuit potential (OCP) in the dark and under solar simulator irradiation. Simulation of the EIS experimental data was carried out using analog circuits with NOVA 1.9 software installed on a computer, interfaced with the potentiostat. The frequency range was between 10−1 Hz to 105 Hz, with an amplitude of 5 mV around the OCP.2.6 Constant potential photoelectrolysis
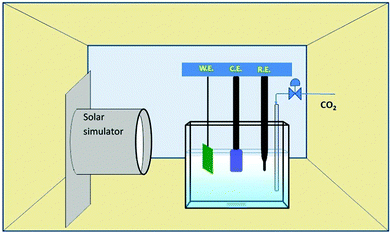
The photoelectrocatalytic conversion of CO2 was conducted in the quartz cell containing 5% triethanolamine (TEA) aqueous solution. Fig. 2 shows a schematic diagram of the photoelectrocatalytic reduction process with a three-electrode system, where a Pt wire was the CE with the same area as the WE. The irradiation intensity was measured as ∼10 mW cm−2. Prior to the reaction, CO2 was bubbled for 1 hour to produce a saturated solution. The liquid phase product was analyzed by gas chromatography-mass spectroscopy. Formic acid concentration was measured by gas chromatography (Agilent 6890N with 5973 mass selective detector). The temperature profile for the detection method was: injector 250 °C, oven 40 °C and the detector at 180 °C. Only the peaks for formic acid and methanol were taken into account during the chromatography process.2.7 Apparatus and measurements
A scanning electron microscope (Quanta FEI 200) was used to assess the morphology of the as-prepared composite samples. The X-ray diffraction (XRD) measurements were recorded with a powder X-ray diffractometer (Type Bruker D8 Advance equipped with EVA diffract software, Germany) over the range 20° ≤ 2θ ≤ 80°, operating at 40 kV and 30 mA with a Cu Kα radiation (k = 1.5418 Å). UV-vis absorbance spectra were obtained using a spectrophotometer from Perkin Elmer, Lambda 35 series equipped with a 10 mm path length quartz cell. Fourier transform infrared spectroscopy (FTIR) was recorded using a Bruker IFS 66V/S using a KBr technique.X-ray photoelectron spectroscopy (XPS) surface analyses were carried out using flat gold (Si/10 nm Ti/200 nm Au) as the substrate and reference. A Thermo Scientific K-alpha instrument with an un-monochromatized Mg Kα radiation (photon energy 1253.6 eV) source and a vacuum better than 10−9 Torr as well as a spectral resolution of 0.1 eV was used for the XPS studies. XPS core levels were aligned to the Au 4f 7/2 binding energy (BE) of 84 eV.
3. Results and discussion
3.1 Fabrication and characterization of the Ga–RGO–TiO2/ITO composite electrode
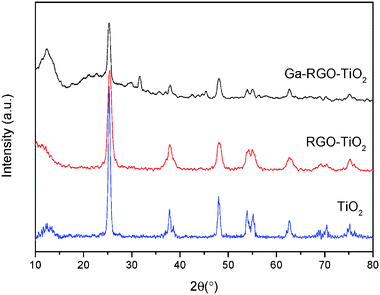
The catalyst film was characterized by crystallographic, morphological and optical analyses. XRD revealed the crystalline phases of anatase TiO2. Fig. 3 shows the XRD pattern of the prepared catalyst. According to the JCPDS ref. code 01-086-1157, the characteristic sharp peaks at 25.3 (101), 37.9 (103), 48.1 (200), 53.9 (105) and 75.1 (215) confirm titania tetragonal crystal system of the anatase phase. The calcination temperature 550 °C mainly played the role of producing crystalline nanocomposites of anatase TiO2. No phase change of anatase to rutile was found. The peaks at 37.6 and 38.5 could be the β-Ga2O3 phase present in the TiO2 phase [JCPDS ref. code 00-011-0370]. Other peaks at 30.5, 31.7, 33.5, 35.2, 42.9, 46.2 and 48.6° which are characteristic for Ga2O3 were not observed in the prepared sample. This was due to the Ga2O3 doping concentration being too low and it was beyond the X-ray diffraction limit. The peak overlapping of the characteristic RGO peak at 25.8° with the TiO2 (101) plane was observed. It can be assumed that Ga2O3 was highly dispersed on the TiO2 surface and hence the peaks corresponding to Ga2O3 are not obvious. The average crystallite size was calculated using Scherrer's formula (eqn (1)) with respect to the anatase (101) peak. | (1) |
The crystallite size of the Ga–RGO–TiO2 composites was between 35–56 nm. Doping of RGO didn't bring about any crystallite phase changes. Thus, it can be said that RGO has no effect on crystallite size.
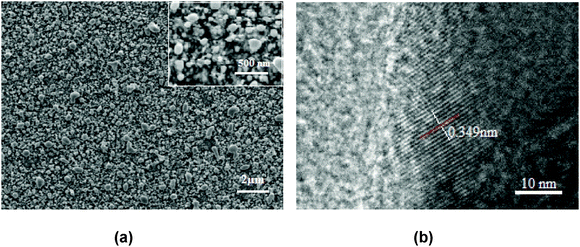
Fig. 4(a) shows the FESEM image of Ga–RGO–TiO2 composite nanoparticles. It was observed that the sample particles were quite irregular spheres where as pure TiO2 was mostly spherical (not shown here). Thus, the influence of the dopants on the morphology of the catalyst is obvious. The morphological change may be due to the formation of grain boundaries at high temperature calcination. On the other hand, the d-spacing for the Ga–RGO–TiO2 composite was estimated by HRTEM to be 0.349 nm Fig. 4(b). The relatively higher value for the Ga doped RGO–TiO2 composite ensures the successful doping of other elements into the TiO2 lattice. The particle size was found to be about 120–160 nm in diameter. It can be assumed that the Ga–RGO–TiO2 particles are aggregates of small crystals.
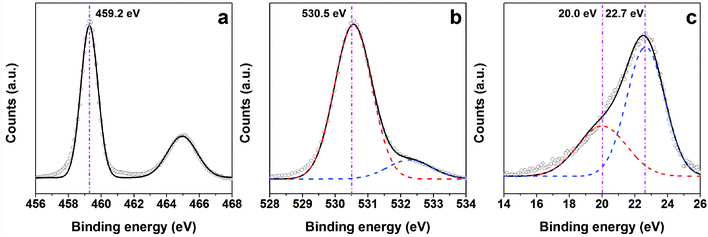
Fig. 5 shows the XPS spectra of Ga doped TiO2 nanoparticles. The electron-binding energy (BE) of the photoelectron peak of Ti 2p (Fig. 5a) illustrates the existence of Ti4+ species in the TiO2 nanostructures located at 459.2 eV. The shift could be related to the electron interaction between doped Ga and Ti in the structure. It has been previously26 shown that the doping of semiconductors with Ga can cause a significant shift of the Ga3+ 3d peak to higher energies. Similarly in this work, the two peaks observed in the Ga doped spectrum (Fig. 5c) shifting towards higher energies can be attributed to the formation of free Ga3+ and Ga2+ (20.0 and 22.7 eV) in the structures, respectively.27,28
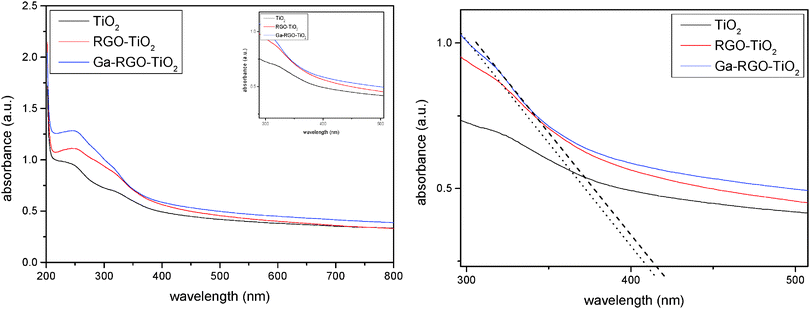
Fig. 6 depicts the UV-vis absorbance spectra of the Ga–RGO–TiO2 nanoparticles in the range of 200–800 nm. The curve reflects the optical absorption property of the catalyst. The sample clearly exhibits a red shift of the absorption edge towards the visible region. The peak was found to be slightly split and a part of it shows absorption in the visible region which is more than for pure TiO2 (absorption <387 nm) and the absorption range is wider than for pure TiO2 and Ga–TiO2 as well. The band gap values were determined by eqn (2),
 | (2) |
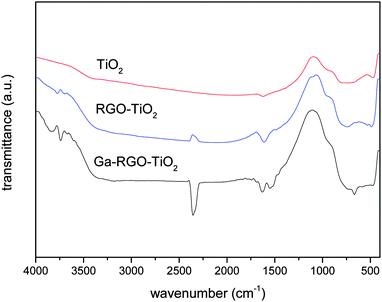
The FTIR spectrum of the prepared catalyst sample is shown in Fig. 7. Prominent absorption bands were observed at 468.16, 666, 1551 and 1626 cm−1. In RGO, most of the C![[double bond, length as m-dash]](https://www.rsc.org/images/entities/char_e001.gif) O bonds are eliminated and therefore the peak at 1720 cm−1 was absent. It confirms a well reduced RGO structure. The peak at 1551 cm−1 is attributed to the graphene sheet skeletal vibration. The Ti–O–Ti stretching vibrational peak was observed below 1000 cm−1. The broader peak in the range 2400–3400 cm−1 can be attributed to H-bonding between –OH groups present on the TiO2 surface. The Ga–O stretching vibration absorption was observed at 468.16 cm−1 and it denotes a monoclinic Ga2O3 structure.29 A strong peak at 2358 cm−1 is due to adsorbed CO2 molecules on the TiO2 surface for atmospheric CO2.
O bonds are eliminated and therefore the peak at 1720 cm−1 was absent. It confirms a well reduced RGO structure. The peak at 1551 cm−1 is attributed to the graphene sheet skeletal vibration. The Ti–O–Ti stretching vibrational peak was observed below 1000 cm−1. The broader peak in the range 2400–3400 cm−1 can be attributed to H-bonding between –OH groups present on the TiO2 surface. The Ga–O stretching vibration absorption was observed at 468.16 cm−1 and it denotes a monoclinic Ga2O3 structure.29 A strong peak at 2358 cm−1 is due to adsorbed CO2 molecules on the TiO2 surface for atmospheric CO2.
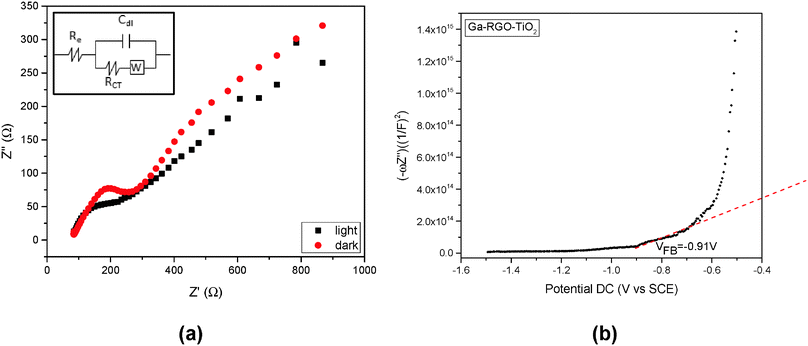
The most critical drawback in photoelectrocatalysis is the recombination process.30 EIS is quite a useful tool for investigating the charge transfer and recombination processes at the semiconductor/electrolyte interface.31 The EIS responses of Ga–RGO–TiO2/ITO are shown as Nyquist plots corresponding to the imaginary part Z′′ versus the real part Z′ of the complex impedance Z (Fig. 8). The impedance values of the photocatalyst were measured at open circuit potential in the dark and illumination conditions. While under irradiation, the diameter of the loop decreases and the curve tends to become a semicircle. The charge transfer resistance (Rct) is the manifestation of the electron transfer kinetics across the electrode/electrolyte interface.32 A straight slope at lower frequencies is due to the diffusion process between the electrode and the electrolyte. The Fig. 8a inset shows the equivalent circuit across the electrode/electrolyte interface where a Warburg diffusion model is proposed. Here, Re refers to the bulk resistance between the WE and the RE at the high frequency intercept of the semicircle with respect to the real axis. The interfacial resistance is described by RCT in the circuit. The low frequency region where an almost straight line was observed is represented by the Warburg impedance (W). This impedance apparently results from OH− or H+ ion diffusion on the electrode surface.33
A positive slope in the Mott–Schottky plot in Fig. 8b indicates that the photocatalyst is n-type.
3.2 Photoelectrocatalytic reduction of carbon dioxide into formic acid
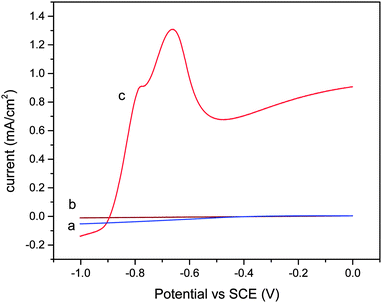
Fig. 9 shows the voltammetric response of the catalyst film under different conditions. In the dark, no current was observed (Fig. 9a). A small current was observed when the catalyst thin film was illuminated (Fig. 9b). After 1 hour of CO2 bubbling, the pH of the 5% triethanolamine (TEA) solution was 6.8.A significant anodic current can be seen in the presence of CO2 (Fig. 9c). The anodic peak at about −0.57 V (vs. SCE) is due to the presence of CO2 in the TEA solution. In addition, the peak current increased with the concentration of TEA solution.
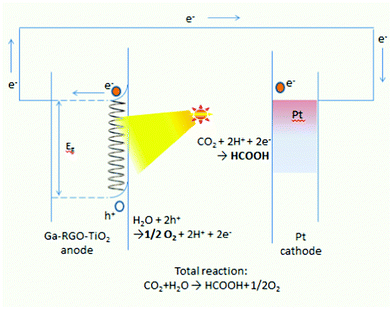
When the catalyst was illuminated, electrons from the valence bands are excited to the conduction bands, leaving holes where water oxidation occurs as follows:
| 2H2O + 4h+ → 4H+ + O2 | (3) |
The excited electrons complete the circuit and reach the counter electrode. The electrons which reach the counter electrode promote the hydrogen evolution reaction (HER):
| 2H+ + 2e− → H2 Eθ/V = 0 | (4) |
When in the presence of CO2, it was observed that gas bubbles evolved on the platinum counter electrode. Apart from this, CO2 reduction also commenced with the release of electrons from the photoanode. With the reactions at the platinum counter electrode being purely electrochemical, comparisons of the standard equilibrium potentials for the reduction of CO2 with the HER can be given as:34
| CO2 + 2H+ + 2e− ⇆ HCO2H Eθ/V = −0.61 V | (5) |
| CO2 + 4H+ + 4e− ⇆ HCHO + H2O Eθ/V = −0.48 V | (6) |
| CO2 + 6H+ + 6e− ⇆ CH3OH + H2O Eθ/V = −0.38 V | (7) |
The low concentration of formic acid observed is due to the CO2 reduction being harder to achieve compared to the HER.
A constant potential photoelectrolysis experiment was carried out at −0.57 V vs. SCE and resulted in a low Faradaic efficiency of formic acid. Fig. 10a shows that the concentration of formic acid increases with the electrolysis time (max. 178 ppm in 2 hours). The presence of formic acid is detected as the reduction product by both HPLC and GC-MS. Fig. 10b presents the graph of photocurrent vs. reaction time. A constant photocurrent of 1.5 mA cm−2 persisted for almost 40 minutes. The initial drop of photocurrent was observed from 4.6 mA to 1.65 mA during the first 30 minutes. A schematic mechanism of CO2 photoconversion into HCOOH is shown in Fig. 11.
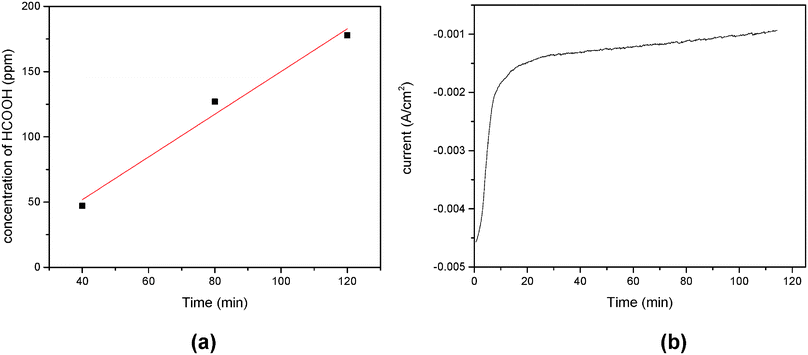 | ||
| Fig. 10 Yield of formic acid as a function of the reaction time (a) and the dependence of photocurrent on the reaction time in the photoelectrocatalytic reduction of CO2 (b). | ||
4. Conclusions
A Ga doped RGO–TiO2 composite was fabricated via a sol–gel process and deposited on an ITO substrate using an electrophoretic deposition method. The XRD diffractograms show that the samples are well crystallized which is a key factor for successful photocatalytic activity. The nanostructured surface morphology of the Ga doped sample enhances the photoconversion process of CO2 to a great extent. Ga doping also helps the RGO–TiO2 nanomaterial to absorb light irradiation in the visible region (>400 nm wavelength). The photocurrent was raised at a maximum 4.6 mA at −0.57 V bias potential on the Ga–RGO–TiO2/ITO photoelectrode. No significant photocurrent was observed for the TiO2 or RGO–TiO2 thin film photoelectrodes. A maximum of 178 ppm of formic acid was recorded for a two hour reaction period. The low concentration of formic acid produced at the counter electrode is due to the vigorous HER at the platinum surface. Nevertheless the concentration of formic acid increased with the photoelectrolysis reaction time.Acknowledgements
The authors would like to thank the University of Malaya for sponsoring this work under the National Nanotechnology Directorate (NND-53-02031090), High Impact Research (HIR-F-000032) and IPPP grant (PG043-2012B) for their cordial support to complete this work.References
- A. Demirbas, Prog. Energy Combust. Sci., 2005, 31(2), 171–192 CrossRef CAS PubMed.
- S. Solomon, G. K. Plattner, R. Knutti and P. Friedlingstein, Proc. Natl. Acad. Sci. U. S. A., 2009, 106(6), 1704–1709 CrossRef CAS PubMed.
- M. A. Scibioh and B. Viswanathan, Proc. Indian Natl. Sci. Acad., Part A, 2004, 70(3), 407–462 CAS.
- N. N. Madikizela and N. J. Coville, J. Mol. Catal. A: Chem., 2002, 181, 129–136 CrossRef CAS.
- A. D. Handoko, K. Li and J. Tang, Curr. Opin. Chem. Eng., 2013, 2(2), 200–206 CrossRef PubMed.
- S. C. Roy, O. K. Varghese, M. Paulose and C. A. Grimes, ACS Nano, 2010, 4(3), 1259–1278 CrossRef CAS PubMed.
- A. T. Bell, B. C. Gates, D. Ray and M. R. Thompson, Basic research needs: catalysis for energy (No. PNNL-17214). Pacific Northwest National Laboratory (PNNL), Richland, WA (US), 2008.
- T. Inoue, A. Fujishima, S. Konishi and K. Honda, Nature, 1979, 277, 637–638 CrossRef CAS.
- T. M. Breault, PhD Diss., University of Michigan, 2013.
- Z. Wu, Q. Wu, L. Du, C. Jiang and L. Piao, Particuology, 2013 DOI:10.1016/j.partic.2013.04.003.
- A. K. Geim, Science, 2009, 324(5934), 1530–1534 CrossRef CAS PubMed.
- J. I. Paredes, S. Villar-Rodil, A. Martínez-Alonso and J. M. D. Tascón, Langmuir, 2008, 24(19), 10560–10564 CrossRef CAS PubMed.
- K. A. Mkhoyan, A. W. Contryman, J. Silcox, D. A. Stewart, G. Eda, C. Mattevi, S. Miller and M. Chhowalla, Nano Lett., 2009, 9(3), 1058–1063 CrossRef CAS PubMed.
- K. P. Loh, Q. Bao, G. Eda and M. Chhowalla, Nat. Chem., 2010, 2(12), 1015–1024 CrossRef CAS PubMed.
- L. L. Tan, W. J. Ong, S. P. Chai and A. R. Mohamed, Nanoscale Res. Lett., 2013, 8, 465 CrossRef PubMed.
- V. Štengl, S. Bakardjieva, T. M. Grygar, J. Bludská and M. Kormunda, Chem. Cent. J., 2013, 7(1), 41 CrossRef PubMed.
- K. Nakata and A. Fujishima, J. Photochem. Photobiol., C, 2012, 13, 169–189 CrossRef CAS PubMed.
- C. Zhai, M. Zhu, F. Ren, Z. Yao, Y. Du and P. Yang, J. Hazard. Mater., 2013, 263, 291–298 CrossRef CAS PubMed.
- H. J. Lewerenz, C. Heine, K. Skorupska, N. Szabo, T. Hannappel, T. Vo-Dinh, S. A. Campbell, H. W. Klemm and A. G. Munoz, Energy Environ. Sci., 2010, 3(6), 748–760 CAS.
- T. Inui, Catal. Today, 1996, 29(1), 329–337 CrossRef CAS.
- W. S. Hummers Jr and R. E. Offeman, J. Am. Chem. Soc., 1958, 80(6), 1339 CrossRef.
- N. Huang, H. Lim, C. Chia, M. Yarmo and M. Muhamad, Int. J. Nanomed., 2011, 6, 3443–3448 CrossRef CAS PubMed.
- D. C. Marcano, D. V. Kosynkin, J. M. Berlin, A. Sinitskii, Z. Sun, A. Slesarev, L. B. Alemany, W. Lu and J. M. Tour, ACS Nano, 2010, 4(8), 4806–4814 CrossRef CAS PubMed.
- S. Liu, H. Sun, S. Liu and S. Wang, Chem. Eng. J., 2012, 214, 298–303 CrossRef PubMed.
- S. Stankovich, D. A. Dikin, R. D. Piner, K. A. Kohlhaas, A. Kleinhammes, Y. Jia, Y. Wu, S. T. Nguyen and R. S. Ruoff, Carbon, 2007, 45, 1558–1565 CrossRef CAS PubMed.
- J. Toyir, P. Ramírez de la Piscina, J. L. G. Fierro and N. s. Homs, Appl. Catal., B, 2001, 34, 255–266 CrossRef CAS.
- S. D. Wolter, B. P. Luther, D. L. Waltemyer, C. Önneby, S. E. Mohney and R. J. Molnar, Appl. Phys. Lett., 1997, 70, 2156–2158 CrossRef CAS PubMed.
- K. Hee-Sung, M. S. P. Reddy, K. Dong-Seok, K. Ki-Won, H. Jong-Bong, L. Yong Soo, C. Hyun-Chul and L. Jung-Hee, J. Phys. D: Appl. Phys., 2013, 46, 155101 CrossRef.
- S. Cho, J. Lee, I. Y. Park and S. Kim, Mater. Sci. Eng., B, 2002, 95(3), 275–278 CrossRef.
- X. Chen and S. S. Mao, Chem. Rev., 2007, 107(7), 2891–2959 CrossRef CAS PubMed.
- F. Fabregat-Santiago, E. M. Barea, J. Bisquert, G. K. Mor, K. Shankar and C. A. Grimes.
- W. H. Leng, Z. Zhang, J. Q. Zhang and C. N. Cao, J. Phys. Chem. B, 2005, 109, 15008–15023 CrossRef CAS PubMed.
- X. I. He, Y. Y. Cai, H. M. Zhang and C. H. Liang, J. Mater. Chem., 2011, 21, 475–480 RSC.
- E. E. Benson, C. P. Kubiak, A. J. Sathrum and J. M. Smieja, Chem. Soc. Rev., 2009, 38(1), 89–99 RSC.
| This journal is © The Royal Society of Chemistry and the Centre National de la Recherche Scientifique 2015 |


