DOI:
10.1039/C4NJ01344A
(Paper)
New J. Chem., 2015,
39, 386-395
Study on the interaction of (+)-catechin with human serum albumin using isothermal titration calorimetry and spectroscopic techniques
Received
(in Montpellier, France)
9th August 2014
, Accepted 27th October 2014
First published on 27th October 2014
Abstract
In this study, the interaction between (+)-catechin and human serum albumin (HSA) was investigated using isothermal titration calorimetry (ITC), in combination with fluorescence spectroscopy, UV-vis absorption spectroscopy, and circular dichroism (CD) spectroscopy. Thermodynamic investigations reveal that the hydrogen bonding and van der Waals force are the major binding forces in the binding of (+)-catechin to HSA. The binding of (+)-catechin to HSA is driven by favorable enthalpy and unfavorable entropy. Fluorescence experiments suggest that (+)-catechin can quench the fluorescence of HSA through a static quenching mechanism. The obtained binding constants and the equilibrium fraction of unbound (+)-catechin show that (+)-catechin can be stored and transported from the circulatory system to reach its target organ. Binding site I is found to be the primary binding site for (+)-catechin. Additionally, as shown by the UV-vis absorption, synchronous fluorescence spectroscopy and circular dichroism (CD) spectroscopy, (+)-catechin may induce conformational and microenvironmental changes of HSA.
1. Introduction
Serum albumin is the principal extracellular protein of the circulatory system, and accounts for about 60% of the total plasma proteins corresponding to a concentration of 42 mg mL−1 and providing about 80% of the colloid osmotic pressure of blood.1 Human serum albumin (HSA) is the most studied serum albumin because its primary structure is well known and its tertiary structure has been determined by X-ray crystallography. It is a single-chain, non-glycosylated globular protein consisting of 585 amino acid residues, and 17 disulfide bridges assist in maintaining its familiar heart-like shape.2 Crystallographic data show that HSA contains three homologous α-helical domains (I, II, and III): I (residues 1–195), II (196–383), and III (384–585), each of which includes 10 helices that are divided into six-helix and four-helix subdomains (A and B).2 A multitude of ligand binding sites are scattered over the entire protein. The principal regions of ligand binding sites in HSA are located in hydrophobic cavities in subdomains IIA and IIIA, called site I and site II, respectively.3 There are nine distinct fatty acid binding sites, four thyroxine binding sites, several metal binding sites including albumin's N-terminus, and a site centered around residue Cys34.4 These multiple binding sites underline the exceptional ability of HSA to act as a major depot and transport protein, capable of binding, transporting and delivering an extraordinarily diverse range of endogenous and exogenous compounds in the bloodstream to their target organs. Up to now, many studies in the literature have reported the interaction between drugs and HSA.5–9
Knowledge of interaction mechanisms between drugs and serum albumin is very important for us to understand the pharmacokinetics and pharmacodynamics of drugs. First, the drugs–HSA interaction plays a dominant role in the bioavailability of drugs because the bound fraction of drugs is a depot, whereas the free fraction of drugs shows pharmacological effects.10 In addition, if drugs are metabolized and excreted from the body too fast because of low protein binding, drugs won't be able to provide their therapeutic effects. Alternatively, if drugs have high protein binding and are metabolized and excreted too slowly, it may increase the half-life of drugs in vivo and lead to undesired side effects.11 Furthermore, very high affinity binding of drugs to serum albumin may prevent drugs from reaching the target at all, resulting in insufficient tissue distribution and efficacy. In a word, the absorption, distribution, metabolism, and excretion properties of drugs can be significantly affected as a result of their binding to serum albumin. Besides, there is evidence of conformational changes of serum albumin induced by its interaction with drugs, which may affect serum albumin's biological function as the carrier protein.12 Consequently, investigation of the binding of drugs to serum albumin is of great importance.
Catechins are plant polyphenolic compounds belonging to a subclass, known as flavan-3-ols, in the flavonoid family. The naturally occurring compounds are widely distributed in various fruits, green tea, red wine, juices, and in chocolate.13 Catechins have received much attention due to their biological and pharmacological effects including antioxidant, anti-mutagenic, anti-carcinogenic, anti-viral, anti-microbial, and anti-inflammatory properties.14–19 It is well known that structural features, namely the number of the galloyl and hydroxyl groups in the molecule of catechins, play an important role in their biological activities, particularly antioxidant properties,20 providing the protection against diseases directly or partially involving accumulation of free radicals in the body, e.g. cancers, aging, diabetes, neurodegenerative and cardiovascular diseases.21 Therefore, the antioxidant properties of catechins give them multiple applications in the pharmaceutical, agricultural and food industries, as well as in those industries that utilize or produce oxidants materials. However, catechins were noticed to show also negative effects such as pro-oxidative, cyto-and phytotoxic activities.22–24
Some spectroscopic studies on the interaction between serum albumin and catechins have been published,20,25–29 as well as some non-spectroscopic studies, e.g. electrophoretic techniques,20,30 and molecular docking.31 Nevertheless, spectroscopic methods used are more useful for determining functional groups and chromophores than providing definite information regarding thermodynamic parameters. Isothermal titration calorimetry (ITC), which measures directly the heat evolved during a reaction, is the method of choice for obtaining thermodynamic information. This is because only ITC allows researchers to obtain directly the variations of enthalpy ΔH0 and of entropy ΔS0, as well as the association constant K and the stoichiometry of binding n, for an association process.32 Unlike other methods, ITC does not require chemical modification or immobilisation of reactants since heat of binding is a naturally occurring phenomenon.33,34 This sets the technique apart from fluorescence methods that often require labeling or are specific to proteins that contain a fluorophore that is accessible to a quencher. ITC can also be applied to systems where the complex formed is insoluble. This is a distinct advantage over many solution based techniques, including capillary electrophoresis, where complex insolubility can be problematic.35 The binding study between epicatechin and bovine serum albumin (BSA) had been done previously by ITC.36
One of the most widely studied catechins is (+)-catechin (molecular structure: inset of Fig. 2B) due to its high abundance in the human diet and relevant antioxidant activity.29 However, to our knowledge, an accurate and full basic data for clarifying the binding mechanisms of (+)-catechin to HSA remain unclear. In the present work, a comprehensive investigation was performed for the binding properties of (+)-catechin to HSA under the physiological conditions. Using isothermal titration calorimetry (ITC), in combination with different spectroscopic methods, the binding information, including thermodynamic parameters, the quenching mechanism, binding parameters, the equilibrium fraction of unbound (+)-catechin, the high-affinity binding site, and conformational changes of HSA, was investigated. The study provides an accurate and full basic data for clarifying the binding mechanism of (+)-catechin with HSA and is helpful for understanding its effect on protein function during the blood transportation process and its biological activity in vivo.
2. Experimental
2.1. Materials
HSA, (+)-catechin, warfarin, and ibuprofen were purchased from Sigma-Aldrich Chemicals Company (USA). (+)-Catechin was directly dissolved in phosphate buffer solution of pH 7.40 (0.01 mol L−1 PBS). The stock solution of (+)-catechin was prepared and used immediately because of oxidation under light and air. The water used to prepare the solution was double distilled water. The HSA was dissolved in a phosphate buffer solution of pH 7.40 (0.01 mol L−1 PBS). The HSA stock solution was prepared by extensive overnight dialysis at 4 °C against the buffer. The concentration of the HSA was determined on a TU-1810 spectrophotometer (Puxi Analytic Instrument Ltd, Beijing, China) using the extinction coefficient ε280 = 35![[thin space (1/6-em)]](https://www.rsc.org/images/entities/char_2009.gif) 700 mol−1 L cm−1.37 The reported pH was determined on a PHS-2C pH-meter (Shanghai DaPu Instruments Co., Ltd, Shanghai, China) at ambient temperature. Sample masses were accurately weighed on a microbalance (Sartorius, BP211D) with a resolution of 0.01 mg. All other reagents were of analytical reagent grade and were used as purchased without further purification.
700 mol−1 L cm−1.37 The reported pH was determined on a PHS-2C pH-meter (Shanghai DaPu Instruments Co., Ltd, Shanghai, China) at ambient temperature. Sample masses were accurately weighed on a microbalance (Sartorius, BP211D) with a resolution of 0.01 mg. All other reagents were of analytical reagent grade and were used as purchased without further purification.
2.2. Isothermal titration calorimetry (ITC)
Titration of HSA with (+)-catechin was performed using a Model Nano-ITC 2G biocalorimetry instrument (TA, USA) at 298 K. All these solutions were thoroughly degassed prior to the titrations to avoid the formation of bubbles in the calorimeter cell. The sample cell was loaded with the phosphate buffer (PBS, 0.01 mol L−1) or protein solution and the reference cell contained double distilled water. In a typical experiment, buffered HSA solution was placed in the 950 μL sample cell of the calorimeter and (+)-catechin solution was loaded into the injection syringe. Injections were started after baseline stability had been achieved. (+)-catechin was titrated into the sample cell by means of syringes via 25 individual injections, and the amount of each injection was 10 μL. The first injection of 10 μL was ignored in the final data analysis. The contents of the sample cell were stirred throughout the experiment at 200 rpm to ensure thorough mixing. Raw data were obtained as a plot of heat (μJ) against the injection number and featured a series of peaks for each injection. These raw data peaks were transformed using the instrument's software to obtain a plot of enthalpy change per mole of injectant (ΔH0, kJ mol−1) against the molar ratio. Control experiments included the titration of (+)-catechin solution into buffer, buffer into HSA, and buffer into buffer, and controls were repeated for the same HSA concentration used. The last two controls resulted in small and equal enthalpy changes for each successive injection of buffer and, therefore, were not further considered in the data analysis.38 Corrected data refer to experimental data after subtraction of the (+)-catechin from buffer control data. Estimated binding parameters were obtained from ITC data using NanoAnalyze software provided by the manufacturer. Fitting the data according to the independent binding model resulted in the stoichiometry of binding (n), the equilibrium binding constant (K), and enthalpy of complex formation (ΔH0). The standard changes in free energy (ΔG0) and entropy (ΔS0) are calculated using the following equations:| | ΔG0 = RT![[thin space (1/6-em)]](https://www.rsc.org/images/entities/char_2009.gif) ln ln![[thin space (1/6-em)]](https://www.rsc.org/images/entities/char_2009.gif) K K | (1) |
2.3. Fluorescence measurements
The fluorescence measurements were performed on a Cary Eclipse fluorescence spectrophotometer (VARIAN, USA) equipped with a 1.0 cm quartz cell and a thermostat bath. The HSA concentration was kept at 2 × 10⁻⁶ mol L−1. The excitation and emission slit widths were fixed at 5 nm. The excitation wavelength was set at 280 nm (excitation of the Trp and Tyr), and the emission spectra were read at 300–450 nm at a scan rate of 100 nm min−1. In the site marker competitive experiment, the (+)-catechin was gradually added to the solution of HSA and site markers held in equimolar concentrations (2 × 10⁻⁶ mol L−1). The site markers used were warfarin for site I and ibuprofen for site II.
The fluorescence measurements are hindered by the inner-filter effect. The inner filter effect is divided into the “primary inner-filter effect”, which is caused by the absorption of exciting light such that a less intense light flux reaches each subsequent layer of the solution than the previous one, and the “secondary inner-filter effect”, which is caused by the reabsorption of fluorescence.39 This effect often leads to unreliable results. Thus it is very important to subtract such an effect from the raw quenching data.
In the recent paper, Alexander V. Fonin et al. proposed a method of accurate determination of the corrected fluorescence intensity.40 This approach is especially easy to use if the experiment is performed using a Cary Eclipse spectrofluorimeter. The Cary Eclipse spectrofluorimeter has horizontal slits, the light fluxes configuration provide the coincidence of the area illuminated by the excitation light with the area, from which the fluorescence light is collected. The observed total fluorescence intensity Fobsd(λex) is proportional to the fraction of exciting light absorbed by the solution (1 − 10−AΣ):
| |  | (3) |
Here,
I0(
λex) is the intensity of the excitation light at
λex;
k′ is a proportionality factor,
k =
k′
I0(
λex);
AΣ is the total absorbance of the exciting light in the solution;
AΣ = ∑
AFL,i +
AABS,
AFL,i and
qi are the absorbance and fluorescence quantum yield of the
i-th fluorescent component, respectively; and
AABS is the total absorbance of the nonfluorescent components. In the simplest case (
AABS = 0,
i = 1),
AΣ =
AFL, and consequently,
eqn (3) will become the following:
| | | Fobsd(λex) = k(1 − 10−AFL)q | (4) |
It is easy to show that fluorescence intensity of a solution can be presented as a linear function of
AFL with a slope of
q:
| | | Fcor(λex) = Fobsd(λex)/W = kAFLq | (5) |
Here,
W is a correction factor:
| |  | (6) |
Here,
Fcor(
λex) and
Fobsd(
λex) are the corrected and observed fluorescence intensities, respectively, the fluorescence intensity utilized in this study is the corrected intensity according to
eqn (5).
2.4. Absorbance measurements
UV-vis absorption spectra were recorded using a TU-1810 spectrophotometer (Puxi Analytic Instrument Ltd, Beijing, China) equipped with 1.0 cm quartz cells at 298 K. The solutions of the blank buffer and sample were placed in the reference and sample cuvettes, respectively.
2.5. Circular dichroism (CD) measurements
The CD measurements were carried out on a Jasco J-715 spectropolarimeter under constant nitrogen flush. For measurements in the far-UV region (190–260 nm), a quartz cell with a path length of 0.2 cm was used. Three scans were accumulated in continuous scan mode and a scan speed of 200 nm min−1 with data being collected at 0.2 nm and a response time of 2 s. The sample temperature was maintained at 298 K. The protein concentration was fixed to 2.0 × 10⁻⁶ mol L−1 and the (+)-catechin concentration used was 2.0 × 10⁻⁶ mol L−1 in phosphate buffer (PBS, 0.01 mol L−1), pH 7.40. All observed CD spectra were baseline subtracted for phosphate buffer (pH 7.40), and results were taken as CD ellipticity in mdeg.
3. Results and discussion
We prepared the stock solutions of HSA and (+)-catechin. The stock solution of HSA was prepared by dissolving the solid HSA in 0.01 mol L−1 phosphate buffer at pH 7.40, and was stored at 0–4 °C in the dark. The stock solution of (+)-catechin was prepared and used immediately. The present study focused on the interaction of (+)-catechin with HSA by ITC and various spectroscopic techniques.
3.1. Thermodynamic parameters and binding mode
A representative calorimetric titration profile of 7 × 10⁻³ mol L−1 (+)-catechin with 6 × 10⁻⁴ mol L−1 HSA at pH 7.40 and 298 K is shown in Fig. 1A. The thermodynamic parameters for the interaction of (+)-catechin with HSA obtained from ITC are listed in Table 1. Each peak in the binding isotherm represents a single injection of the (+)-catechin into the HSA solution. The exothermicity of the calorimetry peaks in Fig. 1A is believed to be due to the strong interaction between (+)-catechin and HSA. As the sites available on HSA become progressively occupied during titration, the exothermicity of the peaks decreases and eventually saturates. Fig. 1B shows the calorimetric titration profile of 7 × 10⁻³ mol L−1 (+)-catechin with buffer at pH 7.40 and 298 K. The inset of Fig. 1B corresponds to the plot of enthalpy change (ΔH0) against the [(+)-catechin]/[HSA] molar ratio. The solid smooth line represents the best fit of the experimental data using the independent binding site model with the stoichiometric binding number (n), association constant (K), and enthalpy change (ΔH0) of 1.39, 1.21 × 10⁴ mol−1 L and −30.9 kJ mol−1, respectively. The free energy change (ΔG0) and the entropy change (ΔS0) evaluated from eqn (1) and (2) is −23.0 kJ mol−1 and −26.5 J mol−1 K−1, respectively.
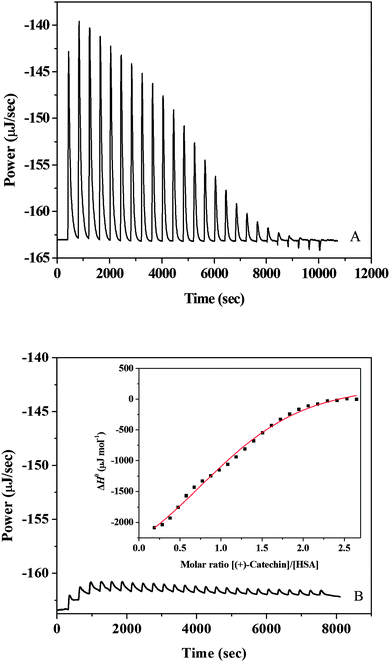 |
| | Fig. 1 (A) Raw data for the titration of 7 × 10⁻³ mol L−1 (+)-catechin with 6 × 10⁻⁴ mol L−1 HSA at pH 7.40 and 298 K, showing the calorimetric response as successive injections of (+)-catechin are added to the sample cell. (B) Raw data for the titration of 7 × 10⁻³ mol L−1 (+)-catechin with buffer at pH 7.40 and 298 K. The inset corresponds to integrated heat profile of the calorimetric titration shown in panel A. The solid line represents the best nonlinear least-squares fit to the independent binding sites model. | |
Table 1 Thermodynamic parameters for the interaction of (+)-catechin with HSA obtained from ITC at 298 K and pH 7.40
|
T (K) |
K (×104 L mol−1) |
n
|
ΔH0 (kJ mol−1) |
ΔG0 (kJ mol−1) |
ΔS0 (J mol−1 K−1) |
| 298 |
1.21 ± 0.52 |
1.39 ± 0.11 |
−30.9 ± 3.42 |
−23.0 ± 1.14 |
−26.5 ± 7.65 |
The association constant (K) between (+)-catechin and HSA is moderate compared to other strong protein–ligand complexes with binding constants ranging from 107–108 L mol−1.41 From the point of pharmacokinetics, the moderate affinity of (+)-catechin for HSA leads to a faster diffusion rate in the circulatory system to reach its target site.42 The value of the stoichiometric binding number n equals 1.39, suggesting that the average molar ratio of (+)-catechin to HSA is 1.39![[thin space (1/6-em)]](https://www.rsc.org/images/entities/char_2009.gif) :
:![[thin space (1/6-em)]](https://www.rsc.org/images/entities/char_2009.gif) 1.43 The negative values of free energy (ΔG0) and enthalpy (ΔH0) support that the binding of (+)-catechin to HSA is spontaneous and exothermic. Ross and Subramanian44 have characterized the sign and magnitude of the thermodynamic parameter associated with various individual kinds of interaction which may take place in the protein association process. The negative entropy (ΔS0) and negative enthalpy (ΔH0) values of the (+)-catechin–HSA system indicate that the major driving forces are hydrogen bonding and van der Waals forces. Negative enthalpy could be due to immobilization of the ligand which is not sufficiently counteracted by liberation of bound water. By the eqn (2), the change of Gibbs free energy (ΔG0) is the comprehensive embodiment of the changes of enthalpy (ΔH0) and entropy (ΔS0). The binding of (+)-catechin to HSA is driven by favorable enthalpy and unfavorable entropy.
1.43 The negative values of free energy (ΔG0) and enthalpy (ΔH0) support that the binding of (+)-catechin to HSA is spontaneous and exothermic. Ross and Subramanian44 have characterized the sign and magnitude of the thermodynamic parameter associated with various individual kinds of interaction which may take place in the protein association process. The negative entropy (ΔS0) and negative enthalpy (ΔH0) values of the (+)-catechin–HSA system indicate that the major driving forces are hydrogen bonding and van der Waals forces. Negative enthalpy could be due to immobilization of the ligand which is not sufficiently counteracted by liberation of bound water. By the eqn (2), the change of Gibbs free energy (ΔG0) is the comprehensive embodiment of the changes of enthalpy (ΔH0) and entropy (ΔS0). The binding of (+)-catechin to HSA is driven by favorable enthalpy and unfavorable entropy.
3.2. Effect of (+)-catechin on HSA fluorescence
Fluorescence emission spectra of individual (+)-catechin were recorded at an excitation wavelength of 280 nm (Fig. 2A). (+)-Catechin possessed intrinsic fluorescence and displayed the spectra with an emission maximum of 313 nm. The observed wavelength of their emission maximum is consistent with the literature.25Fig. 2B shows the fluorescence emission spectra obtained for HSA at pH 7.40 with the addition of (+)-catechin. It can be seen that the fluorescence intensity of HSA decreased in the presence of (+)-catechin, indicating that the binding of (+)-catechin to HSA quenched the intrinsic fluorescence of HSA.45 Furthermore, a small red shift (from 346 to 350 nm) is observed with increasing (+)-catechin concentration, which suggests that the fluorophores of HSA are placed in a more hydrophilic environment after the addition of (+)-catechin.46
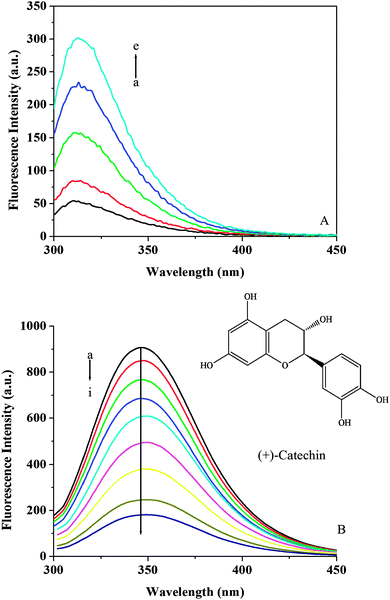 |
| | Fig. 2 (A) Emission spectra of (+)-catechin at 298 K and pH 7.40. c((+)-catechin)/10−4 mol L−1, (a–e) from 0 to 1.2. (B) Emission spectra of HSA in the presence of different concentrations of (+)-catechin at 298 K and pH 7.40. c(HSA) = 2 × 10⁻⁶ mol L−1; c((+)-catechin)/10−4 mol L−1, (a–i) from 0 to 1.8. The inset corresponds to the molecular structure of (+)-catechin. | |
3.3. Fluorescence quenching mechanisms
The different mechanisms of quenching are usually classified as either dynamic quenching or static quenching. For fluorescence quenching, the decrease in intensity is usually described by the Stern–Volmer equation:47| | | F0/F = 1 + kqτ0[Q] = 1 + KSV[Q] | (7) |
where F0 and F represent the steady-state fluorescence intensities in the absence and presence of a quencher, respectively. kq is the bimolecular quenching constant, τ0 is the life time of the fluorescence in the absence of a quencher and τ0 of HSA ≈ 10−8 s,48 [Q] is the concentration of the quencher, and KSV is the Stern–Volmer quenching constant. Fig. 3 shows the Stern–Volmer plots for the HSA fluorescence quenching by (+)-catechin. The values of KSV and kq for the interaction of (+)-catechin with HSA at four different temperatures are shown in Table 2. In the present case, a linear Stern–Volmer plot is observed for (+)-catechin, which means that only one type of quenching mechanism occurs (dynamic or static). Dynamic and static quenching can be distinguished by their different dependence on temperature. For dynamic quenching, higher temperatures result in faster diffusion and larger amounts of collisional quenching. The quenching constant increases with increasing temperature, but the reverse effect would be observed for static quenching.49 The results show that the KSV values decrease with increasing temperature, and the values of kq are greater than the limiting diffusion rate constant of the biomolecule (2 × 10¹⁰ L mol−1 s−1) (ref. 50) (Table 2), which suggests that the quenching mechanism of HSA by (+)-catechin is not initiated by dynamic quenching but by static quenching.45
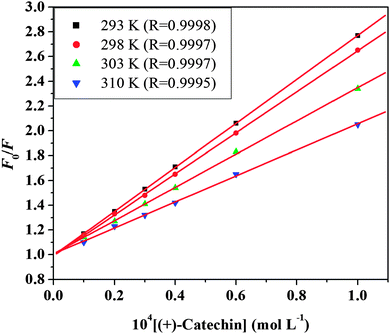 |
| | Fig. 3 Stern–Volmer plots of HSA fluorescence quenched by (+)-catechin at four different temperatures and pH 7.40. | |
Table 2 The quenching constants (KSV), bimolecular quenching constants (kq), binding constants (Ka) and the number of binding sites (n) of the (+)-catechin–HSA system at different temperatures
|
T (K) |
Eqn (7)
|
Eqn (8)
|
|
K
SV (L mol−1) |
k
q (L mol−1 s−1) |
S.D. |
K
a (L mol−1) |
n
|
S.D. |
| S.D. is the standard deviation. |
| 293 |
1.78 × 10⁴ |
1.78 × 10¹² |
0.0029 |
1.59 × 10⁴ |
1.34 |
0.0199 |
| 298 |
1.65 × 10⁴ |
1.65 × 10¹² |
0.0066 |
1.51 × 10⁴ |
1.37 |
0.0198 |
| 303 |
1.34 × 10⁴ |
1.34 × 10¹² |
0.0105 |
1.36 × 10⁴ |
1.45 |
0.0212 |
| 310 |
1.04 × 10⁴ |
1.04 × 10¹² |
0.0121 |
1.28 × 10⁴ |
1.49 |
0.0493 |
3.4. Binding parameters
The binding parameters are helpful in the study of pharmacokinetics. When small molecules bind independently to a set of equivalent sites on a macromolecule and the equilibrium between the free and the bound molecules has been reached, the fluorescence intensities obey the following equation:51,52| |  | (8) |
F0 and F are the fluorescence intensities before and after the addition of the quencher, respectively. Ka is the apparent binding constant to a set of sites, and n is the average number of binding sites per HSA. [Q] and [P] are the total quencher concentration and the total protein concentration, respectively. By the plot of log(F0 − F)/F vs. log(1/([Q] − (F0 − F)[P]/F0)), the number of binding sites n and the binding constant Ka can be obtained. The results for (+)-catechin at four different temperatures are given in Fig. 4 and Table 2. Binding parameters calculated from eqn (8) show that (+)-catechin binds to HSA with the binding affinities of the order 104 L mol−1 and the binding sites n equal to 1.37 at 298 K. These results are consistent with the results of ITC studies.
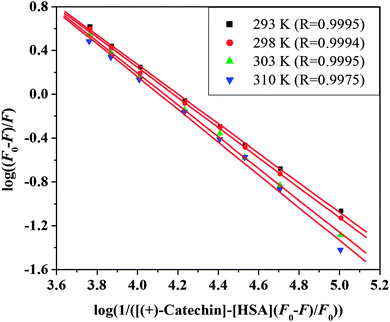 |
| | Fig. 4 The plots of log(F0 − F)/F vs. log(1/([Q] − (F0 − F)[P]/F0)) for (+)-catechin–HSA system at four different temperatures and pH 7.40. | |
3.5. The equilibrium fraction of unbound (+)-catechin
The equilibrium fraction of unbound (+)-catechin fu is an important pharmacokinetic parameter, which influences (+)-catechin elimination and distribution in the body. Generally, the free (+)-catechin is available for diffusion and transport across cell membranes to reach the target site.53
For a binding equilibrium system, bound and free (+)-catechin can be calculated according to the Scatchard model. The Scatchard plot is defined by eqn (9) and (10):
| |  | (9) |
| |  | (10) |
where
r represents the number of moles of bound (+)-catechin ([
Qb]) per mole of HSA,
n represents the number of binding sites on the HSA molecule,
Kb is the binding constant, [
Qf] is the concentration of free (+)-catechin, and [
P] is the total concentration of HSA. The unbound (+)-catechin fraction
fu is defined by
eqn (11):
| |  | (11) |
where [
Q] is the total concentration of (+)-catechin. Substituting [
Qf] from
eqn (9) in
eqn (11), we obtain the
eqn (12) which can be used to calculate the equilibrium fraction of unbound (+)-catechin.
| |  | (12) |
where
Kd is the equilibrium dissociation constant and
Kd = 1/
Kb. The
eqn (12) agrees very well with the equation reported by Leonid M. Berezhkovskiy.
54
The Scatchard plot for (+)-catechin which relates the value of r/[Qf] to the value of r is presented in Fig. 5A. A plot of the equilibrium fraction of unbound (+)-catechin fu at different ratios is presented in Fig. 5B. The Scatchard plot is a straight line (Fig. 5A), which means that the (+)-catechin binds independently to a set of equivalent sites on HSA and supports the use of the independent binding site model to fit the data obtained from ITC. As can be seen from the Fig. 5B, fu > 90% at the investigated concentration range and increases with the increase of (+)-catechin concentration. The result shows that the concentration of free (+)-catechin in plasma is enough to be stored and transported from the circulatory system to reach its target site to provide their therapeutic effects.
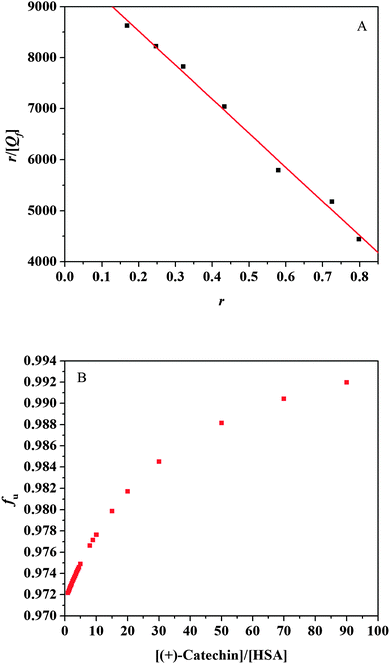 |
| | Fig. 5 (A) Scatchard plots of HSA interaction with (+)-catechin at 298 K and pH 7.40. (B) The equilibrium fraction of unbound (+)-catechin fu for different [(+)-catechin]/[HSA] ratios at 298 K and pH 7.40. | |
3.6. Site-selective binding of (+)-catechin on HSA
The drug competition for binding sites on serum albumin can also affect the free and bound forms of (+)-catechin. Therefore, it is important to identify the binding site of (+)-catechin in HSA. As mentioned above, HSA has two ligand-specific binding sites namely Sudlow's binding sites I (in subdomains IIA) and II (in subdomains IIIA).3 Warfarin, an anticoagulant drug, and ibuprofen, a non-steroidal anti-inflammatory agent, have been considered as stereotypical ligands for Sudlow's site I and II, respectively.55 To identify the (+)-catechin binding site on HSA, the competitive binding experiment was carried out, using warfarin and ibuprofen as site markers. Then information of the binding site that (+)-catechin binds to can be obtained by monitoring the changes of the fluorescence of HSA after binding (+)-catechin, in the presence of warfarin and ibuprofen. As shown in Fig. 6A and B, with the addition of a site marker (warfarin or ibuprofen) into HSA, the fluorescence intensity is lower than that of without a site marker. To facilitate the comparison of the influence of warfarin and ibuprofen on the binding of (+)-catechin to HSA, the binding constant in the presence of site markers was analyzed using the eqn (8) (Fig. 6C and Table 3). The binding constant is surprisingly variable in the presence of warfarin, while a smaller influence in the presence of ibuprofen (somewhat lower than with isolated HSA). The result indicates that the binding site of (+)-catechin is mainly located within site I of HSA.
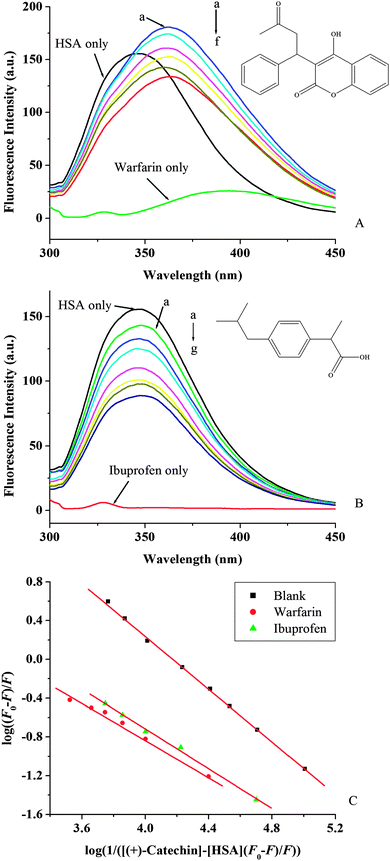 |
| | Fig. 6 Effect of site marker to (+)-catechin–HSA system (A, B) at 298 K and pH 7.40; λex = 280 nm. c(warfarin) = c(ibuprofen) = c(HSA) = 2 × 10⁻⁶ mol L−1; (A): c((+)-catechin)/(10−4 mol L−1) (a–f) from 0 to 1.8. (B): c((+)-catechin)/(10−4 mol L−1) (a–g) from 0 to 3.0. The insets correspond to the molecular structures of site marker warfarin (A) and ibuprofen (B). (C) The plots of log(F0 − F)/F vs. log(1/([Q] − (F0 − F)[P]/F0)) of site marker competitive experiments of (+)-catechin–HSA system. | |
Table 3 Binding constants of competitive experiments for the interaction of (+)-catechin with HSA at 298 K and pH 7.40
| System |
Site marker |
K
a (L mol−1) |
n
|
R
|
S.D.b |
|
R is the correlation coefficient.
S.D. is the standard deviation.
|
|
|
—(blank) |
1.51 × 10⁴ |
1.37 |
0.9994 |
0.0198 |
| (+)-catechin–HSA |
Warfarin |
1.32 × 10³ |
0.93 |
0.9946 |
0.0336 |
|
|
Ibuprofen |
2.00 × 10³ |
1.03 |
0.9980 |
0.0281 |
3.7. Investigation of HSA conformational changes
To explore the effect of (+)-catechin on the conformation changes of HSA, UV-vis absorption spectra and CD spectroscopy were performed.
The UV-vis absorption technique can be used to explore the structural changes of protein and to investigate protein–ligand complex formation.55 The UV-vis absorption spectra of (+)-catechin are shown in Fig. 7A. (+)-Catechin has two absorption peaks, a strong absorption peak at about 207 nm, a weak absorption peak at about 280 nm. The UV-vis absorption spectra of HSA in the absence and presence of (+)-catechin obtained by utilizing the mixture of (+)-catechin and phosphate buffer at the same concentration as the reference solution are shown in Fig. 7B. In the UV-vis absorption spectra at about 210 nm represents the α-helical structure of HSA.56 With addition of (+)-catechin, the intensity peak of HSA at 213 nm decreases with a red shift. These results can be explained that the interaction between (+)-catechin and HSA leads to the loosening and unfolding of the protein skeleton and decreases the hydrophobicity of the microenvironment of HSA.57
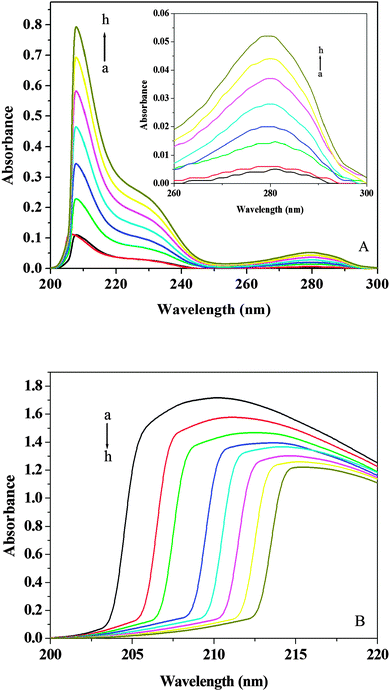 |
| | Fig. 7 (A) UV-vis spectra of (+)-catechin at 298 K and pH 7.40. (B) UV-vis spectra of HSA in presence of different concentrations of (+)-catechin at 298 K and pH 7.40. c(HSA) = 2 × 10⁻⁶ mol L−1; c((+)-catechin)/(10−5 mol L−1) (a–h) from 0 to 1.4. | |
CD is a sensitive technique to monitor the conformational changes in the protein. The CD spectra of HSA in the absence and presence of (+)-catechin are shown in Fig. 8. As shown in Fig. 8, CD spectra of HSA exhibited two negative bands at 208 and 222 nm, which is characteristic of the typical α-helix structure of protein.58 The binding of (+)-catechin to HSA causes only a decrease in negative ellipticity at all wavelengths of the far-UV CD without any significant shift of the peaks, which clearly indicates the changes in the protein secondary structure, and a decrease of the α-helix content in protein.59 The percentage of the α-helix can be calculated using the following equation:60
| |  | (13) |
where MRE
208 is the observed mean residue ellipticity (MRE) value at 208 nm, 4000 is the MRE of the β-form and random coil conformation cross at 208 nm, and 33
![[thin space (1/6-em)]](https://www.rsc.org/images/entities/char_2009.gif)
000 is the MRE value of the pure α-helix at 208 nm.
| |  | (14) |
where
Cp is the molar concentration of the protein (HSA),
n is the number of amino acid residues (585 for HSA) and
l is the path length (0.2 cm). The α-helix content of protein was calculated from
eqn (13) and (14). It can be calculated that the native HSA solution has 56.1% of α-helix, while α-helix content of HSA decreases to 48.9% with the addition of (+)-catechin in the mole concentration ratios of 1
![[thin space (1/6-em)]](https://www.rsc.org/images/entities/char_2009.gif)
:
![[thin space (1/6-em)]](https://www.rsc.org/images/entities/char_2009.gif)
1. The result suggests the occurrence of conformational change at the secondary structural level in the reaction between (+)-catechin and HSA.
61
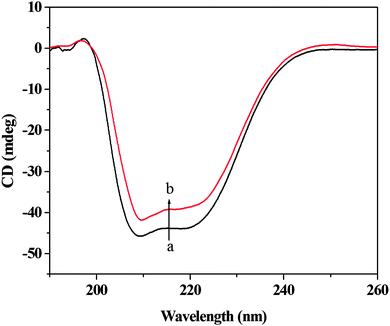 |
| | Fig. 8 Circular dichroism spectra of HSA in the absence and presence of (+)-catechin. c(HSA) = 2.0 × 10⁻⁶ mol L−1; the molar ratio of (+)-catechin to HSA is 1![[thin space (1/6-em)]](https://www.rsc.org/images/entities/char_2009.gif) : :![[thin space (1/6-em)]](https://www.rsc.org/images/entities/char_2009.gif) 1. 1. | |
4. Conclusions
The binding mechanism of (+)-catechin interacting with human serum albumin was investigated using isothermal titration calorimetry as well as several spectroscopic techniques under simulated physiological conditions. Data from isothermal titration calorimetry experiments suggest that the binding of (+)-catechin to human serum albumin is driven by favorable enthalpy and unfavorable entropy, and the major driving forces are hydrogen bonding and van der Waals force. The obtained binding constant for (+)-catechin with human serum albumin is in the intermediate range so that it is not too low to prevent efficient distribution and is not so high to lead to decreased plasma concentration. Fluorescence experiments suggest that (+)-catechin can bind to human serum albumin and quench the fluorescence of human serum albumin. The quenching mechanism is of static type and due to the formation of a ground state complex. (+)-Catechin binds to human serum albumin with the binding affinities of the order 104 L mol−1. These results are consistent with the results of isothermal titration calorimetry studies. The equilibrium fraction of unbound (+)-catechin fu > 90% in the investigated concentration range shows that (+)-catechin can be stored and transported from the circulatory system to reach its target site. The site marker competitive experiment demonstrates that (+)-catechin is mainly located within site I of human serum albumin. UV-visible absorption spectra find that the interaction between (+)-catechin and human serum albumin decreases the hydrophobicity of the microenvironment of the tyrosine and tryptophan residues. The results of circular dichroism experiments suggest that (+)-catechin indeed exerts some influence on the secondary structure of human serum albumin and finally the reduction of the protein α-helix structure.
Acknowledgements
This work was supported by the National Natural Science Foundation of China (21173071) and the Research Fund for the Doctoral Program of Higher Education of China (20114104110002).
References
- U. Kragh-Hansen, Pharmacol. Rev., 1981, 33, 17–53 CAS.
- X. M. He and D. C. Carter, Nature, 1992, 358, 209–215 CrossRef CAS PubMed.
- G. Sudlow, D. F. Birkett and D. N. Wade, Mol. Pharmacol., 1975, 11, 824–832 CAS.
- K. Aidas, J. M. H. Olsen, J. Kongsted and H. Ågren, J. Phys. Chem. B, 2013, 117, 2069–2080 CrossRef CAS PubMed.
- F. Samari, M. Shamsipur, B. Hemmateenejad, T. Khayamian and S. Gharaghani, Eur. J. Med. Chem., 2012, 54, 255–263 CrossRef CAS PubMed.
- X. Liu and Y. Du, Eur. J. Med. Chem., 2010, 45, 4043–4049 CrossRef CAS PubMed.
- N. Zaidi, E. Ahmad, M. Rehan, G. Rabbani, M. R. Ajmal, Y. Zaidi, N. Subbarao and R. H. Khan, J. Phys. Chem. B, 2013, 117, 2595–2604 CrossRef CAS PubMed.
- N. Bijari, Y. Shokoohinia, M. R. Ashrafi-Kooshk, S. Ranjbar, S. Parvaneh, M. Moieni-Arya and R. Khodarahmi, J. Lumin., 2013, 143, 328–336 CrossRef CAS.
- N. Shahabadi, A. Khorshidi and N. H. Moghadam, Spectrochim. Acta, Part A, 2013, 114, 627–632 CrossRef CAS PubMed.
- Y. Zhang, S. Shi, X. Chen, W. Zhang, K. Huang and M. Peng, J. Agric. Food Chem., 2011, 59, 8499–8506 CrossRef CAS PubMed.
- M. L. Hall, W. L. Jorgensen and L. Whitehead, J. Chem. Inf. Model., 2013, 53, 907–922 CrossRef CAS PubMed.
- Y. Yue, J. Liu, J. Fan and X. Yao, J. Pharm. Biomed. Anal., 2011, 56, 336–342 CrossRef CAS PubMed.
- T. Kim, H. J. Choi, S. H. Eom, J. Lee and T. H. Kim, Bioorg. Med. Chem. Lett., 2014, 24, 1621–1624 CrossRef CAS PubMed.
- C. W. How, J. A. Teruel, A. Ortiz, M. F. Montenegro, J. N. Rodríguez-López and F. J. Aranda, Biochim. Biophys. Acta, 2014, 1838, 1215–1224 CrossRef CAS PubMed.
- S. B. Jadhav, R. S. Singhal and L. Gum, Food Chem., 2014, 150, 9–16 CrossRef CAS PubMed.
- Y. Cui, Y. J. Oh, J. Lim, M. Youn, I. Lee, H. K. Pak, W. Park, W. Jo and S. Park, Food Microbiol., 2012, 29, 80–87 CrossRef CAS PubMed.
- J. Steinmann, J. Buer, T. Pietschmann and E. Steinmann, Br. J. Pharmacol., 2013, 168, 1059–1073 CrossRef CAS PubMed.
- J. M. Song, H. Lee and B. L. Seong, Antiviral Res., 2005, 68, 66–74 CrossRef CAS PubMed.
- S. Li, T. Hattori and E. N. Kodama, Antiviral Chem. Chemother., 2011, 21, 239–243 CrossRef CAS PubMed.
- L. Trnková, I. Boušová, V. Staňková and J. Dršata, J. Mol. Struct., 2011, 985, 243–250 CrossRef.
- N. Yasarawan, K. Thipyapong, S. Sirichai and V. Ruangpornvisuti, J. Mol. Struct., 2013, 1047, 344–357 CrossRef CAS.
- C. Cabrera, R. Artacho and R. Giménez, J. Am. Coll. Nutr., 2006, 25, 79–99 CrossRef CAS PubMed.
- T. L. Weir, H. P. Bais and J. M. Vivanco, J. Chem. Ecol., 2003, 29, 2397–2412 CrossRef CAS PubMed.
- T. Ishii, T. Mori, T. Ichikawa, M. Kaku, K. Kusaka, Y. Uekusa, M. Akagawa, Y. Aihara, T. Furuta, T. Wakimoto, T. Kan and T. Nakayama, Bioorg. Med. Chem., 2010, 18, 4892–4896 CrossRef CAS PubMed.
- A. Papadopoulou, R. J. Green and R. A. Frazier, J. Agric. Food Chem., 2005, 53, 158–163 CrossRef CAS PubMed.
- S. Soares, N. Mateus and V. D. Freitas, J. Agric. Food Chem., 2007, 55, 6726–6735 CrossRef CAS PubMed.
- T. K. Maiti, K. S. Ghosh and S. Dasgupta, Proteins: Struct., Funct., Bioinf., 2006, 64, 355–362 CrossRef CAS PubMed.
- A. Nozaki, M. Hori, T. Kimura, H. Ito and T. Hatano, Chem. Pharm. Bull., 2009, 57, 224–228 CrossRef CAS PubMed.
- M. Peng, S. Shi and Y. Zhang, Spectrochim. Acta, Part A, 2012, 85, 190–197 CrossRef CAS PubMed.
- A. Diniz, L. Escuder-Gilabert, N. P. Lopes, R. M. Villanueva-Camañas, S. Sagrado and M. J. Medina-Hernández, Anal. Bioanal. Chem., 2008, 391, 625–632 CrossRef CAS PubMed.
- D. Roy, S. Dutta, S. S. Maity, S. Ghosh, A. S. Roy, K. S. Ghosh and S. Dasgupta, J. Lumin., 2012, 132, 1364–1375 CrossRef CAS.
- D. Burnouf, E. Ennifar, S. Guedich, B. Puffer, G. Hoffmann, G. Bec, F. Disdier, M. Baltzinger and P. Dumas, J. Am. Chem. Soc., 2012, 134, 559–565 CrossRef CAS PubMed.
- C. Poncet-Legrand, C. Gautier, V. Cheynier and A. Imberty, J. Agric. Food Chem., 2007, 55, 9235–9240 CrossRef CAS PubMed.
- Y. Liang, J. Iran. Chem. Soc., 2006, 3, 209–219 CrossRef CAS.
- A. Papadopoulou and R. A. Frazier, Trends Food Sci. Technol., 2004, 15, 186–190 CrossRef CAS.
- R. A. Frazier, A. Papadopoulou and R. J. Green, J. Pharm. Biomed. Anal., 2006, 41, 1602–1605 CrossRef CAS PubMed.
-
D. Carter and J. X. Ho, Adv. Protein Chem., Academic Press, New York, 1994, vol. 45, pp. 153–203 Search PubMed.
- M. A. Dobreva, R. A. Frazier, I. Mueller-Harvey, L. A. Clifton, A. Gea and R. J. Green, Biomacromolecules, 2011, 12, 710–715 CrossRef CAS PubMed.
- M. Kubista, R. Sjöback, S. Eriksson and B. Albinsson, Analyst, 1994, 119, 417–419 RSC.
- A. V. Fonin, A. I. Sulatskaya, I. M. Kuznetsova and K. K. Turoverov, PLoS One, 2014, 9(7), e103878 Search PubMed.
- Z. Cheng, J. Lumin., 2012, 132, 2719–2729 CrossRef CAS.
- S. R. Feroz, S. B. Mohamad, N. Bujang, S. N. A. Malek and S. Tayyab, J. Agric. Food Chem., 2012, 60, 5899–5908 CrossRef CAS PubMed.
- Z. Zeng, J. Patel, S. H. Lee, M. McCallum, A. Tyagi, M. Yan and K. J. Shea, J. Am. Chem. Soc., 2012, 134, 2681–2690 CrossRef CAS PubMed.
- P. D. Ross and S. Subramanian, Biochemistry, 1981, 20, 3096–3102 CrossRef CAS PubMed.
- H. Shen, Z. Gu, K. Jian and J. Qi, J. Pharm. Biomed. Anal., 2013, 75, 86–93 CrossRef CAS PubMed.
- F. Samari, B. Hemmateenejad, M. Shamsipur and M. Rashidi, Inorg. Chem., 2012, 51, 3454–3464 CrossRef CAS PubMed.
-
J. R. Lakowicz, Principles of Fluorescence Spectroscopy, Springer Science & Business Media, New York, 3rd edn 2006 Search PubMed.
- J. R. Lakowicz and G. Weber, Biochemistry, 1973, 12, 4161–4170 CrossRef CAS PubMed.
- G. W. Zhang, L. Wang and J. H. Pan, J. Agric. Food Chem., 2012, 60, 2721–2729 CrossRef CAS PubMed.
- W. R. Ware, J. Phys. Chem., 1962, 66, 455–458 CrossRef CAS.
- S. Bi, L. Ding, Y. Tian, D. Song, X. Zhou, X. Liu and H. Zhang, J. Mol. Struct., 2004, 703, 37–45 CrossRef CAS.
- S. Bi, D. Song, Y. Tian, X. Zhou, Z. Liu and H. Zhang, Spectrochim. Acta, Part A, 2005, 61, 629–636 CrossRef PubMed.
- O. K. Abou-Zied and O. I. K. Al-Shihi, J. Am. Chem. Soc., 2008, 130, 10793–10801 CrossRef CAS PubMed.
- L. M. Berezhkovskiy, J. Pharm. Sci., 2007, 96, 249–257 CrossRef CAS PubMed.
- Z. X. Chi and R. T. Liu, Biomacromolecules, 2011, 12, 203–209 CrossRef CAS PubMed.
- A. N. Glazer and E. L. Smith, J. Biol. Chem., 1961, 236, 2942–2947 CAS.
- X. R. Pan, P. F. Qin, R. T. Liu and J. Wang, J. Agric. Food Chem., 2011, 59, 6650–6656 CrossRef CAS PubMed.
- M. Bhattacharya, N. Jain and S. Mukhopadhyay, J. Phys. Chem. B, 2011, 115, 4195–4205 CrossRef CAS PubMed.
- X. L. Han, F. F. Tian, Y. S. Ge, F. L. Jiang, L. Lai, D. W. Li, Q. L. Yu, J. Wang, C. Lin and Y. Liu, J. Photochem. Photobiol., B, 2012, 109, 1–11 CrossRef CAS PubMed.
- A. Bhogale, N. Patel, J. Mariam, P. M. Dongre, A. Miotello and D. C. Kothari, Colloids Surf., B, 2014, 113, 276–284 CrossRef CAS PubMed.
- S. Cao, B. Liu, Z. Li and B. Chong, J. Lumin., 2014, 145, 94–99 CrossRef CAS.
|
| This journal is © The Royal Society of Chemistry and the Centre National de la Recherche Scientifique 2015 |
Click here to see how this site uses Cookies. View our privacy policy here. ![[thin space (1/6-em)]](https://www.rsc.org/images/entities/char_2009.gif) 700 mol−1 L cm−1.37 The reported pH was determined on a PHS-2C pH-meter (Shanghai DaPu Instruments Co., Ltd, Shanghai, China) at ambient temperature. Sample masses were accurately weighed on a microbalance (Sartorius, BP211D) with a resolution of 0.01 mg. All other reagents were of analytical reagent grade and were used as purchased without further purification.
700 mol−1 L cm−1.37 The reported pH was determined on a PHS-2C pH-meter (Shanghai DaPu Instruments Co., Ltd, Shanghai, China) at ambient temperature. Sample masses were accurately weighed on a microbalance (Sartorius, BP211D) with a resolution of 0.01 mg. All other reagents were of analytical reagent grade and were used as purchased without further purification.
![[thin space (1/6-em)]](https://www.rsc.org/images/entities/char_2009.gif) ln
ln![[thin space (1/6-em)]](https://www.rsc.org/images/entities/char_2009.gif) K
K

![[thin space (1/6-em)]](https://www.rsc.org/images/entities/char_2009.gif) :
:![[thin space (1/6-em)]](https://www.rsc.org/images/entities/char_2009.gif) 1.43 The negative values of free energy (ΔG0) and enthalpy (ΔH0) support that the binding of (+)-catechin to HSA is spontaneous and exothermic. Ross and Subramanian44 have characterized the sign and magnitude of the thermodynamic parameter associated with various individual kinds of interaction which may take place in the protein association process. The negative entropy (ΔS0) and negative enthalpy (ΔH0) values of the (+)-catechin–HSA system indicate that the major driving forces are hydrogen bonding and van der Waals forces. Negative enthalpy could be due to immobilization of the ligand which is not sufficiently counteracted by liberation of bound water. By the eqn (2), the change of Gibbs free energy (ΔG0) is the comprehensive embodiment of the changes of enthalpy (ΔH0) and entropy (ΔS0). The binding of (+)-catechin to HSA is driven by favorable enthalpy and unfavorable entropy.
1.43 The negative values of free energy (ΔG0) and enthalpy (ΔH0) support that the binding of (+)-catechin to HSA is spontaneous and exothermic. Ross and Subramanian44 have characterized the sign and magnitude of the thermodynamic parameter associated with various individual kinds of interaction which may take place in the protein association process. The negative entropy (ΔS0) and negative enthalpy (ΔH0) values of the (+)-catechin–HSA system indicate that the major driving forces are hydrogen bonding and van der Waals forces. Negative enthalpy could be due to immobilization of the ligand which is not sufficiently counteracted by liberation of bound water. By the eqn (2), the change of Gibbs free energy (ΔG0) is the comprehensive embodiment of the changes of enthalpy (ΔH0) and entropy (ΔS0). The binding of (+)-catechin to HSA is driven by favorable enthalpy and unfavorable entropy.


![[thin space (1/6-em)]](https://www.rsc.org/images/entities/char_2009.gif) 000 is the MRE value of the pure α-helix at 208 nm.
000 is the MRE value of the pure α-helix at 208 nm.
![[thin space (1/6-em)]](https://www.rsc.org/images/entities/char_2009.gif) :
:![[thin space (1/6-em)]](https://www.rsc.org/images/entities/char_2009.gif) 1. The result suggests the occurrence of conformational change at the secondary structural level in the reaction between (+)-catechin and HSA.61
1. The result suggests the occurrence of conformational change at the secondary structural level in the reaction between (+)-catechin and HSA.61

![[thin space (1/6-em)]](https://www.rsc.org/images/entities/char_2009.gif) :
:![[thin space (1/6-em)]](https://www.rsc.org/images/entities/char_2009.gif) 1.
1.


