Highly phosphorescent green emitting iridium(III) complexes for application in OLEDs†
Jayaraman
Jayabharathi
*,
Venugopal
Thanikachalam
and
Ramalingam
Sathishkumar
Department of Chemistry, Annamalai University, Annamalainagar, 608 002, Tamilnadu, India. E-mail: jtchalam2005@yahoo.co.in; Tel: +91 9443940735
First published on 27th October 2014
Abstract
Phenanthrimidazole based ligands with various substitution patterns have been used as the main ligands for heteroleptic bis-cyclometalated iridium(III) complexes. Two series of complexes have been prepared by changing the ancillary ligand and their electroluminescent properties were studied. The strongly allowed phosphorescence in these complexes is the result of a significant spin–orbit coupling of the iridium center. The absorption at longer wavelengths has been assigned to 1MLCT ← S0 and 3MLCT ← S0 transitions of iridium complexes and the phosphorescence emission maxima range from 558 to 574 nm. The OLEDs with these picolinate complexes exhibit appreciable external quantum efficiencies ranging from 6.5 to 15.6%. Devices based on Ir(tmpmp)2(pic) and Ir(tmpdp)2(pic) show better performance in terms of brightness of 110![[thin space (1/6-em)]](https://www.rsc.org/images/entities/char_2009.gif) 421 cd m−2 and 124
421 cd m−2 and 124![[thin space (1/6-em)]](https://www.rsc.org/images/entities/char_2009.gif) 568 cd m−2 at 18 V, respectively. Devices with Ir(tmpdp)2(pic) show a high power efficiency of 25.6 lm W−1 at 7.0 V and a current efficiency of 47.5 cd A−1 at 8.0 V. Introduction of the dimethylamino group in 2-picolinate complexes, Ir(tmpmp)2(Npic) (ηc − 44.6 cd A−1, 8 V; ηp − 26.0 lm W−1, 7 V) and Ir(mpdp)2(Npic) (ηc − 49.9 cd A−1, 8 V; ηp − 27.2 lm W−1, 7 V), results in a highly phosphorescent green emitter with high electroluminescence efficiency.
568 cd m−2 at 18 V, respectively. Devices with Ir(tmpdp)2(pic) show a high power efficiency of 25.6 lm W−1 at 7.0 V and a current efficiency of 47.5 cd A−1 at 8.0 V. Introduction of the dimethylamino group in 2-picolinate complexes, Ir(tmpmp)2(Npic) (ηc − 44.6 cd A−1, 8 V; ηp − 26.0 lm W−1, 7 V) and Ir(mpdp)2(Npic) (ηc − 49.9 cd A−1, 8 V; ηp − 27.2 lm W−1, 7 V), results in a highly phosphorescent green emitter with high electroluminescence efficiency.
J. Jayabharathi received her MSc, and completed her PhD, in 1994 from Annamalai University. She is a Professor, Department of Chemistry, Annamalai University. Her current research interest focuses on Materials science, OLEDs and their applications. |
V. Thanikachalam received his MSc, and completed his PhD, from Annamalai University. He is a Professor, Department of Chemistry, Annamalai University. His current research interest focuses on Materials science, OLEDs and their applications. |
R. Sathishkumar received his MSc, and completed his MPhil, he is a PhD Research Scholar, Department of Chemistry, Annamalai University. His current research interest focuses on Materials science, OLEDs and their applications. |
1. Introduction
Electroluminescent heavy metal materials, namely iridium, platinum, ruthenium, and osmium complexes, have attracted considerable attention due to their potential applications in full color flat panel displays and solid-state lighting.1–6 Among phosphorescent emitters, the best performing phosphorescent materials were those based on iridium(III) complexes because of their relatively short triplet lifetime and potential high device efficiency. Iridium(III)-based phosphorescent cyclometalated complexes are used as efficient dopants for applications in phosphorescent organic light-emitting diodes (PhOLEDs),7–12 light-emitting electrochemical cells13–16 and chemosensors.17,18 The efficiency, brightness and emission wavelengths of iridium(III) complexes depend strongly on the structure of the cyclometalated ligand. The emission wavelength of the iridium(III) complexes can normally be tuned by changing the electronic nature and the position of the substituents on the ligands.19There is a crucial issue of phase separation between iridium(III) complexes and host materials that influence the doped device performance. This is overcome by increasing the bulkiness of the iridium(III) complexes which improve the dispersibility and thus high efficiency emission. A series of high efficiency iridium(III) complexes have been reported by introducing bulky cyclometalated ligands to effectively suppress the aggregation effect and improve the dispersibility.20–25 Introduction of π-conjugated fluorenyl substituted triarylamine into the cyclometalated ligand improved the performance of the devices and also enhanced the solubility of the materials.21–24 The dispersibility of iridium(III) complexes is also enhanced by modifying the ancillary ligand.26–30 Phenylpyrazole based iridium(III) complexes, Ir(ppz)3n, show deep blue emission at 77 K in CH2Cl2 but a quite poor emission at room temperature.31,32 Their picolinate complex, Ir(ppz)2(pic), shows a relatively stronger green emission (526 nm) at room temperature and the emission color changed from blue (422 nm) to orange red (587 nm) at low temperature (77 K).33 In continuation of our interest in developing efficient green phosphors for application in OLEDs, herein we report the synthesis, characterization and electroluminescence of green emitting Ir(III) complexes containing bulky phenanthrimidazole ligands with picolinic acid (1–4) and 4-N,N-dimethylaminopicolinic acid (5, 6) as ancillary ligands. The emission properties of the synthesised iridium(III) complexes were studied and the device performance was examined for applications in OLEDs. Introduction of the dimethylamino group in 2-picolinate resulted in a highly phosphorescent green emitter with high electroluminescence efficiency.
2. Experimental
2.1. Optical measurements and composition analysis
The 1H and 13C NMR spectra at 400 and 100 MHz, respectively, were obtained at room temperature using a Bruker 400 MHz NMR spectrometer (Bruker biospin, California, USA). The mass spectra of the samples were obtained using a Thermo Fischer LC-Mass spectrometer in fast atom bombardment (FAB) mode. The ultraviolet-visible (UV-vis) spectra of the phosphorescent iridium complexes were measured using a UV-vis spectrophotometer (Perkin Elmer Lambda 35) and corrected for background absorption due to solvent. Photoluminescence (PL) spectra were recorded on a fluorescence spectrometer (Perkin Elmer LS55). The PL quantum yields were measured by comparing phosphorescence intensities (integrated areas) of a standard sample (Coumarin 46) and the unknown sample using the formula, , where Φunk is the phosphorescence quantum yield of the sample, Φstd is the quantum yield of the standard; Iunk and Istd are the integrated emission intensities of the sample and the standard, respectively. Aunk and Astd are the absorbances of the sample and the standard at the excitation wavelength, respectively. ηunk and ηstd are the refractive indexes of the sample and standard solutions, respectively.34–36
Cyclic voltammetry (CV) analysis was performed by using a CHI 630A potentiostat electrochemical analyzer. Measurements of oxidation and reduction were made using 0.1 mol L−1 tetra(n-butyl)ammoniumhexafluorophosphate as the supporting electrolyte, at a scan rate of 0.1 V s−1. The potentials were measured against an Ag/Ag+ (0.01 mol L−1 AgNO3) reference electrode using ferrocene/ferrocenium (CP2Fe/CP2Fe+) as the internal standard. The onset potentials were determined from the intersection of two tangents drawn at the rising current and background current of the cyclic voltammogram. The lifetime was measured using a nanosecond time correlated single photon counting (TCSPC) spectrometer Horiba Fluorocube-01-NL lifetime system with Nano LED (pulsed diode excitation source) as the excitation source and TBX-PS as the detector. DFT calculations were carried out in the gas phase. All calculations were performed using density functional theory (DFT) as implemented with Guassian-03 software package using the Becke3–Lee–Yang–Parr (B3LYP) functional37 supplemented with the LanL2DZ basis set38 and LANL2DZ pseudopotentials were used for iridium metals and 6-31G* for carbon, hydrogen, oxygen, nitrogen and fluoro atoms.
2.2. Device fabrication
The EL devices based on iridium(III) complexes were fabricated by vacuum deposition of the materials at 5 × 10⁻⁶ Torr onto a clean glass precoated with a layer of indium tin oxide (ITO) with a sheet resistance of 20 Ω per square. Prior to use, the ITO surface was cleaned by sonication successively in a detergent solution, acetone, methanol and deionized water. Organic layers were deposited onto the substrate at a rate of 0.1 nm s−1. The thickness of the organic materials and the cathode layers were controlled using a quartz crystal thickness monitor. A series of devices (I–VI) with configuration of an ITO/NPB (30 nm)/iridium complex, CBP (7%) (30 nm)/BCP (10 nm)/Alq3 (40 nm)/Mg:Ag, were fabricated. The device measurements of current, voltage and light intensity were made simultaneously using a Keithley 2400 sourcemeter. The EL spectra of the devices were recorded under an ambient atmosphere without further encapsulation.2.3. General procedure for the synthesis of phenanthrimidazole ligands
A mixture of phenanthrene-9,10-dione (40 mmol), ammonium acetate (30 mmol), 4-trifluoromethylbenzaldehyde (30 mmol) and the corresponding arylamine (30 mmol) was refluxed in ethanol at 80 °C in the presence of indium(III) fluoride (InF3) as Lewis acid catalyst for 30 minutes. The reaction was monitored by thin layer chromatography and the crude phenanthrimidazoles were extracted with dichloromethane, purified by column chromatography using benzene–ethyl acetate (9![[thin space (1/6-em)]](https://www.rsc.org/images/entities/char_2009.gif) :
:![[thin space (1/6-em)]](https://www.rsc.org/images/entities/char_2009.gif) 1) as the eluent. Yield: 95% (1), 96% (2), 94% (3) and 95% (4).
1) as the eluent. Yield: 95% (1), 96% (2), 94% (3) and 95% (4).
2.4. General procedure for the synthesis of chloro bridged dimers and iridium(III) complexes
IrCl3·xH2O (1 mmol) was dissolved in a mixture of 2-ethoxyethanol/H2O (3![[thin space (1/6-em)]](https://www.rsc.org/images/entities/char_2009.gif) :
:![[thin space (1/6-em)]](https://www.rsc.org/images/entities/char_2009.gif) 1) by heating under a nitrogen atmosphere at around 90 °C for 30 min. The phenanthrimidazole ligand (2.3 mmol) in 2-ethoxyethanol was added and the solution was stirred at 120 °C for 12 h. After cooling to room temperature, water was added and the precipitate was filtered, washed with water and ether and then dried. The formed dimer was used without further purification.
1) by heating under a nitrogen atmosphere at around 90 °C for 30 min. The phenanthrimidazole ligand (2.3 mmol) in 2-ethoxyethanol was added and the solution was stirred at 120 °C for 12 h. After cooling to room temperature, water was added and the precipitate was filtered, washed with water and ether and then dried. The formed dimer was used without further purification.
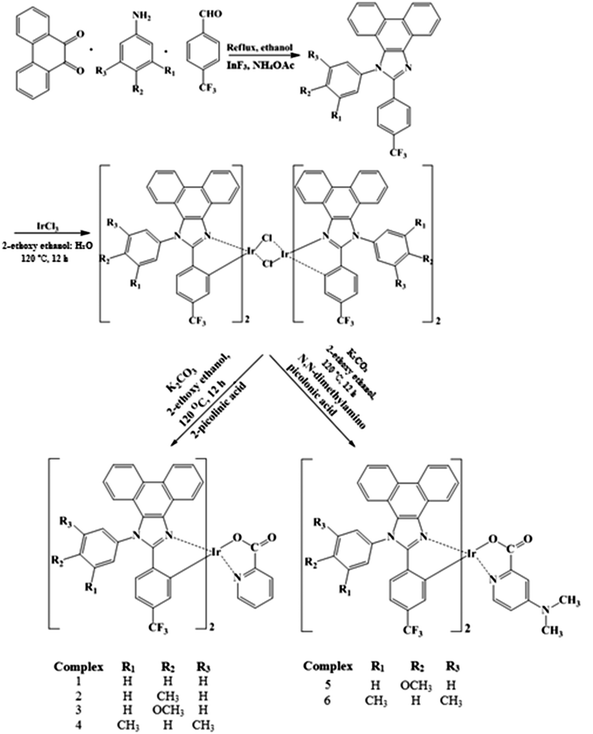
The dimeric iridium(III) complex (0.54 mmol) was dissolved in 2-ethoxyethanol (2.5 ml). To this solution 2-picolinic acid (1–4)/4-N,N-dimethylaminopicolinic acid (5, 6) (1.4 mmol) and K2CO3 (1.16 mmol) were added. The reaction mixture was refluxed under a nitrogen atmosphere at 120 °C for 12 h. After being cooled to room temperature, water was added; the precipitated green colour solid was collected by filtration and washed with ethanol and hexane repeatedly. The residue was dissolved in dichloromethane and the solid was filtered and analysed39 (Scheme 1).
3. Results and discussion
3.1. Synthesis and characterization of iridium(III) complexes
The synthetic method used to prepare these complexes involves two steps. In the first step, IrCl3·3H2O was allowed to react with an excess of the cyclometalated phenanthrimidazole ligand to give a chloride-bridged dinuclear complex. The chloride-bridged dinuclear complexes can be readily converted to emissive, mononuclear complexes by replacing the two bridging chlorides with bidentate picolinic acid (1–4) and 4-N,N-dimethylaminopicolinic acid (5, 6) as ancillary ligands. The yield of the reaction is 79–91%. All the mononuclear complex dopants are thermally stable up to 368–393 °C and can be sublimed easily at reduced pressure. The synthesised complexes were characterised by 1H and 13C NMR, mass spectra (MS) and CHN analysis, and analysed.3.2. Photophysical studies
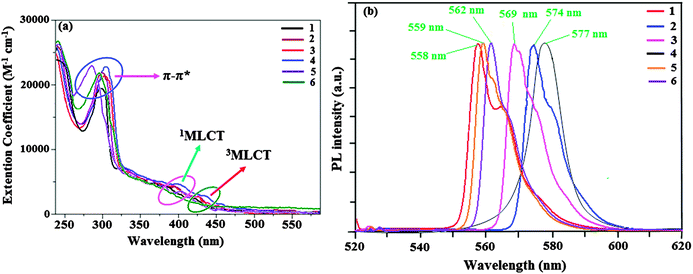
The absorption and emission spectra of iridium(III) complexes in dichloromethane at room temperature are shown in Fig. 1. The intense band at around 297 nm in the ultraviolet part of the spectrum can be assigned to the allowed ligand centered (π–π*) transitions.40 The weak absorption bands in the range 379–434 nm have been assigned to MLCT transitions (1MLCT ← S0 and 3MLCT ← S0).41–45 The intensity of 3MLCT ← S0 is strongly close to the intensity of 1MLCT ← S0 suggesting that 3MLCT ← S0 is strongly allowed by S–T mixing due to spin–orbit coupling. Strong spin–orbit coupling makes these complexes highly phosphorescent in nature.46,47Emission from these mononuclear metal complexes reveal that the phosphorescence is attributed to a mixture of both metal–ligand charge-transfer 3(MLCT) and 3(π–π*) states. The wavefunction of the excited triplet state, (ΦT), is responsible for the phosphorescence i.e., ΦT = aΦT (π–π*) + bΦT (MLCT), where ‘a’ and ‘b’ are the normalized co-efficients, ΦT (π–π*) and ΦT (MLCT) are the wavefunctions of 3(π–π*) and 3(MLCT) excited states, respectively. For these iridium complexes, the wavefunction of the triplet state, (ΦT), is responsible for the phosphorescence and the equation implies that the excited triplet state of these iridium complexes are a mixture of ΦT (π–π*) and ΦT (MLCT). The triplet state is attributed to dominantly the 3π–π* excited state when a > b and dominantly the 3MLCT excited state when b > a.48–50 According to our previous studies,44,45 phosphorescence spectra from the ligand centered 3π–π* state display vibronic progressions and those from the 3MLCT state are broader in shape. In the present study, complexes 1–3, 5 and 6 display vibronic progressions having excited states with a large contribution of 3π–π*, whereas the emission spectra of complex Ir(tmpdp)2(pic) 4 is broader in shape and has an excited state with a large contribution of 3MLCT. All these complexes show dominant emission at 558, 574, 569, 577, 559 and 562 nm and a shoulder peak at around 565 (1), 579 (2) and 574 nm (3) in dichloromethane, respectively (Table 1). Molecules having intramolecular donor–acceptor (DA) systems exhibit a bathochromic shift in electronic spectra. Phenanthrimidazole derivatives have a DA character51 resulting from the interaction between the electron rich phenanthrimidazole moiety and an electron deficient trifluoromethylphenyl group. The introduction of an electron releasing methyl and methoxy groups into the phenanthrimidazole moiety is considered to enhance the DA character of the ligand. The emission of their corresponding iridium(III) complexes 2–6 are red shifted [16 (2), 11 (3), 19 (4), 1 (5) and 4 nm (6)] when compared with complex Ir(tmpp)2(pic) 1 and this may be due to the electronic effect and the position of the substituents. The observed results indicate that the introduction of the methyl and methoxy groups into the phenanthrimidazole fragment enhances the DA character of the ligand in the iridium(III) complexes leading to a red shift (Fig. 1). There is significantly a blue shift observed for complexes 5 and 6 in comparison with their analogue complexes 3 and 4. This interesting behaviour may be due to the presence of a donor N,N-dimethylamino group in the ancillary ligand of 2-picolinate.
| Complex | λ abs | λ emi | Φ | E onset | E 1/2ox (V) | HOMO (eV) | LUMO (eV) | E g (eV) | τ | k r 108 s−1 | k nr 108 s−1 |
|---|---|---|---|---|---|---|---|---|---|---|---|
| 1 | 301, 379, 421 | 558 | 0.55 | 456 | 0.80 | 5.60 | 2.88 | 2.72 | 1.88 | 2.9 | 2.4 |
| 2 | 304, 394, 432 | 574 | 0.53 | 443 | 0.82 | 5.62 | 2.82 | 2.80 | 1.92 | 2.8 | 2.5 |
| 3 | 297, 387, 425 | 569 | 0.56 | 447 | 0.81 | 5.61 | 2.84 | 2.77 | 1.94 | 2.9 | 2.2 |
| 4 | 305, 399, 434 | 577 | 0.58 | 440 | 0.74 | 5.54 | 2.73 | 2.81 | 1.80 | 3.2 | 2.3 |
| 5 | 283, 371, 416 | 559 | 0.57 | 455 | 0.72 | 5.52 | 2.80 | 2.72 | 1.72 | 3.4 | 2.4 |
| 6 | 298, 382, 420 | 562 | 0.59 | 449 | 0.65 | 5.45 | 2.69 | 2.76 | 1.74 | 3.5 | 2.2 |
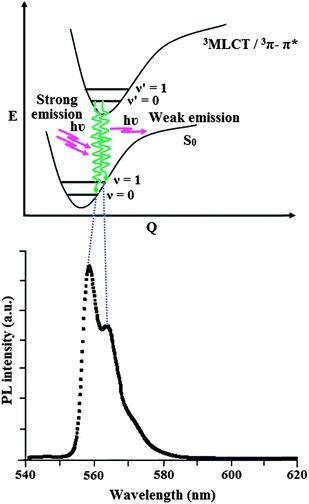
The dominant and shoulder emissions from complexes 1–3 are explained as follows. The ground and excited states of organic light-emissive materials are composed of several separated vibrational states (ν = 0, 1, 2,…) according to the Franck–Condon principle. The emissive spectra of iridium(III) complexes 1–3 consist of two kinds of peak, 558, 565 (sh) nm (1), 574, 579 (sh) nm (2) and 569, 574 (sh) nm (3) corresponding to the electronic transitions between the vibrational levels of the triplet state (3MLCT/3π–π*) and the ground state (S0). The peak with dominant intensity stemmed from 0 to 0 electronic transition between 3MLCT/3π–π* and S0 and a shoulder with lower intensity derived from 0 to 1 electronic transition.52,53 The representative Franck–Condon electronic transitions are shown in Fig. 2.
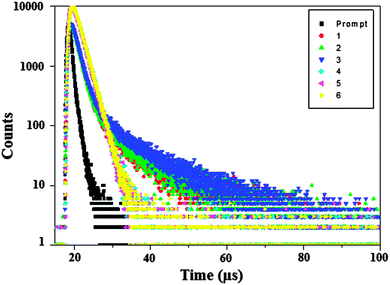
The radiative and non-radiative decays of the excited state of iridium complexes have been obtained using the quantum yield (Φ) and lifetime (τ). The decay curve is shown in Fig. 3. The radiative lifetimes are in the microsecond range as expected for cyclometalated iridium(III) complexes. The formula employed to calculate the radiative (kr) and non-radiative (knr) rate constants are Φ = ΦISC {kr/(kr + knr)}; kr = Φ/τ; knr = (1/τ) − (Φ/τ); τ = (kr + knr)−1, where ΦISC is the intersystem-crossing yield. For the iridium complexes, ΦISC is safely assumed to be 1.0 because of the strong spin–orbit interaction caused by the heavy atom effect of iridium.54 The decay parameter, radiative (kr) and non-radiative (knr) rate constants are displayed in Table 1. Perusal of the radiative and non-radiative rate constants shows that the radiative emission is predominant over non-radiative transitions in these complexes.55–57
An experimentally observed result indicates that the radiative rate constant (kr) of complexes Ir(tmptp)2(pic) 2 and Ir(tmpmp)2(pic) 3 increases with an increase of Eemi. According to the electronic transition theory, the kr value is proportional to the square of the electric dipole transition moment (MT–S). The first-order perturbation theory gives an approximate expression for MT–S,58MT–S = ∑βn〈1Φn|M|1Φ0〉, where 1Φn and 1Φ0 are the wavefunctions of the Sn and S0 states, respectively and M is the electric dipole vector. With the use of the spin–orbit coupling operator (Hso) and the wavefunction of the lowest excited triplet state (3Φ1), βn is formulated as βn = 〈1Φ1|HSO|3Φ1〉/(1En − 3E1), where 1En and 3E1 are the energies of the Sn state and the lowest excited triplet state, respectively. Here, we assume a three state model S1, T1 and S0, now, the above equation becomes, MT–S = {〈1Φ1|HSO|3Φ1〉〈1Φ1|M|1Φ0〉}/(1E1 − 3E1) = α/(1E1 − 3E1), when (α = 〈1Φ1|HSO|3Φ1〉〈1Φ1|M|1Φ0〉) is constant, kr increases with a decrease in the energy difference (1E1 − 3E1). In the present study, kr increases (Fig. S1, ESI†) with an increase of Eemi for complexes Ir(tmptp)2(pic) 2 and Ir(tmpmp)2(pic) 3, which is explained by assuming that the S1 energy does not differ significantly and the energy difference (1E1 − 3E1) increases with decrease of Eemi. For complexes 2 and 3, the S1 ← S0 absorption bands are located at 304 and 297 nm but phosphorescence S0 ← T1 exhibits a large bathochromic shift ranging from 574 and 569 nm. This is evidence that the energy difference (1E1 − 3E1) increases with the decrease of Eemi and therefore, kr increases with an increase of Eemi.
In order to investigate the highest occupied molecular orbital (HOMO) and the lowest unoccupied molecular orbital (LUMO) energy levels, cyclic voltammetric analyses were carried out (Fig. 4a). The redox potentials of the cyclometalated iridium complexes were measured relative to an internal ferrocene reference (Cp2Fe/Cp2Fe+ = 0.45 V versus SCE in CH2Cl2 solvent).59–62 The reduction occurs primarily on the more electron accepting heterocyclic portion of the cyclometalated phenanthrimidazole ligands, whereas the oxidation is largely involved in the iridium-phenyl centre. The calculated energies of the HOMO and the LUMO are given in Table 1. The HOMO energy levels were calculated using the equation,  , where Eonsetox and
  are the onset oxidation potentials of the iridium complexes and ferrocene, respectively. The LUMO energies are calculated based on the HOMO energies and the lowest energy absorption edges of the absorption spectra,60ELUMO (eV) = EHOMO − 1239/λonset.63 The HOMO energy levels of the complexes 1–6 were calculated to be 5.60, 5.62, 5.61, 5.54, 5.52 and 5.45 eV, respectively.64 From the energy gap it was concluded that all the reported dopants are green emitters (Fig. 4b). The 3D orbitals of the HOMO and the LUMO of Ir(tmpp)2(pic) 1 are shown in Fig. 4c.
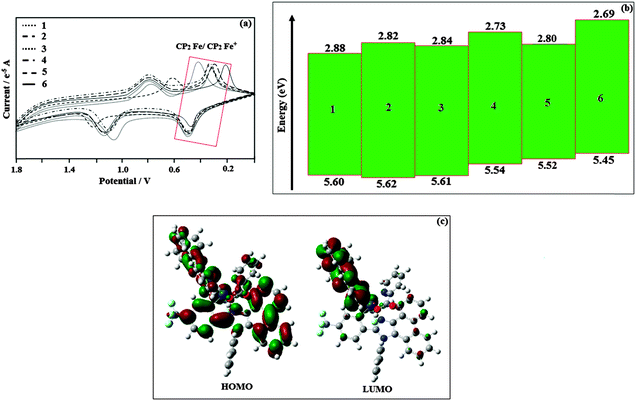 | ||
| Fig. 4 (a) Cyclic voltammogram curves of the iridium complexes 1–6; (b) schematic representation of HOMO–LUMO energies of 1–6; (c) the HOMO–LUMO orbital picture of Ir(tmpp)2(pic) 1. | ||
3.3. Structure of Ir(tmpp)2(pic) 1
All the synthesized Ir(III) complexes are amorphous solid and single crystal X-ray analysis could not be made. Thus the optimization has been made using density functional theory, LANL2DZ pseudopotentials for iridium metals and 6-31G* for carbon, hydrogen, oxygen, nitrogen and fluoro atoms. The selected bond length and the bond angle for Ir(tmpp)2(pic) 1 are presented in Table 2. The x, y and z coordinates are displayed in Table S1 (ESI†). The optimized geometry of the complex shows that the complex exhibits an octahedral geometry around the iridium metal and prefers cis-C,C and trans-N,N chelate disposition instead of trans-C,C and trans-N,N chelates. Electron rich phenyl rings normally exhibit very strong influence and a trans effect. Therefore, the trans-C,C arrangement is expected to be thermodynamically higher in energy and kinetically more labile.62 The Ir–C bonds of the complex i.e. Ir–Cav is 2.038 Å, which is shorter than Ir–N bonds i.e., Ir–Nav is 2.060 Å. The Ir–O bond length [2.138 Å] is longer than the mean Ir–O bond length (2.088 Å) reported63 and these observations reflect the trans influence of the phenyl groups. This arrangement of the ligands is similar to that found in other mononuclear iridium(III) complexes that possess an Ir(ppy)2 fragment65–68 (Fig. S2, ESI†).| Connectivity | Bond length | Connectivity | Bond angle |
|---|---|---|---|
| Ir(1)–C(2) | 2.008 | C(3)–Ir(1)–C(8) | 87.41 |
| Ir(1)–C(9) | 2.021 | C(7)–C(9)–F(85) | 94.65 |
| C(31)–N(2) | 1.543 | C(12)–C(16)–F(86) | 166.90 |
| C(7)–N(4) | 1.538 | N(37)–C(30)–N(39) | 91.08 |
| Ir(1)–C(24) | 1.798 | O(41)–C(38)–O(40) | 89.73 |
| Ir(1)–C(39) | 2.002 | C(44)–C(29)–N(39) | 91.76 |
3.4. Thermal studies
The thermal properties of the iridium(III) complexes have been investigated by thermogravimetric analyses (TGA) under a nitrogen atmosphere. The iridium complexes exhibit high thermal stability. Ir(tmpp)2(pic) decomposition begins at about 379 °C and proceeds in three stages. Ir(tmptp)2(pic) decomposition begins at about 368 °C and proceeds in four stages. Ir(tmpmp)2(pic) decomposition begins at about 383 °C and proceeds in three stages. Ir(tmpdp)2(pic) decomposition begins at about 374 °C. Decomposition of complexes 5 and 6 begins at 390 °C and 395 °C, respectively, as shown in Fig. 5a. The thermal stability of the complexes has also been explained by differential scanning calorimetry (DSC). Fig. 5b indicates that the iridium complexes undergo a glass transition at around 93 °C, followed by crystallization at around 112 °C and crystalline melting at 380, 382, 369, 373, 385 and 388 °C for 1–6, respectively.3.5. Electroluminescence properties
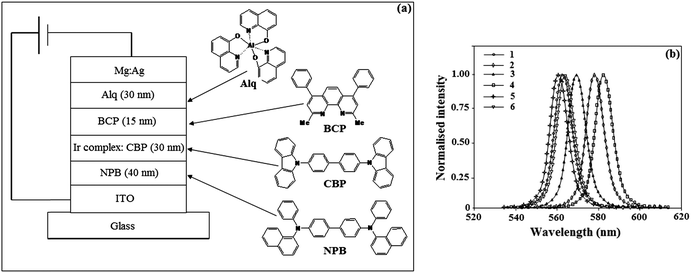
OLED devices using the synthesised iridium(III) complexes as dopants have been fabricated with a multi-layer configuration of the ITO/NPB (30 nm)/iridium complex: CBP (7%) (30 nm)/BCP (10 nm)/Alq3 (40 nm)/Mg:Ag, where ITO was used as the anode, NPB (4,4′-bis[N-(1-naphthyl)-N-phenylamino]biphenyl) was used as the hole-transporting material, CBP (4,4′-N,N′-dicarbozole biphenyl) as the host, the iridium complexes as the dopant, BCP (2,9-dimethyl-4,7-dipheny-1,10-phenanthroline) as the hole blocker, Alq3 (tris(8-hydroxyquinolinato) aluminium) as the electron transporter and Mg:Ag as the cathode (Fig. 6a). The performance of these devices is listed in Table 3. The devices emit strong green light with an emission maximum at 563, 578, 572, 584, 561 and 564 nm, respectively (Fig. 6b).| Device | V d (V) | L max (cd m−2) | η ext (%) | η c (cd A−1) | η p (lm W−1) | ELmax (nm) |
|---|---|---|---|---|---|---|
| a V d: driving voltage; Lmax: luminous efficiency; ηc: current efficiency; ELmax: electroluminescence maxima; ηp: power efficiency; ηext: external quantum yield. | ||||||
| I | 3.2 | 78![[thin space (1/6-em)]](https://www.rsc.org/images/entities/char_2009.gif) 624, 14.5 V 624, 14.5 V |
9.8, 6 V | 33.9, 6 V | 23.2, 5.0 V | 563 |
| II | 5.0 | 98![[thin space (1/6-em)]](https://www.rsc.org/images/entities/char_2009.gif) 214, 16 V 214, 16 V |
6.5, 9.5 V | 22.2, 9.5 V | 9.4, 9.5 V | 578 |
| III | 3.5 | 110![[thin space (1/6-em)]](https://www.rsc.org/images/entities/char_2009.gif) 421, 18 V 421, 18 V |
12.8, 8 V | 42.1, 8 V | 24.0, 7 V | 572 |
| IV | 3.0 | 124![[thin space (1/6-em)]](https://www.rsc.org/images/entities/char_2009.gif) 568, 18 V 568, 18 V |
14.0, 8 V | 47.5, 8 V | 25.6, 7 V | 584 |
| V | 3.5 | 128![[thin space (1/6-em)]](https://www.rsc.org/images/entities/char_2009.gif) 301, 18 V 301, 18 V |
13.1, 8 V | 44.6, 8 V | 26.0, 7 V | 561 |
| VI | 3.0 | 131![[thin space (1/6-em)]](https://www.rsc.org/images/entities/char_2009.gif) 923, 18 V 923, 18 V |
15.6, 8 V | 49.9, 8 V | 27.2, 7 V | 564 |
Fig. 7a and b show the brightness–voltage and the external quantum yield–current density characteristics of the devices, respectively. All devices show quite appreciable efficiencies and brightness. Of the six devices, device II shows poor efficiency followed by device I. The external quantum efficiency of device II is low; even at a driven voltage of 5.0, the external quantum efficiency is 6.5%.
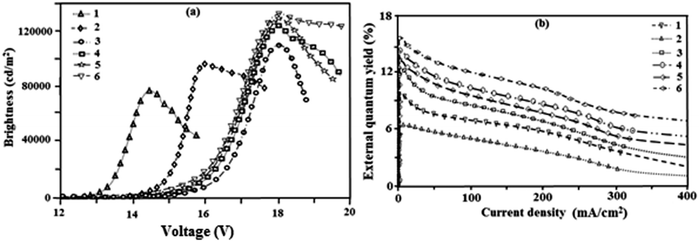 | ||
| Fig. 7 (a) Plot of brightness vs. voltage; (b) a plot of the external quantum yield vs. current density. | ||
The efficiency roll-off may be due to triplet–triplet annihilation [TTA − 3M* + 3N* → 1M + 3N*] and triplet-polaron annihilation [TPA − 3M* + N− → 1M + N−*] as reported in the literature.69 Baldo et al.70 reported that triplet–triplet annihilation (TTA) is a dominant factor for the external quantum efficiency roll-off. Furthermore, Reineke et al.71 and Aziz et al.72 advocated that triplet-polaron annihilation (TPA) could be the only source for efficiency roll-off at high current densities. A simple illustration of these processes is shown in Fig. 8a. Devices III and IV show better performance in terms of brightness of 110![[thin space (1/6-em)]](https://www.rsc.org/images/entities/char_2009.gif) 421 cd m−2 and 124
421 cd m−2 and 124![[thin space (1/6-em)]](https://www.rsc.org/images/entities/char_2009.gif) 568 cd m−2 at 18 V, respectively. Device IV shows a high power efficiency of 25.6 lm W−1 at 7.0 V (Fig. 8b) and a current efficiency (Fig. 8c) of 47.5 cd A−1 at 8.0 V. From the electroluminescent analysis it was concluded that device efficiency was improved by replacing the ancillary ligand from picolinic acid to 4-N,N-dimethylaminopicolinic acid.
568 cd m−2 at 18 V, respectively. Device IV shows a high power efficiency of 25.6 lm W−1 at 7.0 V (Fig. 8b) and a current efficiency (Fig. 8c) of 47.5 cd A−1 at 8.0 V. From the electroluminescent analysis it was concluded that device efficiency was improved by replacing the ancillary ligand from picolinic acid to 4-N,N-dimethylaminopicolinic acid.
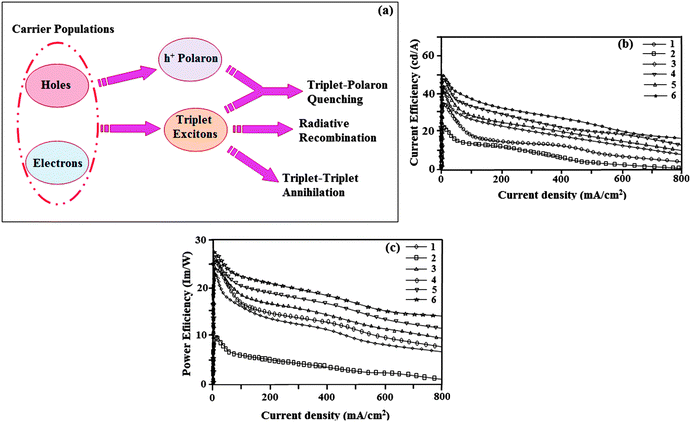 | ||
| Fig. 8 (a) A schematic illustration of TTA and TPA processes; (b) a plot of current efficiency vs. current density; (c) a plot of power efficiency vs. current density. | ||
4. Conclusions
We have synthesized a series of iridium complex dopants with appreciable quantum efficiencies using various substituted bulky phenanthrimidazole ligands. The phosphorescence of these complexes is attributed to a mixture of 3MLCT and 3π–π*. Complexes 1–3, 5 and 6 display vibronic progressions having excited states with a large contribution of 3π–π*, whereas the emission spectrum of complex 4 is broad in shape and has an excited state with a large contribution of 3MLCT. The devices exhibit maximum external quantum efficiency and maximum power and current efficiencies. Devices with dopants Ir(tmpmp)2(pic) and Ir(tmpdp)2(pic) show better performance in terms of brightness of 110![[thin space (1/6-em)]](https://www.rsc.org/images/entities/char_2009.gif) 421 cd m−2 and 124
421 cd m−2 and 124![[thin space (1/6-em)]](https://www.rsc.org/images/entities/char_2009.gif) 568 cd m−2 at 18 V, respectively. Devices with complex Ir(tmpdp)2(pic) show a high power efficiency of 25.6 lm W−1 at 7.0 V and a current efficiency of 47.5 cd A−1 at 8.0 V. Device efficiency was improved by replacing the ancillary ligand from picolinic acid to 4-N,N-dimethylaminopicolinic acid.
568 cd m−2 at 18 V, respectively. Devices with complex Ir(tmpdp)2(pic) show a high power efficiency of 25.6 lm W−1 at 7.0 V and a current efficiency of 47.5 cd A−1 at 8.0 V. Device efficiency was improved by replacing the ancillary ligand from picolinic acid to 4-N,N-dimethylaminopicolinic acid.
Acknowledgements
One of the authors Prof. J. Jayabharathi is thankful to DST [No. SR/S1/IC-73/2010], DRDO (NRB-213/MAT/10-11), UGC (F. No. 36-21/2008 (SR)), CSIR (No. 3732/NS-EMRII) and SERB (F. No. EMR/2014/000094) for providing funds to this research study.References
- C. W. Tang and S. A. Vanslyke, Appl. Phys. Lett., 1987, 51, 913–915 CrossRef CAS.
- M. A. Baldo, S. Lamansky, P. E. Burrows, M. E. Thompson and S. R. Forrest, Appl. Phys. Lett., 1999, 75, 4 CrossRef CAS.
- Y. Chi and P. T. Chou, Chem. Soc. Rev., 2007, 36, 1421–1431 RSC.
- Y. Chi and P. T. Chou, Chem. Soc. Rev., 2010, 39, 638–655 RSC.
- G. Zhou, W. Y. Wong and X. Yang, Chem. – Asian J., 2011, 6, 1706–1727 CrossRef CAS PubMed.
- P. Wang, S. J. Liu, Z. H. Lin, X. C. Dong, Q. Zhao, W. P. Lin, M. D. Yi, S. H. Ye, C. X. Zhu and W. Huang, J. Mater. Chem., 2012, 22, 9576–9588 RSC.
- M. Ikai, S. Tokito, Y. Sakamoto, T. Suzuki and Y. Taga, Appl. Phys. Lett., 2001, 79, 156–158 CrossRef CAS.
- A. Kohler, J. S. Wilson and R. H. Friend, Adv. Mater., 2002, 14, 701–707 CrossRef CAS.
- A. B. Tamayo, B. D. Alleyne, P. I. Djurovich, S. Lamansky, I. Tsyba, N. N. Ho, R. Bau and M. E. Thompson, J. Am. Chem. Soc., 2003, 125, 7377–7387 CrossRef CAS PubMed.
- L. Xiao, Z. Chen, B. Qu, J. Luo, S. Kong, Q. Gong and J. Kido, Adv. Mater., 2011, 23, 926–952 CrossRef CAS PubMed.
- Q. Zhao, S. Liu, M. Shi, C. Wang, M. Yu, L. Li, F. Li, T. Yi and C. Huang, Inorg. Chem., 2006, 45, 6152–6160 CrossRef CAS PubMed.
- F. Zhang, L. Duan, J. Qiao, G. Dong, L. Wang and Y. Qiu, Org. Electron., 2012, 13, 1277–1288 CrossRef CAS.
- T. Hu, L. Duan, J. Qiao, L. He, D. Zhang, R. Wang, L. Wang and Y. Qiu, Org. Electron., 2012, 13, 1948–1955 CrossRef CAS.
- W. J. Xu, S. J. Liu, T. C. Ma, Q. Zhao, A. Pertegás, D. Tordera, H. J. Bolink, S. H. Ye, X. M. Liu, S. Sun and W. Huang, J. Mater. Chem., 2011, 21, 13999–14007 RSC.
- B. Chen, Y. Li, W. Yang, W. Luo and H. Wu, Org. Electron., 2011, 12, 766–773 CrossRef CAS.
- F. Dumur, G. Nasr, G. Wantz, C. R. Mayer, E. Dumas, A. Guerlin, F. Miomandre, G. Clavier, D. Bertin and D. Gigmes, Org. Electron., 2011, 12, 1683–1694 CrossRef CAS.
- W. J. Xu, S. J. Liu, X. Y. Zhao, S. Sun, S. Cheng, T. C. Ma, H. B. Sun, Q. Zhao and W. Huang, Chem. – Eur. J., 2010, 16, 7125–7133 CrossRef CAS PubMed.
- Q. Zhao, F. Li, S. Liu, M. Yu, Z. Liu, T. Yi and C. Huang, Inorg. Chem., 2008, 47, 9256–9264 CrossRef CAS PubMed.
- C. Yang, X. Zhang, H. You, L. Zhu, L. Chen, L. Zhu, Y. Tao, D. Ma, Z. Shuai and J. Qin, Adv. Funct. Mater., 2007, 17, 651–661 CrossRef CAS.
- B. Liang, L. Wang, Y. H. Xu, H. H. Shi and Y. Cao, Adv. Funct. Mater., 2007, 17, 3580–3589 CrossRef CAS.
- X. Gong, M. R. Robinson, J. C. Ostrowski, D. Moses, G. C. Bazan and A. Heeger, J. Adv. Mater., 2002, 14, 581–585 CrossRef CAS.
- R. N. Bera, N. Cumpstey, P. L. Burn and I. W. Samuel, Adv. Funct. Mater., 2007, 17, 1149–1152 CrossRef CAS.
- Z. W. Xu, Y. Li, X. M. Ma, X. D. Gao and H. Tian, Tetrahedron, 2008, 64, 1860–1867 CrossRef CAS.
- Z. Y. Xia, X. Xiao, J. H. Sua, C. S. Chang, C. H. Chen, D. L. Li and H. Tian, Synth. Met., 2009, 159, 1782–1785 CrossRef CAS.
- T. H. Kwon, M. K. Kim, J. Kwon, D. Y. Shin, S. J. Park, C. L. Lee, J. J. Kim and J. I. Hong, Chem. Mater., 2007, 19, 3673–3680 CrossRef CAS.
- P. Coppo, E. A. Plummer and L. De Cola, Chem. Commun., 2004, 1774–1775 RSC.
- M. A. Baldo, D. F. O’Brien, Y. You, A. Shoustikov, S. Sibley, M. E. Thompson and S. R. Forrest, Nature, 1998, 395, 151–154 CrossRef CAS.
- C. L. Li, Y. J. Su, Y. T. Tao, P. T. Chou, C. H. Chien, C. C. Cheng and R. S. Liu, Adv. Funct. Mater., 2005, 15, 387–395 CrossRef CAS.
- Y. You and S. Y. Park, J. Am. Chem. Soc., 2005, 125, 12438–12439 CrossRef PubMed.
- L. L. Wu, I. W. Sun and C. H. Yang, Polyhedron, 2007, 26, 2679–2685 CrossRef CAS.
- T. Sajoto, P. I. Djurovich, A. Tamayo, M. Yousufuddin, R. Bau and M. E. Thompson, Inorg. Chem., 2005, 47, 7992–8003 CrossRef PubMed.
- R. S. Lumpkin, E. M. Kober, L. A. Worl, Z. Murtaza and T. J. Meyer, J. Phys. Chem., 1990, 94, 239–243 CrossRef CAS.
- T. Fei, X. Gu, M. Zhang, C. Wang, M. Hanif, H. Zhang and Y. Ma, Synth. Met., 2009, 159, 113–118 CrossRef CAS.
- (a) Z. K. Chen, W. Huang, L. H. Wang, E. T. Kang, B. J. Chen, C. S. Lee and S. T. Lee, Macromolecules, 2000, 33, 9015–9025 CrossRef CAS; (b) H. S. Joshi, R. Jamshidi and Y. Tor, Angew. Chem., Int. Ed., 1999, 38, 2722 CrossRef CAS; (c) J. N. Demas and G. A. Crosby, J. Phys. Chem., 1971, 75, 991 CrossRef; (d) J. Jayabharathi, V. Thanikachalam and K. Saravanan, J. Photochem. Photobiol., A, 2009, 208, 13–20 CrossRef CAS.
- J. Jayabharathi, V. Thanikachalam, M. Venkatesh Perumal and N. Srinivasan, Spectrochim. Acta, Part A, 2011, 79, 236–244 CrossRef CAS PubMed.
- S. Okada, K. Okinaka, H. Iwawaki, M. Furugori, M. Hashimoto, T. Mukaide, J. Kamatani, S. Igawa, A. Tsuboyama, T. Takiguchi and K. Ueno, Dalton Trans., 2005, 1583–1590 RSC.
- A. D. Becke, J. Chem. Phys., 1993, 98, 5648–5652 CrossRef CAS.
- M. J. Frisch, G. W. Trucks, H. B. Schlegel, G. E. Scuseria, M. A. Robb, J. R. Cheeseman, J. A. Montgomery Jr, T. Vreven, K. N. Kudin, J. C. Burant, J. M. Millam, S. S. Iyengar, J. Tomasi, V. Barone, B. Mennucci, M. Cossi, G. Scalmani, N. Rega, G. A. Petersson, H. Nakatsuji, M. Hada, M. Ehara, K. Toyota, R. Fukuda, J. Hasegawa, M. Ishida, T. Nakajima, Y. Honda, O. Kitao, H. Nakai, M. Klene, X. Li, J. E. Knox, H. P. Hratchian, J. B. Cross, V. Bakken, C. Adamo, J. Jaramillo, R. Gomperts, R. E. Stratmann, O. Yazyev, A. J. Austin, R. Cammi, C. Pomelli, J. W. Ochterski, P. Y. Ayala, K. Morokuma, G. A. Voth, P. Salvador, J. J. Dannenberg, V. G. Zakrzewski, S. Dapprich, A. D. Daniels, M. C. Strain, O. Farkas, D. K. Malick, A. D. Rabuck, K. Raghavachari, J. B. Foresman, J. V. Ortiz, Q. Cui, A. G. Baboul, S. Clifford, J. Cioslowski, B. B. Stefanov, G. Liu, A. Liashenko, P. Piskorz, I. Komaromi, R. L. Martin, D. J. Fox, T. Keith, M. A. Al-Laham, C. Y. Peng, A. Nanayakkara, M. Challacombe, P. M. W. Gill, B. Johnson, W. Chen, M. W. Wong, C. Gonzalez and J. A. Pople, Gaussian 03, Revision C.02, Gaussian, Inc., Wallingford, CT, 2004 Search PubMed.
- M. Nonoyama, Bull. Chem. Soc. Jpn., 1974, 47, 767–768 CrossRef CAS.
- S. Lamansky, P. Djurovich, D. Murphy, F. Abdel-Razzaq, R. Kwong, I. Tsyba, M. Bortz, B. Mmui, R. Bau and M. E. Thompson, J. Inorg. Chem., 2001, 40, 1704–1711 CrossRef CAS PubMed.
- B. X. Mi, P. F. Wang, M. W. Liu, H. L. Kwong, N. B. Wong, C. S. Lee and S. T. Lee, Chem. Mater., 2003, 15, 3148–3151 CrossRef CAS.
- J. DePriest, G. Y. Zheng, N. Goswami, D. M. Eichhorn, C. Woods and D. P. Rillema, Inorg. Chem., 2000, 39, 1955–1963 CrossRef CAS PubMed.
- E. Baranoff, S. Fantacci, F. D. Angelis, X. Zhang, R. Scopelliti, M. Gratzel and M. K. Nazeeruddin, Inorg. Chem., 2011, 50, 451–462 CrossRef CAS PubMed.
- (a) J. Jayabharathi, V. Thanikachalam, K. Saravanan and N. Srinivasan, J. Fluoresc., 2011, 21, 65–80 CrossRef PubMed; (b) J. Jayabharathi, V. Thanikachalam and R. Sathishkumar, J. Phys. Org. Chem., 2014, 27, 504–511 CrossRef CAS; (c) J. Jayabharathi, C. Karunakaran, K. Jayamoorthy and P. Vinayagamoorthy, Mater. Express, 2014, 4, 279–292 CrossRef CAS.
- J. Jayabharathi, V. Thanikachalam and K. Jayamoorthy, J. Organomet. Chem., 2014, 761C, 74–83 CrossRef.
- K. Brooks, Y. Babayan, S. Lamansky, P. I. Djurovich, I. Tsyba, R. Bau and M. E. Thompson, Inorg. Chem., 2002, 41, 3055–3066 CrossRef PubMed.
- J. Jayabharathi, V. Thanikachalam, N. Srinivasan, K. Jayamoorthy and M. Venkatesh Perumal, J. Fluoresc., 2011, 21, 1813–1823 CrossRef CAS PubMed.
- S. Okada, K. Okinaka, H. Iwawaki, M. Furugori, M. Hashimoto, T. Mukaide, J. Kamatani, S. Igawa, A. Tsuboyama, T. Takiguchi and K. Ueno, Dalton Trans., 2005, 1583–1590 RSC.
- A. P. Wilde, K. A. King and R. J. Watts, J. Phys. Chem., 1991, 95, 629–634 CrossRef CAS.
- M. G. Colombo and H. U. Güdel, Inorg. Chem., 1993, 32, 3081–3087 CrossRef CAS.
- J. Jayabharathi, V. Thanikachalam and R. Sathishkumar, J. Fluoresc., 2014, 24, 431–444 CrossRef CAS PubMed.
- K. C. Tang, K. L. Liu and I. C. Chen, Chem. Phys. Lett., 2004, 386, 437–441 CrossRef CAS.
- D. S. Mcclure, J. Chem. Phys., 1949, 17, 905–913 CrossRef CAS.
- S. D. Cummings and R. Eisenberg, J. Am. Chem. Soc., 1996, 118, 1949–1960 CrossRef CAS.
- (a) C. Ulbricht, B. Beyer, C. Friebe, A. Winter and U. S. Schubert, Adv. Mater., 2009, 21, 4418–4441 CrossRef CAS; (b) R. D. Costa, E. Orti, H. J. Bolink, F. Monti, G. Accorsi and N. Armaroli, Angew. Chem., Int. Ed., 2012, 51, 8178–8211 CrossRef CAS PubMed; (c) Y. You and W. Nam, Chem. Soc. Rev., 2012, 41, 7061–7084 RSC.
- (a) F. Alary, M. Boggio-Pasqua, J. L. Heully, C. J. Marsden and P. Vicendo, Inorg. Chem., 2008, 47, 5259–5266 CrossRef CAS PubMed; (b) L. Yang, F. Okuda, K. Kobayashi, K. Nozaki, Y. Tanabe, Y. Ishii and M. A. Haga, Inorg. Chem., 2008, 47, 7154–7165 CrossRef CAS PubMed; (c) E. Jakubikova, R. L. Martin and E. R. Batista, Inorg. Chem., 2010, 49, 2975–2982 CrossRef CAS PubMed.
- (a) D. Escudero, E. Heuser, R. J. Meier, M. Schaferling, W. Thiel and E. Holder, Chem. – Eur. J., 2013, 19, 15639–15644 CrossRef CAS PubMed; (b) W. H. Lam, E. S. Lam and V. W. Yam, J. Am. Chem. Soc., 2013, 135, 15135–15143 CrossRef CAS PubMed.
- J. B. Bricks, Photophysics of Aromatic Molecules, Wiley-Interscience, London, 1970 Search PubMed.
- J. Vicente, A. Arcas, D. Bautista and M. C. R. De Arellano, J. Organomet. Chem., 2002, 663, 164–172 CrossRef CAS.
- (a) G. T. Hwang, H. S. Son, J. K. Ku and B. H. Kim, J. Am. Chem. Soc., 2003, 125, 11241–11248 CrossRef CAS PubMed; (b) M. Kumada and K. Tamao, Adv. Organomet. Chem., 1968, 6, 19–117 CrossRef CAS; (c) J. Pommerehne, H. Vestweber, W. Guss, R. F. Mahrt, H. Bassler, M. Porsch and J. Daub, Adv. Mater., 1995, 7, 551–554 CrossRef CAS.
- R. Urban, R. Kramer, S. Mihan, K. Polborn, B. Wagner and W. Beck, J. Organomet. Chem., 1996, 517, 191–200 CrossRef CAS.
- J. Albert, J. M. Cadena, S. Delgado and J. Granell, J. Organomet. Chem., 2000, 603, 235–239 CrossRef CAS.
- J. Jayabharathi, V. Thanikachalam, N. Srinivasan and M. Venkatesh Perumal, J. Fluoresc., 2011, 21, 1585–1597 CrossRef CAS PubMed.
- F. I. Wu, H. J. Su, C. F. Shu, L. Luo, W. G. Diau, C. H. Cheng, J. P. Duan and G. H. Lee, J. Mater. Chem., 2005, 15, 1035–1042 RSC.
- I. R. Laskar, S. F. Hsu and T. M. Chen, Polyhedron, 2005, 24, 189–200 CrossRef CAS.
- P. J. Hay, J. Phys. Chem. A, 2002, 106, 1634–1641 CrossRef CAS.
- F. Neve, A. Crispini, S. Campagna and S. Serroni, Inorg. Chem., 1999, 38, 2250–2258 CrossRef CAS.
- M. G. Colombo, T. C. Brunold, T. Reidener, H. U. Güdel, M. Förtsch and H. B. Bürgi, Inorg. Chem., 1994, 33, 545–550 CrossRef CAS.
- (a) Q. Wang, I. W. H. Oswald, M. R. Perez, H. Jia, A. A. Shahub, Q. Qiao, B. E. Gnade and M. A. Omary, Adv. Funct. Mater., 2014, 24, 4746–4752 CrossRef CAS; (b) Q. Wang, I. W. H. Oswald, M. R. Perez, H. P. Jia, B. E. Gnade and M. A. Omary, Adv. Funct. Mater., 2013, 23, 5420–5428 CrossRef CAS; (c) Q. Wang and D. Ma, Chem. Soc. Rev., 2010, 39, 2387–2398 RSC; (d) Q. Wang, J. Ding, D. Ma, Y. Cheng, L. Wang, X. Jing and F. Wang, Adv. Funct. Mater., 2009, 19, 84–95 CrossRef CAS; (e) B. Q. Wang, J. Ding, D. Ma, Y. Cheng, L. Wang and F. Wang, Adv. Mater., 2009, 21, 2397–2401 CrossRef.
- M. A. Baldo, C. Adachi and S. R. Forrest, Phys. Rev. B: Condens. Matter Mater. Phys., 2000, 62, 10967 CrossRef CAS.
- S. Reineke, K. Walzer and K. Leo, Phys. Rev. B: Condens. Matter Mater. Phys., 2007, 75, 125328 CrossRef.
- D. Song, S. Zhao, Y. Luo and H. Aziz, Appl. Phys. Lett., 2010, 97, 243304 CrossRef.
Footnote |
| † Electronic supplementary information (ESI) available. See DOI: 10.1039/c4nj01334d |
| This journal is © The Royal Society of Chemistry and the Centre National de la Recherche Scientifique 2015 |

