Morphology control and multicolor-tunable luminescence of YOF:Ln3+ (Ln = Eu, Tb, Dy, Tm) nano-/microcrystals
Ruiqing
Li
a,
Linlin
Li
a,
Wenwen
Zi
a,
Junjun
Zhang
a,
Lu
Liu
a,
Lianchun
Zou
*b and
Shucai
Gan
*a
aCollege of Chemistry, Jilin University, Changchun 130026, P. R. China. E-mail: gansc@jlu.edu.cn
bTeaching Center of Basic Courses, Jilin University, Changchun 130062, China. E-mail: zoulianchun@126.com
First published on 10th September 2014
Abstract
YOF:Ln3+ (Ln = Eu, Tb, Dy, Tm) nano-/microcrystals with high uniformity, monodispersity and a variety of well-defined morphologies, such as submicro spheres, ellipsoids, nanorods, microspindles and spindle nanorod bundles, have been successfully synthesized via a urea based homogeneous precipitation method followed by a heat-treatment process. The influence of pH values, fluoride sources and reaction time on the sizes and morphologies of the as-prepared precursor was systematically investigated and discussed. The possible formation mechanism for the precursor has been presented. Upon ultraviolet excitation, the YOF:Ln3+ (Ln = Eu, Tb, Dy, Tm) submicro spheres show their characteristic f–f emissions and give red, green, yellow, and blue emission, respectively. Moreover, a novel single-phased and near-UV-pumped white-light-emitting phosphor YOF:Tm3+,Dy3+ was also successfully fabricated by singly varying the doping content of Dy3+ with a fixed Tm3+ content through the principle of energy transfer. This merit of multicolor emissions in the visible region endows materials of this kind with potential application in field-emission display devices and white light-emitting diodes.
1. Introduction
Recently, lanthanide (Ln3+) doped luminescent materials have been under extensive investigation due to their wide range of applications in lighting and display fields, such as white light-emitting diodes (WLEDs), field emission displays (FEDs), plasma display panels (PDPs), and lasers based on the electronic, optical, and chemical characteristics originating from their 4f electrons.1–5 Hitherto, tremendous efforts have been dedicated to the morphology and size controllable synthesis of nano-/micromaterials, since the morphology and size can exert an effect on the performance of the resulting nano-/micromaterials.6–9 However, manipulating the shape of materials is not a straightforward task due to the difficulties involved in controlling the nucleation and complex phenomena of crystal growth during the reaction process. Thus, it is still a challenge and urgent task to establish an efficient method to synthesize the high quality inorganic products with controlled-size/shape and manipulate the process with facile, green, economical, and mass production.10,11Lanthanide oxyfluorides (LnOF) have attracted much attention for applications in the down-conversion (DC) and up-conversion (UC) luminescence due to their better chemical durability, thermal stability and low phonon energy compared with those of fluorides and oxides.12–15 However, the majority of research on LnOF have been done on their bulk crystals or thin films obtained by some limited chemical routes, such as high-temperature-based solid-state reaction, hydrothermal precipitation, the sol–gel method, and chemical vapor deposition (CVD), while quite a few reports touch upon the fabrications of monodisperse LnOF based luminescent materials with high quality.14,16–18 Recently, Lin et al. prepared monodisperse YOF nano-/microcrystals through a convenient modified urea-based homogeneous precipitation (UBHP) technique, but just got several morphologies and they studied only single doped luminescence properties under ultraviolet excitation.19
Hence, in this study varieties of well-defined morphologies, including submicro spheres, ellipsoids, nanorods, microspindles and spindle nanorod bundles, have been synthesized using a convenient modified urea-based homogeneous precipitation technique. The pH values of the initial solution, fluoride sources, and reaction time on the sizes and morphologies have been investigated in detail. The photoluminescence properties of YOF:Ln3+ (Ln = Eu, Tb, Dy, Tm) samples were investigated. In addition, white-light-emitting phosphor YOF:Tm3+,Dy3+ was also synthesized. These materials hold great promise for applications in FEDs and WLEDs.
2. Experimental section
2.1 Materials
The rare-earth oxides, Ln2O3 (Ln = Y, Eu, Tb, Dy, and Tm) and Tb4O7 (99.99%), were purchased from the Science and Technology Parent Company of Changchun Institute of Applied Chemistry. Other chemicals were purchased from Beijing Chemical Co. All chemicals were of analytical grade and were used directly without further purification. Ln(NO3)3 was prepared by dissolving corresponding Ln2O3 and Tb4O7 in dilute HNO3 solution at an elevated temperature with agitation.2.2 Synthesis
In a typical procedure, 1 mmol Y(NO3)3 was added to 100 mL aqueous solution containing a certain quantity of urea and 0.25 mmol of NaBF4 at room temperature. Then, dilute NH3·H2O was introduced rapidly into the vigorously stirred solution until pH = 6 and then the beaker was wrapped with polyethylene film. After magnetic stirring for 10 min, the mixture was heated to 90 °C for 3 h in a water bath. The resulting white precipitates were collected by centrifugation, washed several times with deionized water and ethanol, and finally dried at 80 °C in air for 12 h. The final YOF product was obtained by a heat treatment process of the precursors at 550 °C in air for 3 h. Other samples were prepared using a similar procedure, except for different F− sources, pH conditions and reaction time. The doped YOF samples were prepared using a similar approach by introducing appropriate amounts of Ln(NO3)3 instead of Y(NO3)3 into the solution as described above.2.3 Characterization
The samples were examined by powder X-ray diffraction (XRD) measurements performed on a Rigaku D/max-II B X-ray diffractometer at a scanning rate of 10° min−1 in the 2θ range from 10° to 80°, with graphite-monochromatic Cu Kα radiation (λ = 0.15406 nm). Fourier transform infrared (FT-IR) spectra were recorded on a Perkin-Elmer 580B infrared spectrophotometer using the KBr pellet technique. The morphology, dimensions, and composition of the as-synthesized nano-/microstructures were examined by means of a scanning electron microscope (SEM, S-4800, Hitachi) equipped with an energy-dispersive X-ray spectrometer (EDX, JEOL JXA-840). The photoluminescence (PL) excitation and emission spectra were recorded using a Hitachi F-7000 spectrophotometer equipped with a 150 W xenon lamp as the excitation source. All measurements were performed at room temperature.3. Results and discussion
Multiform YOF nano-/microcrystals have been synthesized using the urea based homogeneous precipitation method followed by a heat-treatment process. The structures, morphologies and elemental composition performances were characterized and photoluminescence properties of the YOF:Ln3+ (Ln = Eu, Tb, Dy, Tm) sample were studied under UV light irradiation.3.1 Phase and morphology
The composition and phase purity of the products were first examined using XRD. Fig. 1A shows the XRD patterns of the as-prepared precursor sample of YOF, the annealed product and the standard data of YOF (JCPDS 71-2100). There are no obvious diffraction peaks that can be observed from the precursor sample, which indicates that the sample is amorphous. After calcination at 550 °C for 3 h, it can be seen that well-defined diffraction peaks can be assigned readily to the rhombohedral phase of YOF [space group: R![[3 with combining macron]](https://www.rsc.org/images/entities/char_0033_0304.gif) m (166), a = b = 3.797 Å, c = 18.890 Å], and no peak shifts and other impurity phases appear, revealing the high purity and crystallinity of the product. Fig. 1B shows the schematic view of the structure and coordination environments. The Y3+ cations are coordinated by four O2− and four F− ions, all ions occupy the 6-fold 6c Wyckoff positions, and the symmetry for Y3+ ions is C3v.20
m (166), a = b = 3.797 Å, c = 18.890 Å], and no peak shifts and other impurity phases appear, revealing the high purity and crystallinity of the product. Fig. 1B shows the schematic view of the structure and coordination environments. The Y3+ cations are coordinated by four O2− and four F− ions, all ions occupy the 6-fold 6c Wyckoff positions, and the symmetry for Y3+ ions is C3v.20
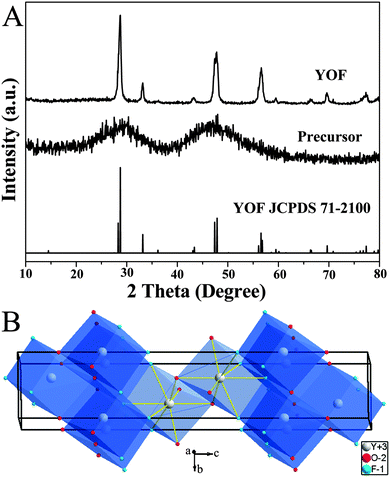 | ||
| Fig. 1 XRD patterns of the as-prepared precursor, annealed at 550 °C samples, and the standard data of YOF (JCPDS No. 71-2100) (A). Schemes of the rhombohedral phase YOF structures (B). | ||
In order to further examine the conversion process from the precursor to YOF, FT-IR spectroscopy was employed for both the precursor and the product calcined at 550 °C, as shown in Fig. 2. For the as-synthesized precursor sample, the broad absorption band located at 3444 cm−1 is assigned to the stretching and bending of O–H vibrations of absorbed water on the sample surface.15 The COO− groups generated the bands at 1514 and 1415 cm−1.19 The band at around 848 cm−1 is attributed to the bending vibration of the C–F group. After annealing the as-formed precursor at 550 °C for 3 h, a strong absorption band at 490 cm−1 is appeared which indicates the well defined crystallization of YOF, as displayed in Fig. 2b.21
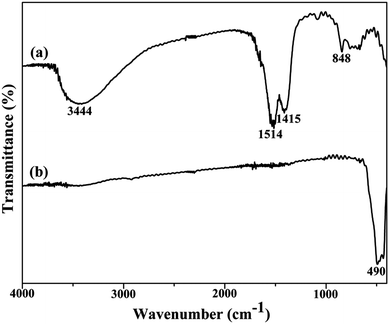 | ||
| Fig. 2 FT-IR spectra of as-prepared precursor samples (a) and YOF obtained by calcining the precursor at 550 °C (b). | ||
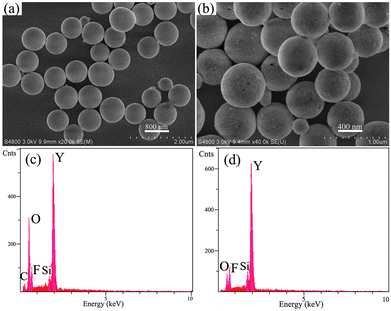
The SEM and EDX spectral images of the as-prepared precursor and the YOF sample prepared at pH = 6 with NaBF4 as the F− source are shown in Fig. 3. It is obvious that the precursor mainly consists of numerous monodispersed submicro spheres with an average diameter of about 746 nm and the surfaces are smooth, as displayed in Fig. 3a. Fig. 3b displays the morphology of the YOF sample after calcining at 550 °C for 3 h. From Fig. 3b, it can be seen that the calcined YOF inherited its parents' morphologies, but its size (a diameter of about 632 nm) was slightly shrunk and the surfaces became rough during the subsequent calcination process due to the decomposition of the precursor and crystallization of the YOF, which is confirmed by the EDX images of Fig. 3c and d.19 EDX spectra confirm the presence of Y, C, O and F elements in the precursor samples (Fig. 3c). After calcination of the precursor at 550 °C for 3 h, element C almost disappeared (Si from the Si substrate), and the samples mainly consist of Y, O and F (Fig. 3d), which can give further support for the XRD and FT-IR analysis mentioned above.
Generally, the successful synthesis of the nano-/micromaterials in a solution-based system not only depends on the intrinsic structure of the target compounds but also requires more fastidious control of the growth parameters such as temperatures, organic additives, types of raw materials, pH values and so forth. The effects of the different pH values and F− sources on the morphologies and sizes of the final products are discussed in detail in the following paragraphs. Fig. 4 shows the SEM images of the products obtained under the same conditions but at various pH values. As seen from the SEM images, YOF materials with various morphologies can be obtained by simply adjusting the pH values of the initial solution. At pH = 2, the obtained YOF crystals consist of a large quantity of uniform nanospheres with diameters of about 264 nm and peanut-shaped particles, which are 1.34 μm in diameter and 2.54 μm in length (Fig. 4a). When the pH value is further increased to 3, the products consist of many spheres (a diameter of about 208 nm) and a few rods (a diameter of about 437 nm and a length of about 912 nm) (Fig. 4b). By increasing the pH value from 3 to 4 (Fig. 4c), many nanospheres and submicro rods were obtained, but the size of submicro rods was not uniform. A close observation reveals that the top/bottom of the prismatic nanorods has a convex structure with a smooth surface. As the pH value increased to 5, the products consist of nanospheres with diameters of about 379 nm, and ellipsoids with an average size of 760 nm in length and 1.1 μm in equator diameter (Fig. 4d). This result indicates that changing the pH value of the initial solution has an important influence on the size and morphology of the final products. As we know, the hydrolysis of NaBF4 produces many dissociated F− ions: BF4− + 3H2O → 3HF + F− + H3BO3 in aqueous solution. The release of F− was favorable when the pH was high and higher pH values point to a higher concentration of F− in the solution.16 When the temperature is above 83 °C, the urea decomposes to produce the precipitating ligands (mainly OH− and CO32−).19 An increase in the pH value would generate high concentration of F− and accelerate the precipitation of Y3+ to some extent, thus decreasing the concentration of Y3+ and eventually affecting the facets' growth kinetics.
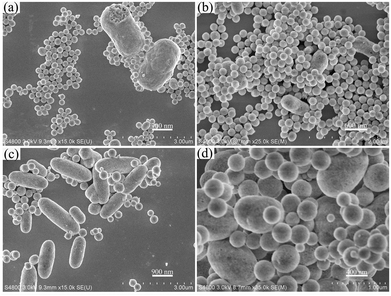 | ||
| Fig. 4 SEM images of the synthesized samples, with the pH values of the initial solution pH = 2 (a), pH = 3 (b), pH = 4 (c), and pH = 5 (d). | ||
The SEM images of YOF using NaF, NH4F and NH4BF4 as the fluorine ion sources are shown in Fig. 5. Different from the submicro spheres using NaF as a fluorine source, well-separated microspindles with a length of about 2.27 μm and a diameter of about 522 nm are obtained (Fig. 5a). Additionally, the products have very rough surfaces. When using NH4F as a fluorine source and maintaining the pH value at 2, the as-obtained product comprises of a large quantity of nanorods with a uniform size of 249 nm in diameter and 765 nm in length, as shown in Fig. 5b. A close observation reveals that the surface of some nanorods is not smooth. However, when increasing the pH value to 6 using NH4F as a fluorine source (Fig. 5c), the samples comprise a large quantity of ellipsoids (a length of about 273 nm and a diameter of about 191 nm) and a few microspindles (a length of about 2.9 μm and a diameter of about 929 nm). For the NH4BF4 system (Fig. 5d), it can be seen that the obtained samples are composed of monodispersed spindlelike nanorod bundles with diameters of about 404 nm and lengths of about 759 nm and have smooth surfaces. In addition, there are several large-sized microrods and the respective average length and diameter are about 3.3 μm and 1.53 μm. Therefore, the above results powerfully demonstrate that the use of different F− sources and specific pH values has a tremendous effect on the morphologies and sizes of the products. In our system, the cations of Na+ and NH4+ could be selectively adsorbed on different surfaces of the initial precursor crystals due to the strong interactions between these cations and OH−, CO32−, and F− anions during the early stage of the reactions and influence the corresponding surface energy, thus leading to the various morphologies.22,23 In conclusion, the above results prove that our approach is environmentally benign without adding any chelating agents or organic solvents and efficient to synthesize nano-/microscale luminescence materials with controlled morphologies.
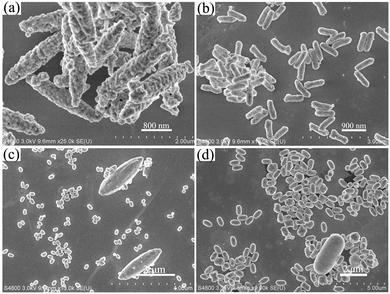 | ||
| Fig. 5 SEM images of the YOF samples prepared at pH = 6 with NaF as the F− source (a), at pH = 2 with NH4F (b), at pH = 6 with NH4F (c), at pH = 6 with NH4BF4 (d). | ||
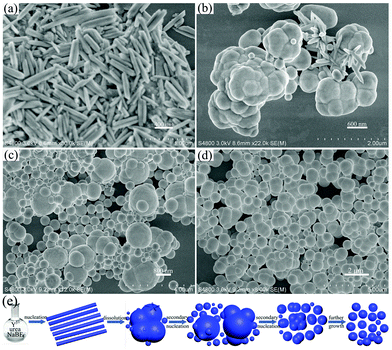
To gain more information to reveal the formation mechanism of the YOF submicro spheres, time-dependent experiments were carried out by keeping other reaction parameters unchanged (90 °C, pH = 6 with NaBF4 as the F− source), which is presented in Fig. 6. At the early stage of the reaction (10 min), the OH− and CO32− anions were released from the decomposition of urea at high temperature in aqueous solution.24 Subsequently, a fast nucleation process occurred and a large number of small particles were obtained, as shown in Fig. 6a. When the reaction time was extended to 20 min, a large number of irregular bulk particles were obtained (Fig. 6b), which may be due to the influence of surface energy. Small particles have high surface energy and the nanoparticles quickly aggregated together to form bulk particles in order to reduce the energy of the reaction system. A careful examination reveals that surfaces of bulk particles have some line defects and several nanospheres existing in the position of line defects. We believe that the line defects were created by the early fast dissolution event and served as pin-points for the secondary nucleation to occur and the movement of the newly formed nuclei is restricted to some extent due to the energy of the reaction system, which results in the formation of isotropic products.25–27 At a reaction time of 30 min (Fig. 6c), a large number of nanospheres formed on the surface of large particles. At the same time, the size of large particles decreases. When the reaction time is prolonged to 1 h (Fig. 6d), the size of the nanospheres has grown larger in all directions and the size uniformity is greatly improved. With further growth, the uniform submicro spheres are obtained. On the basis of the time-dependent results, we can conclude that there is a morphology evolution from amorphous nanoparticles to bulk particles, finally into submicro spheres and this conversion process can be rationally expressed as a dissolution-secondary nucleation mechanism. On the basis of the above experimental results and analysis, a schematic illustration for the formation of a YOF precursor is presented in Fig. 6e.
3.2 Photoluminescence properties
Our experimental results and previous investigations have shown that YOF is a good host lattice for the luminescence of various optically active lanthanide ions.13,19 Accordingly, we mainly focus on the luminescence properties of Eu, Tb, Dy, Tm single-doped and Dy/Tm co-doped YOF submicro spheres, in an effort to reveal that our current method is an efficient process for the preparation of these kinds of lanthanide oxyfluoride phosphors. Fig. 7 presents the PL excitation and emission spectra of the as-prepared YOF:Ln3+ (Ln = Eu, Tb, Dy, Tm) submicro spheres with a diameter of about 632 nm. Upon monitoring at a wavelength of 609 nm, the excitation spectrum of the YOF:0.05Eu3+ samples (Fig. 7a) consists of a strong absorption band centered at 236 nm and some weak lines, which are due to the charge transfer band (CTB) between the O2− and Eu3+ ions and the f–f transitions of the Eu3+ ions, respectively. Upon excitation at 392 nm, YOF:0.05Eu3+ samples exhibit strong red luminescence with the CIE (Commission Internationale de l'Eclairage 1931 chromaticity) chromaticity coordinate (0.656, 0.343) (point a in Fig. 10), and the corresponding emission spectrum consists of the characteristic transitions of Eu3+ within its 4f6 configuration, i.e., 5D1 → 7F1 (535 nm), 5D0 → 7F0 (579 nm), 5D0 → 7F1 (587 and 592 nm), 5D0 → 7F2 (609 and 629 nm), 5D0 → 7F3 (655 nm), 5D0 → 7F4 (706 nm).28,29 The emission spectrum is dominated by the hypersensitive transition (5D0 → 7F2) of Eu3+, indicating that the Eu3+ ions are located at sites without or deviating from inversion symmetry.30,31Fig. 7b shows the excitation and emission spectra of the YOF:0.02Tb3+ samples. The excitation spectrum of the YOF:0.02Tb3+ sample is mainly composed of two intense bands. The bands centered at 237 and 281 nm can be attributed to the spin allowed transition (ΔS = 0) with higher energy and the spin-forbidden transition (ΔS = 1) with lower energy from the 4f to 5d of the Tb3+ ions, respectively. Upon excitation at 237 nm, the emission spectrum consists of a group of lines centered at about 487, 543, 583, and 620 nm, which corresponds to the 5D4 → 7FJ (J = 6, 5, 4, 3) transitions of the Tb3+ ions, respectively.32 The CIE coordinate for the emission spectrum of YOF:0.02Tb3+ is determined to be (0.266, 0.635), located in the green region (point b in Fig. 10).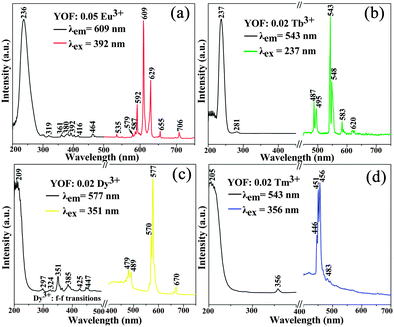 | ||
| Fig. 7 PL excitation and emission spectra of YOF:0.05Eu3+ (a), YOF:0.02Tb3+ (b), YOF:0.02Dy3+ (c), and YOF:0.02Tm3+ (d). | ||
The excitation spectra of YOF:0.02Dy3+ and YOF:0.02Tm3+ samples shown in Fig. 7c and d all consist of a broad band with maxima at 209 and 205 nm and some weak narrow lines at around 351 nm, which could be assigned to the host absorption and the typical 4fn → 4fn intraconfiguration forbidden transitions of Dy3+ and Tm3+, respectively.33 The YOF:0.02Dy3+ phosphor shows a strong yellow emission upon excitation at 351 nm. The emission peaks of YOF:0.02Dy3+ consist of two weak peaks at 479 nm, a strong peak at 577 nm and a weak peak at 670 nm (Fig. 7c), corresponding to the transitions 4F9/2 → 6H15/2, 4F9/2 → 6H13/2, and 4F9/2 → 6H11/2, respectively.34 The transition 4F9/2 → 6H13/2 belongs to the hypersensitive transition with ΔJ = 2, which is strongly influenced by the outside environment of Dy3+; thus, the (4F9/2 → 6H13/2)/(4F9/2 → 6H15/2) emission ratio (Y/B) of Dy3+ could also be used as a probe to detect the local symmetry of the activator ions, except for the (5D0 → 7F2)/(5D0 → 7F1) emission ratio of Eu3+.31,35 In the YOF system, the yellow emission 4F9/2 → 6H13/2 (electric dipole transition) is much stronger than the blue emission 4F9/2 → 6H15/2 (magnetic dipole transition), which confirms that Dy3+ ions are located in an asymmetrical chemical environment and the corresponding CIE coordinate located at the yellow region, as shown in point c in Fig. 10. The excitation and emission spectra of the YOF:0.02Tm3+ samples are shown in Fig. 7d. Upon excitation with 356 nm irradiation, the emission spectrum consists of 1D2 → 3F4 (446, 451 and 456 nm) and 1G4 → 3H6 (483 nm) of Tm3+, and the CIE coordinate located at the blue region with higher color purity, as shown in point d in Fig. 10.
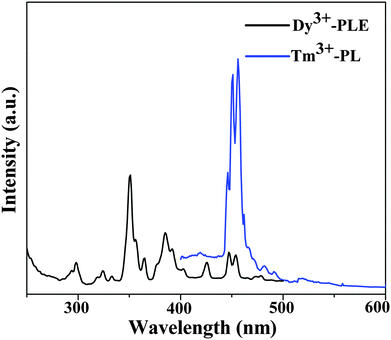
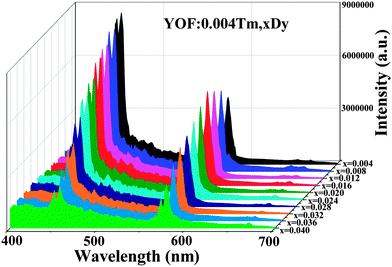
As shown in Fig. 8, the comparison between the PL spectrum of YOF:Tm3+ and the PLE spectrum of YOF:Dy3+ reveals an obvious spectral overlap between the emission band of Tm3+ centered at 456 nm (1D2 → 3F4) and the excitation transitions of Dy3+ (6H15/2 → 4I15/2). Therefore, the effective resonance energy transfer is expected to occur from Tm3+ to Dy3+ in the YOF host. In order to study the effect of doping concentration of Dy3+ ions on the luminescence properties of the phosphors, a series of YOF:0.004Tm3+,xDy3+ (x = 0.004–0.040) samples have been prepared. Fig. 9 demonstrates the emission spectra of the phosphors at an excitation of 356 nm. One can see that the emission intensity of the Tm3+ ions decreases monotonously with an increment of the Dy3+ content, while the emission intensity of the Dy3+ firstly increased to a maximum at x = 0.016 and then decreased due to concentration quenching. As a result, the photoluminescence colors can be tuned from blue and white to yellow including a point of (0.345, 0.311) close to daylight (0.33, 0.33) with a correlated color temperature (CCT) of 4840 K. The results can be confirmed by the corresponding CIE chromaticity diagram for the emission spectra of the Tm3+ and Dy3+ co-doped YOF samples and the results are shown in Fig. 10 and Table 1. This result indicates that the as-obtained phosphors could show merits of multicolor emissions in the visible region when excited by a single wavelength light, which might find potential applications in the fields such as WLEDs, light display systems and optoelectronic devices.
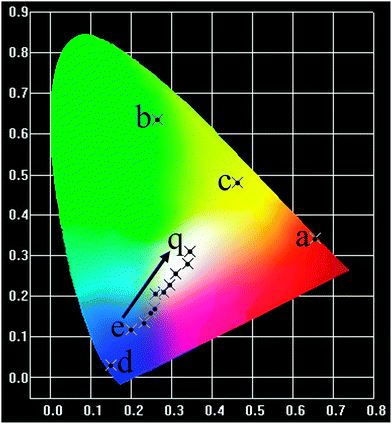 | ||
| Fig. 10 The corresponding CIE chromaticity diagram of the YOF:Ln3+ (Ln = Eu, Tb, Dy, Tm, and Tm/Dy) phosphors. | ||
| No. of the point in the CIE diagram | Sample compositions | Excitation (nm) | CIE (x, y) | CCT (K) |
|---|---|---|---|---|
| a | YOF:0.05Eu3+ | 392 | (0.656, 0.343) | 2844 |
| b | YOF:0.02Tb3+ | 237 | (0.266, 0.635) | 6602 |
| c | YOF:0.02Dy3+ | 351 | (0.463, 0.480) | 3135 |
| d | YOF:0.02Tm3+ | 356 | (0.149, 0.029) | 1717 |
| e | YOF:0.004Tm3+,0.004Dy3+ | 356 | (0.201, 0.118) | 2549 |
| f | YOF:0.004Tm3+,0.008Dy3+ | 356 | (0.233, 0.136) | 2673 |
| g | YOF:0.004Tm3+,0.012Dy3+ | 356 | (0.248, 0.159) | 5930 |
| h | YOF:0.004Tm3+,0.016Dy3+ | 356 | (0.258, 0.170) | 7475 |
| i | YOF:0.004Tm3+,0.020Dy3+ | 356 | (0.260, 0.206) | 95![[thin space (1/6-em)]](https://www.rsc.org/images/entities/char_2009.gif) 508 508 |
| k | YOF:0.004Tm3+,0.024Dy3+ | 356 | (0.281, 0.209) | 42![[thin space (1/6-em)]](https://www.rsc.org/images/entities/char_2009.gif) 640 640 |
| m | YOF:0.004Tm3+,0.028Dy3+ | 356 | (0.294, 0.227) | 15![[thin space (1/6-em)]](https://www.rsc.org/images/entities/char_2009.gif) 249 249 |
| n | YOF:0.004Tm3+,0.032Dy3+ | 356 | (0.311, 0.256) | 7901 |
| p | YOF:0.004Tm3+,0.036Dy3+ | 356 | (0.329, 0.279) | 5739 |
| q | YOF:0.004Tm3+,0.040Dy3+ | 356 | (0.345, 0.311) | 4840 |
4. Conclusions
Multiform YOF:Ln3+ (Ln = Eu, Tb, Dy, Tm) nano-/microcrystals, including submicro spheres, ellipsoids, nanorods and microspindles have been synthesized via a facile modified urea based homogeneous precipitation technique followed by a heat treatment process. The influences of pH values and fluoride sources on the morphologies of YOF have been investigated in detail. The possible formation mechanism for the precursor has been presented. Various luminescence colors could be obtained easily in YOF:Ln3+ submicro spheres because of the characteristic f–f transitions of Ln3+ ions under UV light excitation. Moreover, the PL emission colors of the Dy3+ and Tm3+ codoped YOF samples can be tuned from yellow and white to blue by adjusting the relative doping concentrations of the activator ions, which indicates that the synthesized phosphors could show merits of multicolor emissions in the visible region when excited by a single wavelength excitation. These merits of multicolor emissions in the visible region endow this kind of material with potential applications in the field of light display systems and white UV LEDs.Acknowledgements
This present work was financially supported by the Mineral and Ore Resources Comprehensive Utilization of Advanced Technology Popularization and Practical Research (MORCUATPPR) funded by China Geological Survey (Grant No. 12120113088300); and the Key Technology and Equipment of Efficient Utilization of Oil Shale Resources, No. OSR-5.Notes and references
- Q. L. Dai, M. E. Foley, C. J. Breshike, A. Lita and G. F. Strouse, J. Am. Chem. Soc., 2011, 133, 15475 CrossRef CAS PubMed.
- H. A. Höppe, Angew. Chem., Int. Ed., 2009, 48, 3572 CrossRef PubMed.
- H. Daicho, T. Iwasaki, K. Enomoto, Y. Sasaki, Y. Maeno, Y. Shinomiya, S. Aoyagi, E. Nishibori, M. Sakata and H. Sawa, Nat. Commun., 2012, 3, 1132 CrossRef PubMed.
- G. Zhu, Z. P. Ci, Q. Wang, Y. Wen, S. C. Han, Y. R. Shi, S. Y. Xin and Y. H. Wang, J. Mater. Chem. C, 2013, 1, 4490 RSC.
- C. C. Wu, K. B. Chen, C. S. Lee, T. M. Chen and B. M. Cheng, Chem. Mater., 2007, 19, 3278 CrossRef CAS.
- X. W. Lou, L. A. Archer and Z. Yang, Adv. Mater., 2008, 20, 3987 CrossRef CAS.
- S. R. Challa, A. T. Delariva, T. W. Hansen, S. Helveg, J. Sehested, P. L. Hansen, F. Garzon and A. K. Datye, J. Am. Chem. Soc., 2011, 133, 20672 CrossRef CAS PubMed.
- Y. Gao, M. M. Fan, Q. H. Fang and F. Yang, New J. Chem., 2014, 38, 146 RSC.
- G. Jia, M. Yang, Y. H. Song, H. P. You and H. J. Zhang, Cryst. Growth Des., 2009, 9, 301 CAS.
- H. X. Mai, Y. W. Zhang, L. D. Sun and C. H. Yan, Chem. Mater., 2007, 19, 4514 CrossRef CAS.
- H. X. Mai, Y. W. Zhang, R. Si, Z. G. Yan, L. D. Sun, L. P. You and C. H. Yan, J. Am. Chem. Soc., 2006, 128, 6426 CrossRef CAS PubMed.
- Y. P. Du, Y. W. Zhang, Z. G. Yan, L. D. Sun and C. H. Yan, J. Am. Chem. Soc., 2009, 131, 16364 CrossRef CAS PubMed.
- Y. Zhang, X. J. Li, D. L. Geng, M. M. Shang, H. Z. Lian, Z. Y. Cheng and J. Lin, CrystEngComm, 2014, 16, 2196 RSC.
- M. M. Shang, D. L. Geng, X. J. Kang, D. M. Yang, Y. Zhang and J. Lin, Inorg. Chem., 2012, 51, 11106 CrossRef CAS PubMed.
- Y. Zhang, X. J. Kang, D. L. Geng, M. M. Shang, Y. Wu, X. J. Li, H. Z. Lian, Z. Y. Cheng and J. Lin, Dalton Trans., 2013, 42, 14140 RSC.
- R. Yang, G. Qin, D. Zhao, K. Zheng and W. Qin, J. Fluorine Chem., 2012, 140, 38 CrossRef CAS PubMed.
- G. Malandrino, L. M. Perdicaro and I. L. Fragalà, Chem. Vap. Deposition, 2006, 12, 736 CrossRef CAS.
- T. Grzyb, M. Weclawiak, J. Rozowska and S. Lis, J. Alloys Compd., 2013, 576, 345 CrossRef CAS PubMed.
- Y. Zhang, D. L. Geng, X. J. Kang, M. M. Shang, Y. Wu, X. J. Li, H. Z. Lian, Z. Y. Cheng and J. Lin, Inorg. Chem., 2013, 52, 12986 CrossRef CAS PubMed.
- T. Grzyb, M. Wcławiak and S. Lis, J. Alloys Compd., 2012, 539, 82 CrossRef CAS PubMed.
- C. X. Li, J. Yang, P. P. Yang, H. Z. Lian and J. Lin, Chem. Mater., 2008, 20, 4317 CrossRef CAS.
- M. Wang, Q. L. Huang, J. M. Hong, X. T. Chen and Z. L. Xue, Cryst. Growth Des., 2006, 6, 2169 CAS.
- L. Vayssières, C. Chanéac, E. Tronc and J. P. Jolivet, J. Colloid Interface Sci., 1998, 205, 205 CrossRef PubMed.
- J. G. Li, X. Li, X. Sun, T. Ikegami and T. Ishigaki, Chem. Mater., 2008, 20, 2274 CrossRef CAS.
- T. L. Sounart, J. Liu, J. A. Voigt, M. Huo, E. D. Spoerke and B. McKenzie, J. Am. Chem. Soc., 2007, 129, 15786 CrossRef CAS PubMed.
- X. Wang and Y. Li, Angew. Chem., Int. Ed., 2002, 41, 4790 CrossRef CAS PubMed.
- C. Li, J. Yang, Z. Quan, P. Yang, D. Kong and J. Lin, Chem. Mater., 2007, 19, 4933 CrossRef CAS.
- G. Jia, K. Liu, Y. H. Zheng, Y. H. Song, M. Yang and H. P. You, J. Phys. Chem. C, 2009, 113, 6050 CAS.
- Z. H. Xu, B. Feng, S. S. Bian, T. Liu, M. L. Wan, Y. Gao, D. Sun, X. Gao and Y. G. Sun, J. Solid State Chem., 2012, 196, 301 CrossRef CAS PubMed.
- M. Yang, X. D. Zhao, Y. Ji, F. Y. Liu and X. Y. Liu, New J. Chem., 2014, 38, 4249 RSC.
- Q. Su, Z. Pei, L. Chi, H. Zhang, Z. Zhang and F. Zou, J. Alloys Compd., 1993, 192, 25 CrossRef CAS.
- X. F. Qiao and B. Yan, New J. Chem., 2011, 35, 568 RSC.
- R. Krishnan D. Geng and J. Thirumalai, New J. Chem., 2014, 38, 3480 RSC.
- H. X. Guan, G. X. Liu, J. X. Wang, X. T. Dong and W. S. Yu, J. Phys. Chem. C, 2009, 113, 3844 Search PubMed.
- M. Yu, J. Lin and J. Fang, Chem. Mater., 2005, 17, 1783 CrossRef CAS.
| This journal is © The Royal Society of Chemistry and the Centre National de la Recherche Scientifique 2015 |

