 Open Access Article
Creative Commons Attribution 3.0 Unported Licence
Strong fluorescence emission localized at a tapered silver-plated sub-wavelength pore†
Jin-Lei
Yang
,
Shuo-Hui
Cao
,
Qian
Liu
,
Shuang
Zhao
,
Yu-Bin
Zheng
and
Yao-Qun
Li
*
Department of Chemistry and the MOE Key Laboratory of Spectrochemical Analysis & Instrumentation, College of Chemistry and Chemical Engineering, Xiamen University, Xiamen, 361005, P. R. China. E-mail: yaoqunli@xmu.edu.cn; Fax: +86-592-2185875; Tel: +86-592-2185875
First published on 1st October 2014
Abstract
We observed up to 200 times fluorescence enhancement inside a tapered silver-plated sub-wavelength pore in comparison with the free space fluorescence. Fluorescence lifetime data was obtained to explore the strong fluorescence enhancement. The mechanism mainly arises from the silver film, the lateral dimensional shape, and size of the waveguide aperture.
Fluorescence enhancement has attracted much attention due to the extensive fluorescence-based applications in the field of molecular biology, medical imaging and chemical sensing. The investigation of the tiny metallic holes and their extraordinary optical phenomena has been explored in recent years.1 For instance, there is an extraordinary optical transmission through sub-wavelength holes.2 Plasmonic antennas are capable of creating a highly enhanced local electric field and distinguishing between different kinds of fluorescent dyes.3 Metal-clad sub-wavelength circular apertures have been successfully applied to distinguish a single molecule from large numbers and useful for real-time DNA sequencing since it can enormously reduce detection volume.4
Metallic nanostructures can bring about tremendous fluorescence enhancement.1 Specifically, metallic structures acting as antennas or waveguides can boost the absorption or excitation of the molecules in their vicinity, accompanied by an enhanced surface electric field confirmed to be an important factor in the aperture-enhanced fluorescence process.1 Plasmonic nanostructures can convert optical radiation into intense, engineered, localized field distributions and can also have surprising effect on fluorescence.1d,5 Specifically, sub-wavelength metal holes with dimensions around the cutoff of the fundamental guided mode have the optimum effect on emission enhancement, where it can get the maximum local density of optical states.6,7 Such nanostructures with their controlled shape and size also have their unique advantage in acting as a small reaction chamber or a convenient platform that allows highly parallel solution analysis.6 According to previous reports, the fluorescence enhancement factors of metallic holes are commonly from several times to just more than a dozen times.6,8 Tapered waveguides can make the electromagnetic energy fit into a tight confinement at the space of a small tip,9a,b which is advantageous for sensing applications.9c Actually, there is a constant pursuit for a simple platform being capable of efficiently concentrating light into a confined space with an intense local field. To the best of our knowledge, the experimental investigation of fluorescence properties within a tapered silver-plated sub-wavelength pore (TSSP) have not been reported previously. Here, we have focused on isolated tapered silver-plated sub-wavelength pores fabricated by a simple method and observed 200 times of fluorescence emission enhancement for Rhodamine B molecules in the tip space of the pore channel.
The TSSP used in this study was fabricated by using a template deposition method through two simple steps. First, a tapered single glass sub-wavelength pore channel prepared from a glass capillary10 was chosen as the template. Afterwards, a thin silver film was deposited on the inner-surface of the pore channel through an electroless plating methodology,11 which is advantageous for producing high aspect ratio structures since the deposition is from the surface outwards. Modulation of the glass pore channel template or controlling of the silver plating process can allow us to regulate and control the shape, size and inner-surface morphology of the tapered pore channel. SEM (scanning electron microscopy) and bright-field images of the silver-plated pore channel are shown in Fig. 1. EDS (energy-dispersive spectrometry) confirmed that the plated material was silver indeed (Fig. S2, ESI†). This method has ease of preparation and is more economical than other methods such as track etching, ion-sputtering or lithography12 to produce tiny metallic holes.
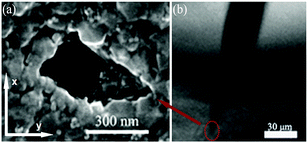 | ||
| Fig. 1 Features of the silver-plated hole. (a) SEM image of the TSSP tip from the capillary bottom surface side. (b) Bright-field image of the silver pore channel, objective (20 × 0.7 NA). | ||
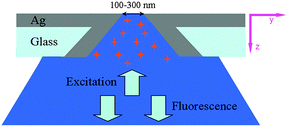
We tested the ability of fluorescence enhancement of the device through fluorescence detection. The Rhodamine B solution was injected into the glass capillary with a 100 μL microsyringe and was followed by 3 min mild sonication. This operation was repeated several times to ensure the tiny pore was being saturated with dye molecules. The tapered tiny pore was placed on a cover-slip with its large base directly over the objective. Therefore, the tracing of light was not affected by the silver layer (Scheme 1), and the detection of fluorescence emission was not affected either, as the penetration from the small tip base would cause some loss of signal intensity. Thus the excitation of surface plasmon polaritons (SPPs) can be directly generated in the inner-surface of the TSSP. Confocal fluorescence measurements were performed on an inverted confocal microscope (Leica TCS SP5, Leica Microscopy) to investigate the property of Rhodamine B inside the TSSP. The excitation source was an argon ion laser 514 nm/2 mW and objective was 20 × 0.7 NA. The confocal laser scanning microscopy (CLSM) can offer an opportunity to detect localized fluorescence by moving the observation volume to different positions in the sub-wavelength pore channel, since it can probe different sections of an intact tapered pore channel.13 Besides, fluorescence lifetime imaging (FLIM) measurements were also applied in the experiments using the above Leica Microscope.
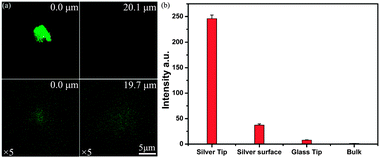
Z-stacks taken through x and y-directions were scanned across the whole tapered pore channel filled with 10 μM water solution of Rhodamine B dye. The measurements were performed using 20 × 0.7 NA objective with a confocal pinhole of 25 μm. The scanned images contain 1024 × 1024 pixels. Fluorescence emission images of different optical sections were obtained as shown in Fig. 2. The confocal fluorescence feature from the emission of RhB molecules within the tapered pore channel became bigger with an increase in the pore diameter when scanning to deeper depth distances. More images of optical sections were presented in Fig. S3, ESI.† The measurements started from the outside of the pore and passed through the pore, then through the dye filled pore channel. The brightest spot was localized at the tip pore (0 μm) according to a parallel intensity analysis (Fig. S4b, ESI†). From that point onwards, the intensity was steadily decreased to the free space value. The fluorescence signal from the tapered silver inner-surface can be also detected due to the optical section thickness, thereby making the fluorescence spot appear bigger than its actual size. Diffraction limits also existed in this system. Although, not all fluorescent molecules in the tip of the pore channel had been enhanced and the quenching effect might happen very close, within ∼10 nm scale, to the silver surface,14 the detection of the integral signal of that area was still strong. This also indicates that it formed a strong local electric field around the tip area. The emission intensity of dye molecules was analyzed from the tip space to the free space of the pore channel which was over 20 μm (Fig. 3a) away from the tip (both plasmonic and dimensional effects were not anticipated). The emission from the free space was measured under identical conditions with the tip region during one single experiment. The tip space fluorescence intensity was taken from the average value of three analysis line peaks (Fig. S5 in the ESI†) around the hole, and the bulk solution intensity was taken from the average value of the second part of the lines (20–30 μm). In comparison with the free space fluorescence, the fluorescence enhancement of the TSSP tip area was approximately 200-fold for Rhodamine B molecules, even though the dye molecules within the tip area suffered from filter effect to some degree (Fig. 3b). This can be explained by the gradient shape of the tapered pore channel waveguide, essentially accumulating energy, and giant local field at the tip space.1,9a,b Consequently, excitation, collection and emission efficiency all can be positively altered by the high local field.15 Specifically, the rough silver inner-surface16 made a contribution to the fluorescence enhancement by about 30-fold (Fig. 3b). The silver inner-surface fluorescence intensity was taken from the average value of three analysis line peaks (Fig. S5, ESI†) near the silver inner-surface.
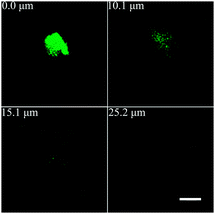 | ||
| Fig. 2 Confocal fluorescence images at different depth distances from the tip to the large base within the tapered pore channel (scale bar 5 μm). | ||
The confocal fluorescence images of a comparable sized glass tapered pore channel are shown at two positions with an increased dye concentration (50 μM) in order to enhance the weak signals (Fig. 3a). The emission intensity near the hole showed over 6-fold enhancement in this glass tapered pore (Fig. 3b). This enhancement can be explained by dielectric tiny structures also generating an enhanced local field.17
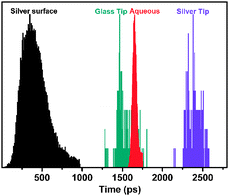
FLIM measurements were taken to further investigate the enhancement mechanism. The measurements were carried out using a pulsed/60 ps 405 nm excitation laser. Data analysis was conducted using SPC-830 software. As shown in Fig. 4, the total lifetime τ for RhB dye molecules in aqueous solution was 1.65 ± 0.02 ns, which is consistent with previous studies.18 The total lifetimes at the glass pore tip, the silver pore tip, and the silver surface were 1.53 ± 0.04 ns, 2.39 ± 0.04 ns, 0.42 ± 0.10 ns, respectively. The results indicate that the total lifetime in the glass pore tip was shorter than that in aqueous solution, and the total lifetime in the silver pore tip was longer than those at the silver surface and in aqueous solution. We also measured the lifetimes with different tip diameters in Fig. S6 (ESI†) and found the results were consistent.
For the lifetime at the glass tip, the total lifetime at the glass pore tip is shorter than that in aqueous solution (Fig. 4). In other words, the decay rate for dye molecules in the glass pore tip was faster than that in aqueous solution. Generally, like the cavity mode,19 the incorporated dye absorbs energy from an incident laser pulse and then relaxes back to its ground state by coupling to the aperture, leading to an enhanced emission rate resulting in an enhanced emission intensity (Fig. 3b). The fast decay rate should be related to the dye molecules being influenced by this aperture-enhanced fluorescence process. The lifetime at the silver surface is much shorter than that in aqueous solution, as shown in Fig. 4, which is consistent with previous metallic-fluorescence systems.5b An increase in the total lifetime happens with increasing the distance from the metal surface.15,20 In the experiment, the dye molecules within the scope either close to or far away the silver surface (pore diameter ∼300 nm) were all imaged in the FLIM measurements at the pore tip area. Accordingly, we found that the total lifetime at the silver pore tip became longer than that at the silver surface, and even than that in aqueous solution for RhB as shown in Fig. 4.
As we know, the radiative rates with plasmon, γsprad, are related with the electric field |E|2 as γsprad ∝ |E|2γ0rad,15 where γ0rad is the radiative rate without plasmon. Therefore, the radiative rate was increased because of the high local electric field at the silver pore tip. Besides, τ = 1/(γsprad + γspnrad), where τ is the total lifetime and γspnrad is the nonradiative rate. As the total lifetime was influenced by both the radiative and nonradiative processes, consequently the longer lifetime at the silver pore tip should indicate that the nonradiative decay rate due to energy dissipation in the environment must have been largely decreased, which played a dominant role in the total decay rate in the case of an increase in the radiative rate. Although RhB is an efficient dye molecule with quantum yield 0.31, its nonradiative decay also accounts for a large ratio in the total decay process.5c,15
The fluorescence intensity is the product of two processes: (1) excitation by the incident field influenced by the local environment; (2) emission of radiation influenced by the balance of radiative and nonradiative decay.21 Generally, fluorescence rate γem can be expressed as γem = γexc[γsprad/(γsprad + γspnrad)],1d where γexc is the excitation rate which can also be increased as γexc ∝ |P·E|2,1d where P is the dipole moment. To sum up, the excitation and the radiative rates are enhanced while the observed total decay rate is decreased, which leads to a significantly enhanced γem resulting in a strong fluorescence emission in the tip of the TSSP.
In summary, we found the fluorescence enhancement is significantly high by 200-fold by using the TSSP. This metallic gradient tiny pore channel affects fluorescence emission greatly despite its conceptual simplicity. The fluorescence enhancement of TSSP should mainly arise from the silver film, the lateral dimensional shape and size of the waveguide aperture by concentrating the local electromagnetic field on the pore channel tip space. Our results not only demonstrate significant plasmonic-aperture effects in a metallic optical structure, but also suggest a route to extend such effects to future plasmonic optical platform sensor designs. With flexible controlling of the pore channel parameters such as field strength and the scale of the sensing tip zone, this proposed approach would allow for tailoring the pore to suit many chemical or biological sensing applications.
Experimental
Glass capillaries were purchased from Hirschmann. The main materials were purchased from Alfa Aesar or Acros, and chemicals used were of analytical grade and without further purification. Please see the ESI† for more details about the materials and instruments, and a complete description of the tiny pore syntheses and characterizations. Additional results of confocal scanning and lifetime measurements were also provided.Acknowledgements
This work was supported by NSFC (21375111, 21127005), the 973 Program (2013CB933703) and the funds of MOE (20110121110011, PCSIRT IRT13036).Notes and references
- (a) C. Genet and T. W. Ebbesen, Nature, 2007, 445, 39–46 CrossRef CAS PubMed; (b) W. L. Barnes, A. Dereux and T. W. Ebbesen, Nature, 2003, 424, 824–830 CrossRef CAS PubMed; (c) T. H. Park, N. Mirin, J. B. Lassiter, C. L. Nehl, N. J. Halas and P. Nordlander, ACS Nano, 2008, 2, 25–32 CrossRef CAS PubMed; (d) J. A. Schuller, E. S. Barnard, W. S. Cai, Y. C. Jun, J. S. White and M. L. Brongersma, Nat. Mater., 2010, 9, 193–204 CrossRef CAS PubMed; (e) Y. Q. Li, Y. B. Zheng and R. N. Zare, ACS Nano, 2012, 6, 993–997 CrossRef CAS PubMed; (f) T. Yasui, N. Kaji, M. R. Mohamadi, Y. Okamoto, M. Tokeshi, Y. Horiike and Y. Baba, ACS Nano, 2011, 5, 7775–7780 CrossRef CAS PubMed.
- (a) H. F. Ghaemi, T. Thio, D. E. Grupp, H. J. Lezec and T. W. Ebbesen, Phys. Rev. B: Condens. Matter Mater. Phys., 1998, 58, 6779–6782 CrossRef CAS; (b) K. Imura, K. Ueno, H. Misawa and H. Okamoto, Nano Lett., 2011, 11, 960–965 CrossRef CAS PubMed.
- H. Aouani, O. Mahboub, E. S. Devaux, H. Rigneault, T. W. Ebbesen and J. Wenger, Nano Lett., 2011, 11, 2400–2406 CrossRef CAS PubMed.
- J. Eid, et al. , Science, 2009, 323, 133–138 CrossRef CAS PubMed.
- (a) S. H. Cao, W. P. Cai, Q. Liu, K. X. Xie, Y. H. Weng and Y. Q. Li, Chem. Commun., 2014, 50, 518 RSC; (b) Y. Fu, J. Zhang and J. R. Lakowicz, Chem. Commun., 2012, 48, 9726 RSC; (c) K. J. Russell, T. L. Liu, S. Cui and E. L. Hu, Nat. Photonics, 2012, 6, 459–462 CrossRef CAS; (d) H. F. Yuan, S. Khatua, P. Zijlstra, M. Yorulmaz and M. Orrit, Angew. Chem., Int. Ed., 2013, 52, 1217–1221 CrossRef CAS PubMed; (e) A. Hakonen, Sci. World J., 2013, 2013, 624505 Search PubMed.
- D. Gérard, J. Wenger, N. Bonod, E. Popov, H. Rigneault, F. Mahdavi, S. Blair, J. Dintinger and T. W. Ebbesen, Phys. Rev. B: Condens. Matter Mater. Phys., 2008, 77, 045413 CrossRef.
- F. Westerlund, F. Persson, A. Kristensen and J. O. Tegenfeldt, Lab Chip, 2010, 10, 2049–2051 RSC.
- G. W. Lu, W. Q. Li, T. Y. Zhang, S. Yue, J. Liu, L. Hou, Z. Li and Q. H. Gong, ACS Nano, 2012, 6, 1438–1448 CrossRef CAS PubMed.
- (a) A. R. Davoyan, I. V. Shadrivov, A. A. Zharov, D. K. Gramotnev and Y. S. Kivshar, Phys. Rev. Lett., 2010, 105, 116804 CrossRef PubMed; (b) M. I. Stochman, Phys. Rev. Lett., 2004, 93, 137404 CrossRef; (c) C. C. Harrell, Z. S. Siwy and C. R. Martin, Small, 2006, 2, 194–198 CrossRef CAS PubMed.
- (a) B. Zhang, Y. Zhang and H. S. White, Anal. Chem., 2004, 76, 6229 CrossRef CAS PubMed; (b) S. Zhao, Y. B. Zheng, S. L. Cai, Y. H. Weng, S. H. Cao, J. L. Yang and Y. Q. Li, Electrochem. Commun., 2013, 36, 71–74 CrossRef CAS.
- (a) M. Davenport, K. Healy and Z. S. Siwy, Nanotechnology, 2011, 22, 155301 CrossRef PubMed; (b) H. L. He, X. L. Xu and Y. D. Jin, Anal. Chem., 2014, 86, 4815–4821 CrossRef CAS PubMed.
- (a) M. Taniguchi, M. Tsutsui, K. Yokota and T. Kawai, Appl. Phys. Lett., 2009, 95, 123701 CrossRef; (b) X. Hou, H. Dong, D. Zhu and L. Jiang, Small, 2010, 6, 361–365 CrossRef CAS PubMed.
- L. X. Zhang, X. H. Cao, W. P. Cai and Y. Q. Li, J. Fluoresc., 2011, 21, 1865–1870 CrossRef PubMed.
- (a) A. Hakonen, Anal. Chem., 2009, 81, 4555–4559 CrossRef CAS PubMed; (b) G. W. Ford and W. H. Weber, Phys. Rep., 1984, 113, 195–287 CrossRef CAS; (c) J. Kummerlen, A. Leitner, H. Brunner, F. R. Aussenegg and A. Wokaun, Mol. Phys., 1993, 80, 1031–1046 CrossRef; (d) A. Hakonen and N. Stromberg, Chem. Commun., 2011, 47, 3433–3435 RSC.
- B. Peng, Q. Zhang, X. F. Liu, Y. Ji, H. V. Demir, C. H. A. Huan, T. C. Sum and Q. H. Xiong, ACS Nano, 2012, 6, 6250–6259 CrossRef CAS PubMed.
- (a) S. A. Levi, A. Mourran, J. P. Spatz, F. C. Veggel, D. N. Reinhoudt and M. Moller, Chem. – Eur. J., 2002, 8, 3808–3814 CrossRef CAS PubMed; (b) W. Cao, T. Huang, X. Xu and H. E. Ali, J. Appl. Phys., 2011, 109, 034310 CrossRef PubMed.
- (a) S. M. Wells, I. A. Merkulov, I. I. Kravchenko, N. V. Lavrik and M. J. Sepaniak, ACS Nano, 2012, 4, 2948–2959 CrossRef PubMed; (b) A. J. Shields, Nat. Photonics, 2007, 1, 215–223 CrossRef CAS.
- N. Boens, Anal. Chem., 2007, 79, 2137–2149 CrossRef CAS PubMed.
- K. J. Vahala, Nature, 2003, 424, 839–846 CrossRef CAS PubMed.
- K. Ray, R. Badugu and J. R. Lakowicz, Langmuir, 2006, 22, 8374–8378 CrossRef CAS PubMed.
- P. Anger, P. Bharadwaj and L. Novotny, Phys. Rev. Lett., 2006, 96, 113002 CrossRef PubMed.
Footnote |
| † Electronic supplementary information (ESI) available: The experimental details of the preparation of tapered sub-wavelength glass pore, diameter measuring, silver electroless plating procedures, SEM and EDS images of the silver-plated pore channel, additional fluorescence confocal images with intensity analysis and lifetime measurements. See DOI: 10.1039/c4nj01094a |
| This journal is © The Royal Society of Chemistry and the Centre National de la Recherche Scientifique 2015 |

