Comparative studies on OLED performances of chloro and fluoro substituted Zn(II) 8-hydroxyquinolinates†
Yanping
Huo
*ab,
Jiguo
Lu
a,
Tianhua
Lu
a,
Xiaoming
Fang
a,
Xinhua
Ouyang
*c,
Li
Zhang
a and
Guozan
Yuan
*d
aSchool of Chemical Engineering and Light Industry, Guangdong University of Technology, Guangzhou 510006, China. E-mail: yphuo@gdut.edu.cn
bKey laboratory of Organofluorine Chemistry, Shanghai Institute of Organic Chemistry, Chinese Academy of Sciences, Shanghai 200032, China
cNingbo Institute of Material Technology and Engineering, Chinese Academy of Sciences, Ningbo 315201, China. E-mail: ouyangxh@nimte.ac.cn
dSchool of Chemistry and Chemical Engineering, Anhui University of Technology, Maanshan 243002, China. E-mail: guozan@ahut.edu.cn
First published on 13th October 2014
Abstract
Two novel 8-hydroxyquinoline metallic derivatives, (E)-2-[(2,3,4,5-tetrafluorophenyl)ethenyl]-8-hydroxyquinolate zinc (5) and (E)-2-[2-(2,6-dichlorophenyl)ethenyl]-8-hydroxyquinolate zinc (6) were synthesized and characterized by 1H NMR, ESI-MS, FT-IR and elemental analysis. Photoluminescence spectra revealed that the complexes showed strong fluorescence with maximum emissions at 575 and 607 nm. Compared with that of complex 5, the fluorescence quantum yield and average fluorescence lifetime of complex 6 were efficiently reduced. The heavy atom effect of Cl and distinct molecular interactions were found to play an important role in modulating or improving the properties of the complexes. Multilayer organic light-emitting diodes (OLEDs) were fabricated using these complexes. The results show they are good candidates for yellow OLEDs with maximum luminance of 7123 cd m−2 for compound 5 and 9143 cd m−2 for compound 6, as well as luminance efficiencies of 2.26 cd A−1 and 2.60 cd A−1, respectively. As the substituents are changed from fluorine to chlorine, the organic electroluminescent device based on the complex 6 shows overall better performance than that of complex 5. The calculated HOMO–LUMO energy gaps for complexes 5 and 6 were in good agreement with the experimental results.
1. Introduction
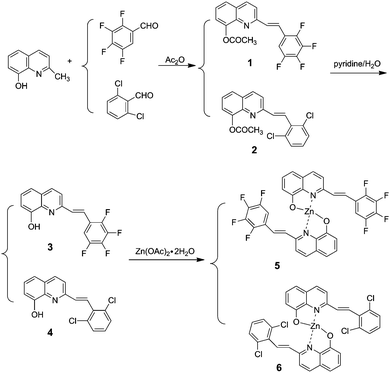
Organic light-emitting diodes (OLEDs) are being most extensively researched for many applications, including flat-panel displays and solid-state lightings.1,2 8-Hydroxyquinoline metal chelates are presently considered to be one of the most reliable electro-transporting and emitting materials applied in molecular-based OLEDs for their thermal stability, high fluorescence, and excellent electron-transporting mobility. Among the presently available light-emitting materials, the electron-transporting mobility of zinc complexes with 8-hydroxyquinoline goes beyond that of aluminum complexes, which is the most widely used electron-transporting material in OLEDs. Thus, zinc complexes may be potential candidates to enhance the electron-transporting properties for OLEDs.3,4 To obtain the tunable emissions of 8-hydroxyquinoline metal chelates, one of the alternatives is to introduce some functional groups into the quinoline ring.5 Numerous significant advances have been reported for the application of full-color OLEDs and solid-state lighting. For example, emission wavelengths of these Zn(II) 8-hydroxyquinolinates can be tuned to cover the entire visible spectral region by modifying or varying the 2-, 5- or 7-position of the 8-hydroxyquinoline rings.6–8 Furthermore, by combining an efficient hole-transport unit, including carbazole and triphenylamine units, single-layer devices with good carrier-transporting behaviors can be easily realized. Therefore, the design and preparation of novel substituted 8-hydroxyquinoline ligands for Zn complexes by a facile synthetic process with multiple functions, such as high emissive efficiency, good morphological and thermal stability, still remains one of the most active and challenging areas in this field.It has been reported that fluorinated organic semiconductors possess a long fluorescence lifetime, high fluorescence yield, excellent air stability and low sublimation temperature.9 On the other hand, the chlorinated organic semiconductors possess good film-forming and mechanical properties for light-emitting device fabrication because the Cl atom can increase their solubility. For example, bis(5,7-dichloro-8-hydroxyquinolinato)zinc(II) chelate was found to be an efficient light emitting electroluminescent material.10 To our knowledge, there is no comparative study reported on halogen (F or Cl) substituted 8-hydroxyquinoline metal chelates, and it would be very interesting to investigate the substitution effect on the optical and electronic properties. With this aim, we developed two new Zn complexes with halogen substituents (F or Cl) in the 2-position of 8-hydroxyquinoline ring as shown in Scheme 1.
2 Results and discussions
2.1. Synthesis and structure description
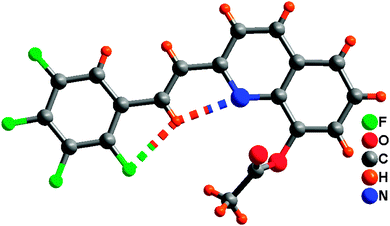
The synthetic route for the 8-hydroxyquinoline metal chelates is shown in Scheme 2; two ligands (3, 4) were synthesized by deacetylation of (E)-2-(2,3,4,5-tetrafluorophenyl)-8-acetoxyquinoline and (E)-2-(2,6-dichlorophenyl)-8-acetoxyquinoline, which were obtained by the condensation of 8-hydroxyquinaldine with 2,3,4,5-fluorobenzaldehyde and 2,6-dichlorobenzaldehyde in acetic anhydride.Single-crystal XRD data for compound 1 was collected on Bruker SMART 1000 CCD diffractometer collection. The empirical absorption correction was applied by using the SADABS program.33 The structure was solved using direct method, and refined by full-matrix least-squares on F2.34 The crystal structure data are shown in Table 1. The final factors were R1 = 0.0704, wR2 = 0.2105. The single-crystal X-ray diffraction study revealed that compound 1 was neutral. The dihedral angle (ca. 3.3°) between the quinoline and tetrafluorophenyl moieties indicates that the molecule is basically coplanar. In the crystal structure of compound 1, there are two weak nonclassical intramolecular hydrogen bonds between the pyridyl N atom (or tetrafluorophenyl F atom) and the C–H group of ethenyl [C(2)⋯N(1) = 2.756(2) Å; C(2)⋯F(1) = 2.838(2) Å] (Fig. 1), and two intermolecular hydrogen bonds (C(13)–H(13)⋯F(3), between C–H group of acetoxy and tetrafluorophenyl F atom, 3.370(2) Å; C(9)–H(9)⋯O(2), between the C–H group of quinoline and acetoxy O atom, 3.356(2) Å) (Fig. 2). Additionally, the face-to-face π⋯π stacking interactions exist between adjacent molecules (centroid–centroid distance of ca. 3.88 and 3.91 Å) and give rise to 2D supramolecular grid structure in compound 1 (Fig. 2).
| Empirical formula | C19 H11NO2 |
| Formula weight | 361.29 |
| Temperature | 293(2) K |
| Wavelength | 1.54178 Å |
| Crystal system | Monoclinic |
| Space group | P2(1)/n |
| Unit cell dimensions | a = 8.3016(3) Å, α = 90° |
| b = 12.1040(4) Å, β = 90° | |
| c = 16.4292(5) Å, γ = 90° | |
| Volume | 1632.99(9) Å3 |
| Z | 4 |
| Density (calculated) | 1.470 mg m−3 |
| Absorption coefficient | 1.099 mm−1 |
| F(000) | 736 |
| Crystal size | 0.21 × 0.19 × 0.16 mm3 |
| θ range for data collection | 4.55–67.05° |
| Limiting Indices | −9 ≤ h ≤ 8, −14 ≤ k ≤ 14, −19 ≤ l ≤ 19 |
| Reflections collected | 14![[thin space (1/6-em)]](https://www.rsc.org/images/entities/char_2009.gif) 160 160 |
| Independent reflections | 2895 [R(int) = 0.0391] |
| Completeness to theta = 27.08° | 99.1% |
| Max. and min. transmission | 0.8437 and 0.8020 |
| Data/restraints/parameters | 2895/30/212 |
| Goodness of fit on F2 | 1.131 |
| Final R indices [I > 2σ(I)] | R 1 = 0.0704, wR2 = 0.2105 |
| R indices (all data) | R 1 = 0.0817, wR2 = 0.2274 |
| Largest diff. peak and hole | 0.402 and −0.480 (e Å−3) |
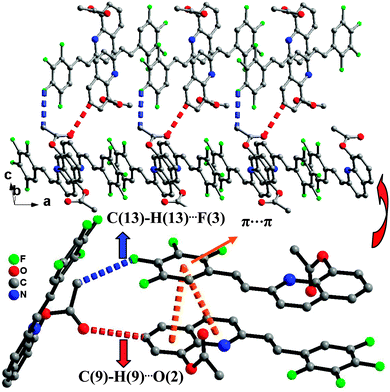 | ||
| Fig. 2 The 2D supramolecular structure of 1 mediated by hydrogen bonding and π⋯π stacking interactions. | ||
2.2. Optical absorption spectra
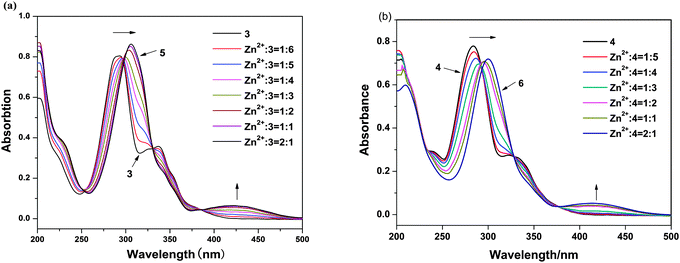
To further investigate the interaction mode of ligands with Zn2+ ions, the coordination reaction of ligands with Zn2+ ion was monitored through a UV-vis spectroscopic titration. The absorption bands of ligands in MeOH significantly changed on addition of Zn2+ ions (Fig. 3). After the addition of Zn2+ ion, the peaks of 3 and 4 at 206 nm exhibit hypochromism of 31% and 30% for complexes 5 and 6, respectively. The peaks of 3 and 4 at 293 and 285 nm showed significant bathochromism about 15 and 17 nm for the peaks of 5 and 6 at 308 and 302 nm, respectively. The absorption bands of 3 and 4 at 293 and 285 nm, respectively, originate from an intraligand π–π* transition of quinoline moiety. The bands of the n–π* electron transition of the N atom of the quinoline ring at 337 and 330 nm of 3 and 4 are found to become weak and finally disappear in the presence of increasing amounts of Zn2+ ion. This was a crucial evidence, indicating that the coordination bond was formed between HQ ligands and Zn2+ ion;11 thus the new bands at 428 and 418 nm of 5 and 6, respectively, which are newly produced and probably arise from the transition of the bonding electrons between Zn2+ ion and HQ ligand, mainly arise from the metal to ligand charge transfer transition (MLCT). This phenomenon suggests an enhancement of the π-conjugation due to the bidentate complexation of the ligand 3 and 4 to the d10 spectroscopically inactive Zn2+ ion.12 No differences were observed in the absorption spectra after the 1![[thin space (1/6-em)]](https://www.rsc.org/images/entities/char_2009.gif) :
:![[thin space (1/6-em)]](https://www.rsc.org/images/entities/char_2009.gif) 2 ratio of Zn2+/3 and 4; therefore, these experiments clearly indicate the formation of ZnL2.
2 ratio of Zn2+/3 and 4; therefore, these experiments clearly indicate the formation of ZnL2.
2.3. Photoluminescent spectra and lifetimes
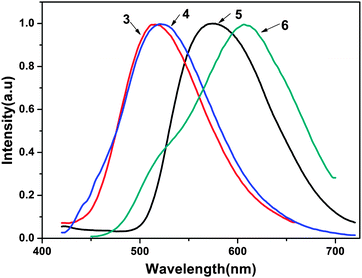
The photoluminescent (PL) spectra of ligands 3 and 4 and the complexes 5 and 6 are shown in Fig. 4. The PL spectra of ligands 3 and 4 were recorded with an excitation wavelength λex = 353 nm in methanol solution. The photophysical properties of 5 and 6, such as the absorption and emission maxima wavelengths (λmax and λem, respectively), fluorescence quantum yields, average fluorescence lifetimes and HOMO–LUMO energy gaps are listed in Table 2. As shown in Fig. 4, the two complexes emit a yellow to reddish orange color in methanol solution with maximum emission peaks at 575 nm for complex 5 and 607 nm for complex 6. The introduction of zinc(II) to ligands 3 and 4 led to a red-shift of 60 nm and 86 nm compared with their corresponding ligands, respectively (515 nm and 521 nm). The red-shift may be attributed to the following two reasons: the coordination of metal ions enhances the mobility of the electron transfer in the backbone and decreases the electron transition energy of intraligand charge transfer due to back-coupling π-bond between the metal and the ligand. On the other hand, the five-membered chelate rings formed between the NO coordination units and central metal centers increase the π–π* conjugation length and the conformational coplanarity, thus reducing the energy gap between the π and π* molecular orbital of the ligand.13 The maximum emission wavelengths of 5 and 6 are extraordinarily red-shifted in comparison with bis(2-methyl-8-hydroxyquinoline)zinc(II) (λem = 515 nm). The reason is that the conjugation of tetrafluorophenylethenyl or dichlorophenylethenyl substituents strengthens the coordination between 8-hydroxyquinoline and the zinc atom. It has been corroborated that the luminescence performance of Zn(II) 8-hydroxyquinolinates could be changed by modifying the 2-position of the 8-hydroxyquinoline rings.14| Complexes | λ max/nm | λ em/nm | τ/ns | φ S/% | HOMO/eV | LUMO/eV | E g/eV |
|---|---|---|---|---|---|---|---|
| 5 | 308 | 575 | 110.9 | 12.81 | −4.197 | −3.227 | 0.970 |
| 6 | 302 | 607 | 77.3 | 9.80 | −4.006 | −3.164 | 0.842 |
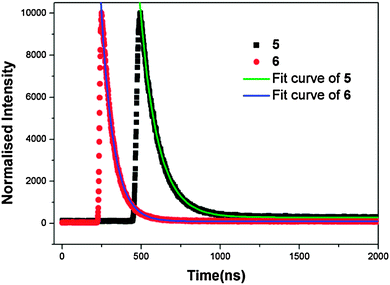
To further understand the fluorescent properties of complexes 5 and 6, their lifetimes were investigated in the solid state, as shown in Fig. 5. The τ value of 5 is 110.9 ns, whereas the value of complex 6 is 77.3 ns. The considerably shorter fluorescence lifetime of 6 may arise from a combined contribution from the heavy atom effect of Cl substitution and distinct molecular interactions in comparison with 5 in the solid state.15 Firstly, the Cl groups present in the scaffold will enhance the non-radiative intersystem crossing process (S → T1), and thereby significantly reduce the fluorescence lifetime of complex 6 due to the spin–orbital coupling mechanism. Secondly, in spite of the similar monomeric Zn(II) unit, 5 and 6 exhibit different structures controlled by the substituted groups (–Cl and –F) via intermolecular interaction. It has been demonstrated that the C–F⋯F–C interactions in the solid state can be useful for prolonging the fluorescence lifetime.16a
In addition, the fluorescence quantum yields (FPL) of complexes 5 and 6 were calculated by comparing the integrated photoluminescence intensities and the absorbance values of complexes 5 and 6 with the reference, quinine sulfate. Quinine sulfate (literature φST = 0.55) was dissolved in 0.5 M H2SO4 (refractive index (η) of 1.33). The samples were dissolved in THF (η = 1.43). The absorbency was controlled <0.05 for the samples and quinine sulfate. The fluorescence quantum yield was calculated using the equation: φS = φST (0.55) (AST/AS)(FS/FST)(ηS2/ηST2), where φ is the fluorescence quantum yield, A is the absorbency, F is the integrated photoluminescence intensity, η is the refractive index of the solvent, S is sample and ST is the standard of quinine sulfate (φST = 0.55). Based on the equation, the fluorescence quantum yields were calculated as 12.81% and 9.80% for 5 and 6 in THF, respectively, which are close to that of Alq3 in DMF (11.60%).16b The origin responsible for the distinct photophysical behaviors between 5 and 6 is presumably ascribed to the heavy atom effect of Cl substitution, which is significantly enhanced in the complex 6. In addition to the heavy atom effect of Cl, the conjugation of four fluorine atoms in the benzene ring of complex 5 strengthens the coordination between 8-hydroxyquinoline and the zinc atom, thus reducing the spin–orbit coupling and decreasing the chances of ultimately crossing from the singlet to the triplet state.16c
2.4. Thermostability analysis
The thermal properties of complexes 5 and 6 were investigated by thermogravimetric analysis/(TGA). The samples were heated in the range of 50–1000 °C with a heating rate of 20 K min−1. It can be seen in the Fig. 6(a) that no clear glass transition temperatures (Tg) was observed for them, whereas endothermic melting transition temperatures (Tm) appear clearly at 322 and 393 °C for 6 and 5, respectively. The decomposition temperatures (Td, corresponding to 5% weight loss) are 349 and 398 °C for 6 and 5, as shown in Fig. 6(b). Such high Tm and Td values indicate that these molecules are stable and have the potential to be fabricated into devices by vacuum thermal evaporation technology.17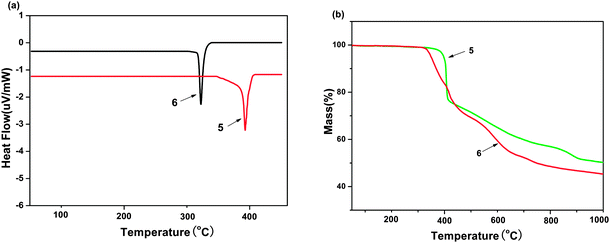 | ||
| Fig. 6 (a) DSC curve of curve of Zinc(II) complexes 5 and 6. (b) TGA curve of Zinc(II) complexes 5 and 6. | ||
2.5. Electronic structure
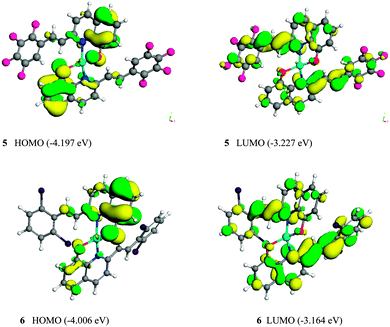
To further understand the variation of the photophysical properties of Zinc(II) complexes 5 and 6, especially how the substituents affect the HOMO, LUMO and energy band gaps, their molecular configuration and frontier molecular orbitals and geometrical structures were optimized using the DFT (density functional theory) model of a DMol3 package in Materials Studio (version 5.5). Atomic basis sets were applied numerically in terms of a double numerical plus polarization (DNP) function (including a polarized d-function for all non-hydrogen atoms and p-function for all hydrogen atoms),18 and a global orbital cutoff of 4.4 Å was employed. The size of the DNP basis set is comparable to Gaussian 6-31G(d), but the DNP is more accurate than the corresponding Gaussian basis set.19 The exchange–correlation interaction was treated within the generalized gradient approximation (GGA) with the functional parameterized by Perdew, Burke and Ernzerhof (PBE).20 The spin-polarization effects were also included in the calculations for the open-shell systems. In contrast to electrochemical analysis, DFT calculations were performed assuming that the complex is in the gaseous phase, such that the interaction between the complex and the solvent molecules can be eliminated. The results calculated by TD-DFT in Gaussian 03 were similar to the energy levels of 5 and 6, calculated by using the DFT (density functional theory) model of a DMol3 package (ESI,† S7–S9).The HOMO and LUMO of the Zn(L)2 monomers 5 and 6 are shown in Fig. 7. The HOMO and the LUMO are mainly dominated by molecular orbitals from the ligands 3 and 4. The contributions of Zn2+ ion of all these orbitals are negligibly small. For complexes 5 and 6, the electron density of the HOMO is localized mainly on the quinoline ring and ethylene part, whereas their LUMO distribute on the quinoline ring and the substituted arylethenyl moiety of one bridging ligand. Therefore, the electronic π–π* transitions in the complexes are localized on the 2-substituted 8-hydroxyquinoline ligands. The calculated HOMO–LUMO energy gaps (Eg) are summarized in Table 2: complex 5 has the lower HOMO energy level of −4.197 eV, whereas that of complex 6 is −4.006 eV. Therefore, it can be concluded that the moderate electron-withdrawing group (2Cl) stabilized the HOMO of the complex 6. The LUMO energy levels of the complexes 5 and 6 are calculated to be −3.227 and −3.164 eV, respectively. The LUMO energy level of 5 is lower than that of 6; therefore, it can be concluded that the strong electron-withdrawing group (F) stabilized the LUMO of the complex 5. The calculated HOMO–LUMO energy gaps (Eg) obtained from DFT calculations were 0.970 and 0.842 eV, respectively, for complexes 5 and 6. The complex 6 has the smaller energy gap and the longer wavelength of emission than that of complex 5.21,22 These data are consistent with the optical energy gaps, and the band gap trend is in good agreement with both the optical and electrochemical data (Table 3).
| Complex | E oxonset/V | HOMO/eV | LUMO/eV | E g/eV |
|---|---|---|---|---|
| 5 | 1.03 | −5.43 | −2.82 | 2.61 |
| 6 | 0.98 | −5.38 | −2.81 | 2.57 |
2.6. Electrochemical properties
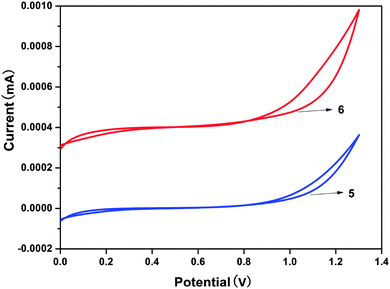
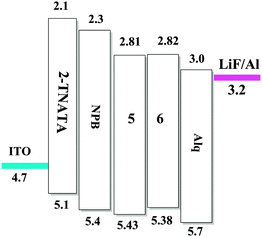
As an experimental approach, cyclic voltammetry (CV) can be an alternative method to estimate the HOMO–LUMO energy levels and energy band gaps, which are directly related to the emission wavelength of Zinc(II) complexes. In this work, the electrochemical behaviors of the Zinc(II) complexes (5, 6), in solutions of dichloromethane with 0.1 M tetrabutylammonium perchlorate as the electrolyte, were examined by cyclic voltammetry (CV) using a standard three-electrode system (Fig. 8). In Table 3 the onset oxidation peaks (Eox) for complexes 5 and 6 are 1.03 V and 0.98 V, respectively.23 The corresponding HOMO levels are 5.43 eV for the complex 5 and 5.38 eV for the complex 6. The LUMO levels for these complexes are deduced by combining the optical band gap and the HOMO levels and their values are 2.82 eV (5) and 2.81 eV (6). Evidently, because the values of the LUMO levels are close to the work function of LiF/Al, the lower energy barrier between the emitting layer and the cathode will facilitate electron injection into the emission layer. The calculated HOMO–LUMO energy gaps (Eg) obtained from CV were 2.61 and 2.57 eV, respectively, for complexes 5 and 6. In addition, it is noteworthy that the HOMO–LUMO energy gap is lower than that in Alq3 (3.27 eV), which indicates that complexes 5 and 6 have better potential electron-transport properties than the well-established electron transporter Alq3.To evaluate the electroluminescence (EL) performances of the complexes 5 (TFBQ) and 6 (DCBQ), we fabricated the devices with the construction of ITO/2-TNATA (20 nm)/NPB (30 nm)/complexes 5 and 6 (30 nm)/Alq (30 nm)/LiF (1 nm)/Al (100 nm), in which indium tin oxide (ITO) is used as the anode, 2-TNATA (N1-(naphthalen-2-yl)-N4,N4-bis(4-(naphthalen-2-yl(phenyl)amino)phenyl)-N1-phenylbenzene-1,4-diamine) as the hole-injecting layer, NPB (N,N′-di-1-naphthyl-N,N′-diphenylbenzidine) as the hole-transporting layer, Alq (8-hydroxyquinoline aluminum) as the electron-transporting and hole-blocking layer, and LiF used as the electron injecting layer.24 The device configuration and relative energy levels of the materials employed in the devices are shown in Fig. 9.
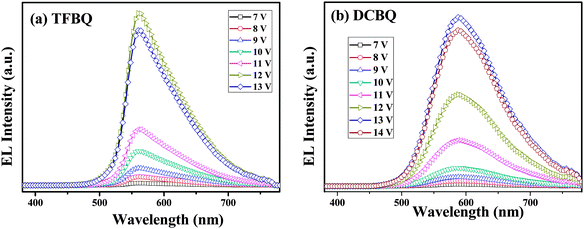
The normalized EL spectra of complexes 5 and 6 are shown in Fig. 10. Both complexes showed yellow electroluminescence with broad EL spectra ranging from 450 to 750 nm. By comparison with their PLs (575 and 607 nm), we can find that the EL spectra (560 and 588 nm) shows a slight blue-shift, which can be thought as the molecular aggregation in solid states. Molecular aggregation leads to shifts of the state energies; depending on the mutual orientation of the molecules forming a dimer, different transitions in the system can be forbidden or allowed. The optical properties are associated with H-aggregates and J-aggregates. In this regard, the shift can be attributed to the H-type molecular aggregates. A red shift of 28 nm was observed when the two Cl groups instead of the four F groups were introduced into the complex 6. This trend is in accordance with the electrochemical data and the DFT calculations.
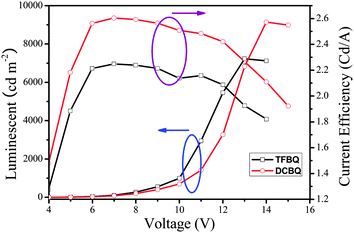
Fig. 11 shows the luminance and current density versus the applied voltage of the device. The forward bias current was obtained when the ITO was a positive electrode and the Al a negative electrode. The current and light output increased with increases in the forward bias voltage; the turn-on voltage of the devices was about 4 V. The devices exhibit good stability when they work at the operating voltage. The maximum luminance of the device based on 5 that could be achieved was about 7123 cd m−2 when the voltage reached 13 V, and the maximal luminance efficiency was 2.26 cd A−1, whereas the corresponding performance of the device based on 6 are 9143 cd m−2, 14 V, and 2.60 cd A−1, respectively. From the results, we can see that complex 6 is superior to complex 5 in luminance performance in fabricating multi-layer OLED. It is assumed that F here leads to a suppression of the charge transfers mechanism, which is the reason for the relatively low luminance efficiencies of 5.28–30 Detailed electroluminescent studies of these complexes and further research on optimum conditions for the OLED fabrication are underway in our laboratory.
3. Conclusion
We demonstrated two novel 8-hydroxyquinoline metallic complexes 5 and 6 containing an electron-withdrawing group (F, Cl) as yellow emitters. Their absorption, PL, fluorescence lifetime, fluorescence quantum yield and thermostability were studied. The substituents (F or Cl) on the 8-hydroxyquinoline were found to have a significant impact on the luminescent properties. The high thermal stabilities and strong fluorescence of complexes 5 and 6 mark them as potential candidates for organic light-emitting diode materials. Multilayer organic light-emitting diodes based on these complexes were fabricated with the structure of ITO/2-TNATA (20 nm)/NPB (30 nm)/Complexes 5 and 6 (30 nm)/Alq (30 nm)/LiF (1 nm)/Al (100 nm). The results show that both complexes display good performance with yellow emissions. The maximum luminance of complexes are 7123 cd m−2 for complex 5 and 9143 cd m−2 for complex 6, and the corresponding luminance efficiencies are 2.26 cd A−1 and 2.60 cd A−1, respectively.4. Experimental
4.1. Materials and instruments
All chemicals were obtained from commercial suppliers and used without further purification. Elemental analyses were performed using an EA1110 CHNS-0 CE elemental analyzer. All fluorescence measurements were carried out using a LS 50B Luminescence Spectrometer (Perkin Elmer, Inc. USA). All UV/Vis absorption spectra were recorded using a Lambda 20 UV-vis Spectrometer (Perkin Elmer, Inc. USA). 1H and 13C NMR experiments were carried out using a MERCURY plus 400 spectrometer operating at resonance frequency of 100.63 MHz. Thermogravimetry/Differential scanning calorimetry (TG/DSC) of the thermal analyses were conducted under a nitrogen atmosphere at a heating rate of 20 K min−1 with a Shimadzu TG/DSC 6300. Electrospray ionization mass spectra (ESI-MS) were recorded by a Finnigan LCQ mass spectrometer using dichloromethane/methanol as the mobile phase. All electron DFT calculations were performed using a DMol3 package in Materials Studio (version 5.5).25–274.2. Synthesis
4.3. Device fabrication
The ITO-coated glass substrate was first immersed sequentially in ultrasonic baths of acetone, alcohol and deionized water for 10 min, respectively, and then dried in an oven.31,32 The resistance of ITO sheet is 20 Ω □−1. The devices were fabricated in a multi-source organic molecule gas deposition system. There are different materials in every source, and the temperature of every source can be controlled independently. Different organic materials were deposited on the ITO-coated glass substrate, according to the designed structure, lithium fluoride (LiF) buffer layer and aluminum (Al) were deposited as a co-cathode under a pressure of 5 × 10⁻⁴ Pa. Electroluminescent spectra and Commission Internationale de l’éclairage (CIE) coordination of these devices were measured by a PR655 spectra scan spectrometer. The luminance-current–voltage characteristics were recorded simultaneously with the measurement of the EL spectra by combining the spectrometer through a Keithly model 2400 programmable voltage-current source. The layer thicknesses of the deposited materials were monitored in situ using a model FTM-V oscillating quartz thickness monitor made in Shanghai, China. All the measurements were carried out at room temperature and under ambient conditions.Acknowledgements
This work was supported by the National Natural Science Foundation of China (21172047; 51273209; 21372051; 21201002).Notes and references
- C. W. Tang and S. A. VanSlyke, Appl. Phys. Lett., 1987, 51, 913 CrossRef CAS PubMed.
- (a) R. H. Friend, R. W. Gymer, A. B. Holmes, J. H. Burroughes, R. N. Marks, C. Taliani, D. D. C. Bradley, D. A. Dos Santos, J. L. Bredas, M. Logdlund and W. R. Salaneck, Nature, 1999, 397, 121 CrossRef CAS PubMed; (b) G. M. Farinola and R. Ragni, Chem. Soc. Rev., 2011, 40, 3467 RSC; (c) M. Sudhakar, P. I. Djurovich, T. E. Hogen-Esch and M. E. Thompson, J. Am. Chem. Soc., 2003, 125, 7796 CrossRef CAS PubMed; (d) A. Bamesberger, C. Schwartz, Q. Song, W. W. Han, Z. Wang and H. Cao, New J. Chem., 2014, 38, 884 RSC.
- M. Ghedini, M. L. Deda, I. Aiello and A. Grisolia, Inorg. Chim. Acta, 2004, 33, 357 Search PubMed.
- M. M. El-Nahass, A. M. Farid and A. A. Atta, J. Alloys Compd., 2010, 507, 112 CrossRef CAS PubMed.
- X. H. Zhu, J. Peng, Y. Cao and J. Roncali, Chem. Soc. Rev., 2011, 40, 3509 RSC.
- R. Pohl, V. A. Montes, J. Shinar and P. Anzenbacher, J. Org. Chem., 2004, 69, 1723 CrossRef CAS PubMed.
- V. P. Barberis and J. A. Mikroyannidis, Synth. Met., 2006, 156, 865 CrossRef CAS PubMed.
- A. Sharma, D. Singh, J. K. Makrandi, M. N. Kamalasanan, R. Shrivastva and I. Singh, Mater. Lett., 2007, 10, 1016 Search PubMed.
- (a) H. E. Katz, A. J. Lovinger, J. Johnson, C. Kloc, T. Siegrist, W. Li, Y. Y. Lin and A. Dodabalapur, Nature, 2000, 404, 478 CrossRef CAS PubMed; (b) Y. Sakamoto, T. Suzuki, M. Kobayashi, Y. Gao, Y. Fukai, Y. Inoue, F. Sato and S. Tokito, J. Am. Chem. Soc., 2004, 126, 8138 CrossRef CAS PubMed; (c) M. M. Shi, H. Z. Chen, J. Z. Sun, J. Ye and M. Wang, Chem. Commun., 2003, 1710 RSC.
- A. Sharma, D. Singh, J. K. Makrandi, M. N. Kamalasanan, R. Shrivastva and I. Singh, Mater. Lett., 2007, 10, 4614 CrossRef PubMed.
- (a) G. Z. Yuan, Y. P. Huo, X. L. Nie, X. M. Fang and S. Z. Zhu, Dalton Trans., 2013, 42, 2921 RSC; (b) P. E. P. Michael, J. M. Barbe, H. D. Juneja and L. J. Paliwal, Eur. Polym. J., 2007, 43, 4995 CrossRef CAS PubMed.
- (a) S. B. Clara, T. G. Pedro, E. D. Roberto, L. M. Antonio and J. Maria, Inorg. Chem., 2009, 48, 11176 CrossRef PubMed; (b) H. L. Gao, S. X. Jiang, Y. M. Hu, F. F. Li, Q. Q. Zhang, X. Y. Shi and J. Z. Cui, Inorg. Chem. Commun., 2014, 44, 58 CrossRef CAS PubMed; (c) B. J. Gao, L. Fang, R. X. Zhang and J. Y. Men, Synth. Met., 2013, 165, 27 CrossRef CAS PubMed; (d) C. Y. Yue, F. L. Jiang, Y. Xu, D. Q. Yuan, L. Chen, C. F. Yan and M. C. Hong, Cryst. Growth Des., 2008, 8, 2721 CrossRef CAS.
- M. W. Perkovic, Inorg. Chem., 2000, 39, 4962 CrossRef CAS.
- (a) T. T. Wang, G. C. Zeng, H. P. Zeng, P. Y. Liu, R. X. Wang, Z. J. Zhang and Y. L. Xiong, Tetrahedron, 2009, 65, 6325 CrossRef CAS PubMed; (b) H. P. Zeng, G. R. Wang, G. C. Zeng and J. Li, Dyes Pigm., 2009, 83, 155 CrossRef CAS PubMed; (c) G. Z. Yuan, W. L. Shan, X. L. Qiao, L. Ma and Y. P. Huo, Chem. – Asian J., 2014, 9, 1913 CrossRef CAS PubMed.
- M. Nag and W. S. Jenks, J. Org. Chem., 2004, 69, 8177 CrossRef CAS PubMed.
- (a) K. Sumi, Y. Niko, K. Tokumaruza and G. I. Konishi, Chem. Commun., 2013, 49, 3893 RSC; (b) F. E. Lytle, D. R. Storey and M. E. Juricich, Spectrochim. Acta, Part A, 1973, 29, 1357 CrossRef CAS; (c) M. Nag and W. S. Jenks, J. Org. Chem., 2004, 69, 8177 CrossRef CAS PubMed.
- X. D. Yang, X. B. Chen, C. J. Mao, J. M. Song, H. L. Niu and S. Y. Zhang, J. Alloys Compd., 2014, 590, 465 CrossRef CAS PubMed.
- N. A. Benedek, I. K. Snook, K. Latham and I. Yarovsky, J. Chem. Phys., 2005, 122, 144102 CrossRef CAS PubMed.
- Y. Inada and H. Orita, J. Comput. Chem., 2008, 29, 225 CrossRef CAS PubMed.
- J. P. Perdew and Y. Wang, Phys. Rev. B: Condens. Matter Mater. Phys., 1992, 45, 13244 CrossRef.
- R. Pohl and P. Anzenbacher, Org. Lett., 2003, 16, 2769 CrossRef PubMed.
- X. H. Ouyang, D. C. Chen, S. M. Zeng, X. Y. Zheng, S. J. Su and Z. Y. Ge, J. Mater. Chem., 2012, 22, 23005 RSC.
- Q. Wang, J. Q. Ding, Z. Q. Zhang, D. G. Ma, Y. X. Cheng, L. X. Wang and F. S. Wang, J. Appl. Phys., 2009, 105, 076101 CrossRef PubMed.
- Q. Wang, J. Q. Ding, D. G. Ma, Y. X. Cheng, L. X. Wang and F. S. Wang, Adv. Mater., 2009, 21, 2397 CrossRef CAS.
- B. Delley, J. Chem. Phys., 1990, 92, 508 CrossRef CAS PubMed.
- B. Delley, J. Chem. Phys., 1996, 100, 6107 CrossRef CAS.
- B. Delley, J. Chem. Phys., 2000, 113, 7756 CrossRef CAS PubMed.
- H. X. Xu, B. S. Xu, X. H. Fang, Y. Yue, L. Q. Chen, H. Wang and Y. Y. Hao, Mater. Chem. Phys., 2011, 129, 840 CrossRef CAS PubMed.
- M. Y. Teng, S. Zhang, Y. M. Jin, T. Y. Li, X. Liu, Q. L. Xu, L. Chen, Y. X. Zheng, L. Y. Wang and J. L. Zuo, Dyes Pigm., 2014, 105, 105 CrossRef CAS PubMed.
- T. Fleetham, Z. X. Wang and J. Li, Org. Electrochem., 2012, 13, 1430 CrossRef CAS PubMed.
- Q. Wang, J. Q. Ding, D. G. Ma, Y. X. Cheng, L. X. Wang, X. B. Jing and F. S. Wang, Adv. Funct. Mater., 2009, 19, 84 CrossRef CAS.
- Q. Wang, L. W. H. Oswald, M. R. Perez, H. P. Jia, B. E. Gnade and M. A. Omary, Adv. Funct. Mater., 2013, 23, 5420 CrossRef CAS.
- G. M. Sheldrick, SADABS, program for empirical absorption correction of area detector data, University of Göttingen, Göttingen, Germany, 1996.
- G. M. Sheldrick, SHELXTL97, program for crystal structure refinement, University of Göttingen, Germany, 1997.
Footnote |
| † Electronic supplementary information (ESI) available. CCDC 937487. For ESI and crystallographic data in CIF or other electronic format see DOI: 10.1039/c4nj01085j |
| This journal is © The Royal Society of Chemistry and the Centre National de la Recherche Scientifique 2015 |


