DOI:
10.1039/C4NJ00876F
(Paper)
New J. Chem., 2015,
39, 529-538
Significant differences in the biological activity of mononuclear Cu(II) and Ni(II) complexes with the polyquinolinyl ligand†
Received
(in Victoria, Australia)
29th May 2014
, Accepted 29th October 2014
First published on 30th October 2014
Abstract
Two new mononuclear complexes [CuL(η2-SO4)] (1) and [NiL(η-SO4)(H2O)2]·3(H2O)·CH3CH2OH (2), where L is bis(2-quinolinyl methyl) benzyl-amine, have been synthesized and characterized by X-ray crystallography, ESI-MS and elemental analysis techniques. Complex 1 possesses a distorted square pyramidal geometry while complex 2 possesses distorted octahedral geometry. Interestingly, 2 dissolves in DMF–H2O mixed solvent, while 1 shows good water solubility. Both electronic absorption and EB displacement assay show that these complexes could bind to CT-DNA through partial intercalation. Though the DNA-binding abilities of 1 and 2 are similar, their chemical nuclease activities exhibit a great difference. Under physiological conditions, 1 could effectively convert pBR322 plasmid DNA from Form I to Form II at about 50 μM without any external agent, which shows self-oxidation cleavage activity; however, 2 shows poor DNA cleavage activity at 75 μM even in the presence of H2O2. At the same time, 1 also displays about 11-fold potential than 2 against HeLa cells with IC50 values 6.89 μM (1) and 74.85 μM (2). The IC50 value of 1 is even lower than the widely used drug cisplatin. The redox activity of Cu(II) and Ni(II) may play a main role in the biological activity of the two complexes, but the exact mechanism is still unclear. In addition, interactions of complexes with BSA have also been explored by fluorescence and UV-visible spectroscopic methods. The results indicated that complexes could quench the intrinsic fluorescence of BSA in a static quenching process.
Introduction
In 2008, about 7.6 million deaths (around 13% of all deaths) have been caused by cancer, while the number is projected to increase above 13.1 million in 2030.1 As a result, considerable attempts have been made to explore metal-based complexes for cancer therapy.2–4 Among them, many transition metal complexes attract great attention owing to their possible applications as new cancer therapeutic agents.5–8 Copper and Nickel, the bioessential transition metals, and their respective complexes have been investigated on the assumption that endogenous metals may be less toxic for normal cells with respect to cancer cells. Recently, Santini9 and his coworkers reported the development of copper-based complexes as anticancer drugs. Ji10 have reported several Cu(II) complexes by introduction of aryl-modified 2,6-di(thiazol-2-yl) pyridine; notably all the complexes show excellent cytotoxic activities on the BEL-7402 and HepG2 cells. Moreover, a mononuclear Cu(II) complex [Cu(ttpy)(Gly)(NO3)]·(NO3)·H2O (ttpy = 4′-p-tolyl-2,2′:6,2′′-terpyridine) shows a remarkable cleavage activity in the presence of Vc, which has been reported by Guo.11 At the same time, many nickel complexes have also been investigated due to their good DNA binding and cleavage activity.6,12,13 However, compared with Ni(II), Cu(II) is a redox active metal ion, whose reduction to Cu(I) is much more easier than the reduction or oxidation of Ni(II). As a result, some differences in the biological activities usually exist between Cu(II) and Ni(II) complexes. For example, with the same ligand, the mononuclear Cu(II)-bpy(2,2′-bipyridine) complex exhibits higher activity in cleaving BNPP at pH = 7 and pH = 8.6 than Ni(II)-bpy complex,14 while the Ni(II) complex displays better DNA binding ability than Cu(II) complex by incorporation of the ligand N,N′-bis-5-(triethylammonium methyl)-salicy-lidene-2,3-naphthalendiiminato.6 It will be interesting to investigate interactions between DNA and Cu(II), Ni(II) complexes with same ligand.
The square-pyramidal Cu(II) complex with the neutral, non-deprotonated chelating ligand bis(2-pyridylmethyl) amine (dpa) has been investigated due to its ability to act as an effective DNA scissor and anticancer agent.15 The derivative of dpa, N-benzyl di(pyridylmethyl)amine (phdpa), was used to synthesize several Cu(II) complexes, which also show good anticancer properties and could cause the fragmentation of the nucleus.16 Complexes with the dpa ligand, with which substituents may be introduced into the imino nitrogen atom, have been investigated by many groups due to their ability to effectively break the DNA duplex.17–19 Compared with pyridine, the quinoline ring shows better planarity and stronger hydrophobic DNA interaction, which may show better DNA binding ability. Moreover, the quinoline skeleton, isolated from Camptotheca acuminate, shows important biological activities.20,21 Therefore, substitution of pyridine with quinoline in dpa may provide a new insight into developing new metallodrugs. However, so far few studies have reported the potential anticancer activity of complexes with quinoline derivatives of dpa.
On the other hand, protein forms the basis of material in virtually all living organisms. In addition, serum albumin plays an important role in drug delivery, with a capacity to reversibly bind a large variety of drugs, which results in its prevailing role in drug pharmacokinetics and pharmacodynamics.22 BSA, bovine serum albumin, has been investigated extensively for its structural homology with human serum albumin (HSA).23,24 Therefore, it is greatly valuable to explore the interaction between BSA and compounds.
All the above facts have stimulated our interest in the present work on synthesizing two mononuclear complexes [CuL(η2-SO4)] (1) and [NiL(η-SO4)(H2O)2]·3(H2O)·CH3CH2OH (2), with L (bis(2-quinolinyl methyl) benzyl-amine). Though several complexes25,26 have been synthesized with L, few attempts have been made to explore the biological properties. In this work, we have investigated and explored some biological activities of two complexes. Notably, the two complexes display several significant differences: (i) 1 shows better water solubility than 2; (ii) 1 exhibits good self-oxidation DNA cleavage ability, while 2 shows poor DNA cleavage activity even in the presence of activators; (iii) 1 also displays about 11-fold potential than 2 against HeLa cells. Furthermore, the affinity of complex to BSA was also investigated via various spectroscopic methods (fluorescence quenching and UV-visible). The great difference between two complexes, especially in the DNA cleavage activity, may be due to the redox activity of center metals, Cu(II) is more effective in the formation of ROS species than Ni(II). We hope all the results may contribute to further studies for how compounds act in biological systems.
Experimental
Materials and measurements
All reagents and chemicals were purchased from commercial sources and used as received. Agarose, pBR322 plasmid DNA, ethidium bromide (EB), bovine serum albumin (BSA) and calf thymus CT-DNA were obtained from Sigma. Stock solutions of 1 (1.0 × 10⁻³ M in H2O) and 2 (1.0 × 10⁻³ M in 20%DMF–H2O mixed solvent) were stored at 4 °C and prepared to required concentrations for all experiments. Ultra-pure MilliQ water (18.24 MΩ cm) was used in all experiments. Tris-HCl and phosphate buffer solution were prepared using ultrapure water. Elemental analysis of C, H and N was carried out on a Perkin-Elmer analyzer model 240. Infrared spectroscopy using KBr pellets was performed on a Bruker Vector 22 FT-IR spectrophotometer in the 4000–400 cm−1 regions. Thermogravimetric analysis was performed on a NETZSCH TG 209 in the region 25–800 °C at 10 K min−1. Electrospray ionization mass spectrometry (ESI-MS) was obtained on an Agilent 6520 Q-TOF LC/MS. Electronic spectra were recorded on a JASCO V-570 spectrophotometer. Fluorescence spectral data were obtained on a MPF-4 fluorescence spectrophotometer at room temperature. The performance of the Gel Imaging and documentation DigiDoc-It System was assessed using Labworks Imaging and Analysis Software (UVI, UK).
Synthesis of ligand L and its corresponding complexes
Preparation of the ligand.
The L (Scheme 1) was prepared according to a procedure described in the literature26 with some improvements. A mixture of 2-chloromethylquinoline hydrochloride (1.82 g, 8.4 mmol), benzylamine (0.45 g, 4.2 mmol) and potassium carbonate (3.50 g, 26.0 mmol) in acetonitrile (30 mL) was refluxed for 48 hours. After solvent was removed under reduced pressure, the residue was separated by chloroform/water and the organic phase was dried, evaporated, and pale yellow powder was obtained. Selected IR data (KBr, ν, cm−1): 1638(s), 1617(s), 1117(m), 824(m), 620(s).
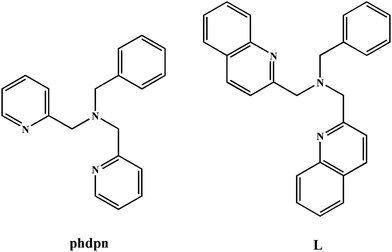 |
| | Scheme 1 Schematic structures of phdpn(left) and L(right). | |
Synthesis of [CuL(η2-SO4)] (1)
To an ethanol solution (10 mL) of L (0.04 g, 0.1 mmol), an aqueous solution (5 mL) of CuSO4·5H2O (0.03 g, 0.1 mmol) was added. The resulting mixture was stirred for 3 h at room temperature. Blue prism crystals suitable for X-ray diffraction were obtained by slow evaporation of the filtrate after seven days, which was collected by filtration, washed with diethyl ether and dried in air, yield 0.02 g (38%). Elemental analysis (%): calcd for C27H23N3O4SCu: C, 59.06; H, 4.22; N, 7.65. Found: C, 58.08; H, 4.32; N, 7.34. Selected IR data (KBr, ν, cm−1): 1638(s), 1618(s), 1222(m), 1136(s), 826(m), 623(s). ESI-MS (m/z = 497.11, [CuL(CH3CH2OH)-H]+).
Synthesis of [NiL(η-SO4)(H2O)2]·3(H2O)·CH3CH2OH (2)
Complex 2 was prepared by a procedure similar to that given in the case of 1, using NiSO4·6H2O (0.03 g, 0.1 mmol) in place of CuSO4·5H2O to the reaction mixture. Green block crystals suitable for X-ray diffraction were obtained by slow evaporation of the filtrate after ten days, which were collected by filtration, washed with diethyl ether and dried in air, yield 0.03 g (43%). Elemental analysis (%): calc. for C29H39N3O10SNi: C, 51.19; H, 5.78; N, 6.18. Found: C, 50.28, H, 5.64; N, 6.35. Selected IR data (KBr, ν, cm−1): 1638(s), 1618(s), 1179(m), 621(s). ESI-MS (m/z = 492.12, [NiL(CH3CH2OH)-H]+).
X-ray crystallographic studies
Single-crystal X-ray diffraction data of compounds were collected on a Bruker Smart 1000 CCD diffractometer using Mo-Kα radiation (λ = 0.71073 Å) with the ω scan technique. The structures were solved by direct methods (SHELXS-97 and refined with the full-matrix least-squares technique on F2 using the SHELXL-97.27,28 The hydrogen atoms were added theoretically, and riding on the concerned atoms and refined with fixed thermal factors. For 2, the PLANTON SQUEEZE procedure29 was applied to treat the highly distorted solvent H2O molecules in the crystal structure. The application of SQUEEZE gave a good improvement in the data statistics and allowed for a full anisotropic refinement of both structure models. TG analysis has been carried out to prove the possible water molecules in the outside. The result suggests that three water molecules and one ethanol molecule exist (Fig. S1, ESI†). The details of crystallographic data and structure refinement parameters are summarized in Table 1, and selected bond angles and distances are listed in Table 2.
Table 1 Crystal data and structural refinement of complexes 1 and 2
| Compound reference |
1
|
2
|
| Chemical formula |
C27H23CuN3O4S |
C29H33N3NiO10S |
| Formula mass |
549.08 |
679.17 |
|
T/K |
293(2) |
113(2) |
| Crystal system |
Monoclinic |
Monoclinic |
| Space group |
C2/c |
P2(1)/n |
|
a/Å |
26.919(5) |
14.772(3) |
|
b/Å |
8.7230(17) |
13.805(3) |
|
c/Å |
22.424(5) |
14.786(3) |
|
α/° |
90.00 |
90.00 |
|
β/° |
107.99(3) |
96.14(3) |
|
γ/° |
90.00 |
90.00 |
|
V/Å3 |
5008.2(17) |
2992.4(11) |
| No. of formula units per unit cell, Z |
8 |
4 |
| D/g/cm3 |
1.456 |
1.390 |
|
μ/mm−1 |
0.994 |
0.768 |
| No. of reflections measured |
16212 |
29820 |
| No. of independent reflections |
4419 |
5253 |
|
R
int
|
0.0919 |
0.0728 |
| Final R1 values (I > 2σ(I)) |
0.0567 |
0.0448 |
| Final wR(F2) values (I > 2σ(I)) |
0.1150 |
0.1036 |
| Final R1 values (all data) |
0.0869 |
0.0496 |
| Final wR(F2) values (all data) |
0.1274 |
0.1066 |
Table 2 Selected bond lengths [Å] and angles [°] of complexes 1 and 2
|
1
|
2
|
| Cu(1)–O(1) |
1.976(3) |
Ni(1)–O(1) |
2.064(3) |
| Cu(1)–O(2) |
2.008(3) |
Ni(1)–O(2) |
2.065(3) |
| Cu(1)–N(2) |
2.017(4) |
Ni(1)–N(1) |
2.104(3) |
| Cu(1)–N(3) |
2.040(3) |
Ni(1)–O(3) |
2.110(3) |
| Cu(1)–N(1) |
2.251(4) |
Ni(1)–N(3) |
2.116(3) |
| O(1)–Cu(1)–O(2) |
71.49(11) |
Ni(1)–N(2) |
2.122(3) |
| O(1)–Cu(1)–N(2) |
165.09(12) |
O(1)–Ni(1)–O(2) |
90.91(11) |
| O(2)–Cu(1)–N(2) |
95.87(13) |
O(1)–Ni(1)–N(1) |
173.31(12) |
| O(1)–Cu(1)–N(3) |
104.17(13) |
O(2)–Ni(1)–N(1) |
93.83(12) |
| O(2)–Cu(1)–N(3) |
162.58(13) |
O(1)–Ni(1)–O(3) |
89.64(12) |
| N(2)–Cu(1)–N(3) |
85.52(14) |
O(2)–Ni(1)–O(3) |
85.17(12) |
| O(1)–Cu(1)–N(1) |
108.79(13) |
N(1)–Ni(1)–O(3) |
86.07(11) |
| O(2)–Cu(1)–N(1) |
93.70(12) |
O(1)–Ni(1)–N(3) |
96.47(12) |
| N(2)–Cu(1)–N(1) |
79.20(14) |
O(2)–Ni(1)–N(3) |
169.74(12) |
| N(3)–Cu(1)–N(1) |
103.60(13) |
N(1)–Ni(1)–N(3) |
78.25(12) |
|
|
|
O(3)–Ni(1)–N(3) |
87.76(12) |
|
|
|
O(1)–Ni(1)–N(2) |
88.17(13) |
|
|
|
O(2)–Ni(1)–N(2) |
105.39(13) |
|
|
|
N(1)–Ni(1)–N(2) |
95.10(12) |
|
|
|
O(3)–Ni(1)–N(2) |
169.24(12) |
|
|
|
N(3)–Ni(1)–N(2) |
82.03(12) |
DNA binding and cleavage activity studies
The UV absorbance at 260 nm and 280 nm of the CT-DNA solution in 5 mM Tris–50 mM NaCl buffer (pH 7.2) gives a ratio of 1.8–1.9, indicating that CT-DNA was sufficiently free of protein.30 The concentration of CT-DNA was determined from its absorption intensity at 260 nm with a molar extinction coefficient of 6600 M−1 cm−1. The absorption spectra of the complex bound to DNA were recorded by increasing the amounts of CT-DNA added to complex in Tris-HCl buffer.
The relative binding abilities of complex to CT-DNA were studied using an EB-bound CT-DNA system in 5 mM Tris–50 mM NaCl buffer (pH 7.2). The experiment was carried out by titrating a certain volume of a stock complex into EB–DNA solution containing 2.4 × 10⁻⁶ M EB and 48 × 10−6 M CT-DNA. Then fluorescence spectra were recorded at room temperature with excitation at 510 nm and emission at about 602 nm after the system was allowed to equilibrate for 5 min.
The DNA cleavage experiment was carried out by agarose gel electrophoresis followed by incubation at 37 °C. pBR322 DNA (0.1 μg/μL) in 50 mM Tris-HCl/18 mM NaCl buffer (pH = 7.2) was treated with complexes 1 and 2. Different concentrations of complex were added to DNA stock. Then, samples were incubated for 3 h, and the loading buffer was added. Finally, samples were electrophoresed for 2 h in 0.9% agarose gel using Tris-boric acid-EDTA buffer. After electrophoresis, bands were visualized by UV light and photographed.
The cleavage mechanism of pBR322 DNA was investigated in the presence of some radical scavengers and reaction inhibitors. The reactions were conducted by adding standard radical scavengers of KI, NaN3, SOD, EDTA and the groove binding agent Methyl Green (for major groove), SYBR Green (for minor groove) to pBR322 DNA after the addition of the complex. The cleavage experiment was initiated by addition of complex and quenched with 2 μL of loading buffer. Further analysis was carried out by the above standard method.
Protein binding studies
Fluorescence quenching experiments have been carried out to investigate the interaction between BSA and complexes 1 and 2, by using bovine serum albumin stock solution (BSA, 1.5 mM) in 10 mM phosphate buffer (pH = 7.0). The fluorescence spectra were recorded at room temperature with an excitation wavelength of BSA at 280 nm and the emission at 342 nm by keeping the concentration of BSA constant (29.4 μM) while varying complex concentration from 0 to 40 μM for 1 and 2.
In vitro cell assay
The cytotoxicity of 1 and 2 against cervical carcinoma cells (HeLa) was evaluated by a CCK-8 kit assay. HeLa cells were cultured in a DMEM/F12 medium supplemented with 10% fetal bovine serum (5% CO2 at 37 °C). Cells were seeded in 96-well plates at a density of 104 cell per well and incubated for 48 h to allow cell attachment. Then, cells were washed with PBS, and medium was replaced with a fresh medium containing the indicated concentrations of either 1 or 2. Cells without pretreatment were used as the control. After a period of incubation, cells were washed with PBS and incubated in DMEM/F12 with 10% WST-8 solution for another 2 h. The absorbance of each well was measured at a wavelength of 450 nm using a plate reader. The results were expressed as the mean values of three measurements. The cell viability was calculated as follows:
where Isample, Icontrol, and Iblank represent the absorbance intensity at 450 nm determined for cells treated with different samples, for control cells (nontreated), and for blank wells without cells (the same amounts of CCK-8 solution and sample solution as the sample wells were added to the blank wells), respectively.
Results and discussion
Two new mononuclear complexes 1 and 2 have been synthesized by using one reported ligand L. The crystals for complexes suitable for X-ray analysis were collected after about one week. The polyquinolinyl based complexes show good DNA binding ability due to large planar ligands, the Cu(II) complex even demonstrates good self-activation DNA cleavage activity and anticancer activity.
Description of the crystal structure
The complex has been structurally characterized by X-ray crystallography (Fig. 1), the details of data collection conditions and parameters of the refinement process are given in Table 1, and selected bond lengths and angles are given in Table 2, respectively.
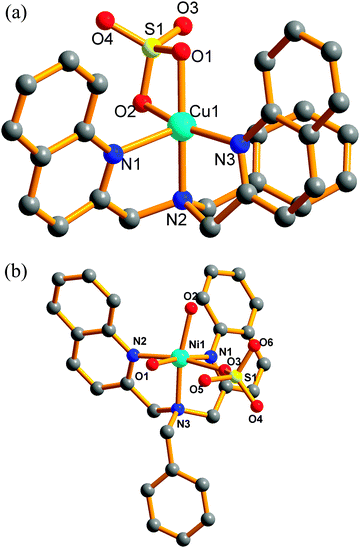 |
| | Fig. 1 Molecular structures of (a) complex 1, (b) complex 2; hydrogen atoms and solvent molecules have been omitted for clarity. | |
Complexes 1 and 2 are mononuclear compounds but show different crystal structures. Complex 1 crystallized in a monoclinic cell with the C2/c space group. The Cu2+ center shows pentacoordinated geometry with a N3O2 donor unit derived from one tertiary amine N, two quinoline N atoms and two O atoms from SO42−. The τ value of Cu is 0.04, which display a slightly distorted square pyramidal geometry. The base square position was occupied by O(1) and O(2) from SO42−(Cu(1)–O(1) 1.976(3) Å, Cu(1)–O(2) 2.008(3) Å), N(2) and N(3) from L (Cu(1)–N(2) 2.017(4) Å, Cu(1)–N(3) 2.040(3) Å). The bond distances fall in the range of several reported Cu(II) complexes.31,32 The N(1) atom from another quinoline ring of L (Cu(1)–N(1) 2.251(4) Å) occupies the apical site. The axial Cu(1)–N(1) bond distance is longer than the equatorial Cu(1)–N(3) bond, which may be due to the dx2–y2 orbital in a Cu2+ square pyramidal geometry containing two electrons while the dz2 orbital containing only one electron.32
The Ni2+ center exhibits hexacoordinated geometry in complex 2, which is different from 1. The N3O3 donor set is constituted by one tertiary amine N, two quinolyl-N atoms and one O atom from SO42−, two O atoms from two distinct H2O molecules, which gives a distorted octahedral environment. The basal plane is formed by N(1)N(3)O(1)O(2) (Ni(1)–N(1) 2.104(3) Å, Ni(1)–N(3) 2.116(3) Å, Ni(1)–O(1) 2.064(3) Å, Ni(1)–O(2) 2.065(3) Å), the apical position is occupied by the O(3) (Ni(1)–O(3) 2.110(3) Å) and N(2)(Ni(1)–N(2) 2.122(3) Å). The bond distances fall in the range of several Ni2+ complexes.33 The bond distance of Ni(1)–O(1) and Ni(1)–O(2) is almost the same, which is shorter than Ni(1)–O(3) (2.110(3) Å) which may be the smaller steric hindrance for the H2O molecule than SO42−. Hydrogen bonds were formed by the coordinated H2O, SO42− and solvent ethanol molecule. The geometrical parameters for hydrogen bonds are reported in Table 3. Related bond distances and θ angles of the O–H⋯O type all fall in the range of some reported complexes.34 The hydrogen bonds are all of the O–H⋯O type with θ angles considerably shorter than 180° (Fig. 2).
Table 3 Hydrogen bonds [Å and °] of complex 2
| D–H⋯A |
d(D–H) |
d(H⋯A) |
d(D⋯A) |
θ(<DHA) |
| O1–H1B⋯O5 |
0.717 |
1.973 |
2.669 |
163.89 |
| O2–H2B⋯O7 |
0.817 |
1.954 |
2.762 |
170.14 |
| O7–H7A⋯O6 |
0.820 |
1.944 |
2.762 |
174.63 |
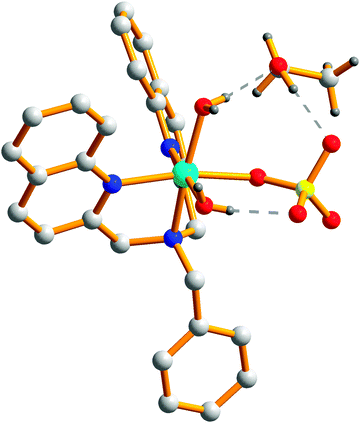 |
| | Fig. 2 Depiction of the hydrogen bond interactions in 2. | |
DNA-binding and cleavage activities
DNA-binding studies
Electronic absorption studies.
Electronic absorption spectroscopy was an effective method in examining the binding mode of DNA with complex. The potential binding ability of complexes 1 and 2 with CT-DNA was characterized by measuring their effects on UV absorption. The typical titration curve of complexes 1 and 2 is shown in Fig. 3. It is clear that 1 has two strong absorptions at ca. 204 nm and 233 nm, and a weak absorption at ca. 305 nm. However, DMF in a solution of complex 2 shows a strong influence at ca. 200–250 nm because of strong absorption. So here we investigated the absorption at ca. 305 nm for complex 2. The insets in Fig. 3 are the typical titration curves and plots of (εa − εf)/(εb − εf) versus [DNA] for titration of CT-DNA against the complex. Upon incremental addition of CT-DNA to 1 and 2, a decrease in molar absorptivity (hypochromism, 20.7% and 11.1%) of the two complexes is observed. Such a marked change in the intensity of spectral bands is expected an intimate association of the complex with CT-DNA. In order to determine the binding strength of complexes with CT-DNA, intrinsic binding constants Kb were calculated from a nonlinear fitting according to the equation,35| | | (εa − εf)/(εb − εf) = (b − (b2 − 2Kb2Ct[DNA]/s)1/2)/2KbCt | (1a) |
| | | b = 1 + KbCt + Kb[DNA]/2s | (1b) |
The DNA binding constant (Kb) values of complexes, along with the binding site sizes (s), are given in Table 4. The Kb values of complexes are similar to 1 (3.56 × 10⁵ M−1) and 2 (3.19 × 10⁵ M−1), which may be due to their similar structures in solution. From Table 4, the Kb values of our compounds are stronger than [Cu(L6)Cl2] (L6 = 2-(1H-benzimidazol-2-yl)ethyl-(4,4a-dihydroquinolin-2-ylmethy-lene)amine), which may be due to the hydrophobic interaction of phenyl and quinolyl moieties32 in our ligand. The DNA affinity of 2 is also stronger compared to several mononuclear Ni(II) complexes.12,36 The binding site size (s) values obtained from the fit (s = 0.81 for 1, s = 0.42 for 2), which show a measure of the number of DNA bases associated with the complex. The low s values (s < 1) were attributed to the aggregation of hydrophobic molecules on the DNA surface.37 According to the electronic absorption studies, it has been found that complexes maybe bind to DNA by partial intercalation; however, some more experiments should be carried out for further proving the binding mode.
Table 4 Absorption spectral properties and Fluorescence spectral properties of complexes 1 and 2 bound to CT-DNA
| Complex |
K
b (M−1) |
K
app (M−1) |
Ref. |
|
1
|
3.56 × 10⁵ |
1.23 × 10⁶ |
This work |
|
2
|
3.19 × 10⁵ |
1.21 × 10⁶ |
This work |
| [(phdpa)Cu(bpy)(ClO4)] |
|
3.69 × 10⁴ |
16
|
| [(phdpa)Cu(phen)(H2O)] |
|
8.20 × 10⁴ |
16
|
| [Cu(L3)Cl2] |
|
3.40 × 10⁴ |
32
|
| [Cu(L6)Cl2] |
6.60 × 10³ |
7.60 × 10⁴ |
32
|
| [Ni(dicl)2(bipy)] |
2.21 × 10⁵ |
|
12
|
| [Ni(Phterpy)2] |
7.64 × 10³ |
1.43 × 10⁵ |
36
|
| Phdpa: N-benzyl di(pyridylmethyl)amine |
| L3: (2-pyridin-2-yl-ethyl)pyridin-2-ylmethyleneamine |
| L6: 2-(1H-benzimidazol-2-yl)ethyl-(4,4a-dihydroquinolin-2-ylmethy-lene)amine |
| Dicl: sodium diclofenac |
| Phterpy: 4′-phenyl-2,2′:6′,2′′-terpyridine |
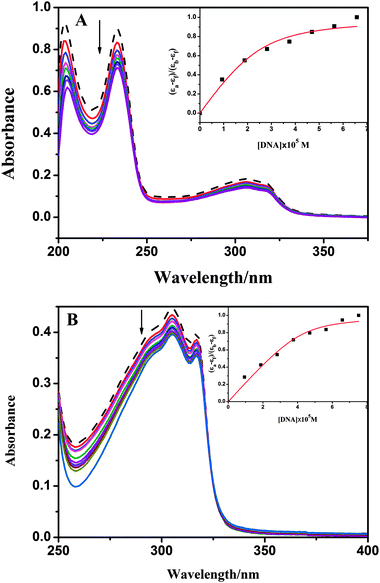 |
| | Fig. 3 Absorption spectra of complexes in the absence (dashed line) and presence (solid lines) of increasing amounts of CT-DNA (9.4–65.8 μM for 1, 9.4–75.2 μM for 2) in 5 mM Tris-HCl/50 mM NaCl buffer (pH = 7.2). A for 1 (15 μM) and B for 2 (50 μM)), the arrow shows the absorbance changes upon increasing DNA concentration. The inset shows the least-squares fit of (εa − εf)/(εb − εf) vs. [DNA] for complexes. | |
Fluorescence spectral studies.
The DNA binding behavior of complexes 1 and 2 was further investigated by fluorescence spectral titration method. The EB–DNA system generally shows a significant increase in the fluorescence emission when EB binds to DNA, and a decrease is observed when EB is displaced by another DNA intercalate molecule.38,39 From Fig. 4 and Fig. S2 (ESI†), as the titration of complexes 1 and 2, a dramatic hypochromism effect appeared at 603 nm, which suggests that EB may be replaced from the system and the binding may involve some intercalative interaction. Quenching data is in agreement with the classical linear Stern–Volmer equation,40I0/I = 1 + Ksv[Q], where I0 and I represent the fluorescence intensities in the absence and presence of a quencher and [Q] is the quencher concentration. In the linear fit plot of I0/I versus [Q], Ksv is the Stern–Volmer dynamic quenching constant. The apparent DNA binding constant (Kapp), which could express the degree of affinity toward DNA, was calculated on the basis of the equation,
| KEB [EB] = Kapp [complex] |
Here KEB = 1.0 × 10⁷ M−1, ([EB] = 2.4 μM). KEB is the binding constant of EB to DNA, and [complex] is the value concentration of the complex at 50% reduction of fluorescence intensity of EB. The Ksv and Kapp values for complexes 1 and 2 were listed in Table 4. Approximate Kapp values of 1 (1.23 × 10⁶ M−1) and 2 (1.21 × 10⁶ M−1) verify further the rationality of Kb values in the UV-visible method. Upon replacement of the pyridyl moiety in [(phdpa)Cu(bpy)(ClO4)] (3.69 × 10⁴ M−1) and [(phdpa)Cu(phen)(H2O)] (8.20 × 10⁴ M−1)16 by quinolyl in 1 and 2, the DNA binding affinities of complexes increase significantly, which is supported by the stronger hydrophobic DNA interaction and larger aromaticity of the quinolyl moiety than the pyridyl moiety.
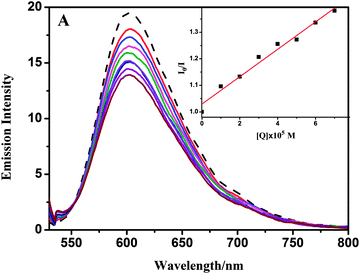 |
| | Fig. 4 Emission spectra of EB bound to CT-DNA in the absence (dashed line) and presence (solid lines) of complex 1 (0–70 μM) in 5 mM Tris–50 mM NaCl buffer (pH 7.2). Inset: the plot of I0/I versus the complex concentration. | |
DNA cleavage activity
Cleavage of pBR322 DNA by complexes.
The DNA cleavage experiment of complexes 1 and 2 was investigated using supercoiled pBR322 plasmid DNA by electrophoresis in a medium of 50 mM Tris-HCl/18 mM NaCl buffer (pH = 7.2). Fig. 5(a) shows the electrophoresis results of DNA cleavage induced by increasing concentrations of 1 without addition of any external redox agent. When the concentration is lower than 20 μM, DNA cleavage ability is poor, but when it is above 35 μM, DNA breakage activity of 1 increase significantly. Complex 1 almost completely converts the supercoiled form (Form I) to its open circular form (Form II) at 50 μM concentration. However, under the same conditions (Fig. 5(b)), complex 2 shows almost no effect on the cleavage of DNA even at 65 μM. In order to investigate whether the external redox agent could affect the efficient DNA cleavage activity of 2, activator H2O2 was added to the reaction. However, in the presence of H2O2, complex 2 still shows lower activity than 1, only converting about 50% Form I to Form II at the highest concentration assayed (75 μM) (Fig. S2, ESI†). These results demonstrate that both complexes show DNA cleavage activity, but complex 1 shows higher activity than 2 (Fig. 5(c)), which suggests that the metal ions may play an important role in DNA cleavage. For two metal ions in our complex, Cu(II) is more effective in reducing Cu(II) to Cu(I) than in reducing or oxidizing Ni(II), which may result in the difference in DNA cleavage activity.
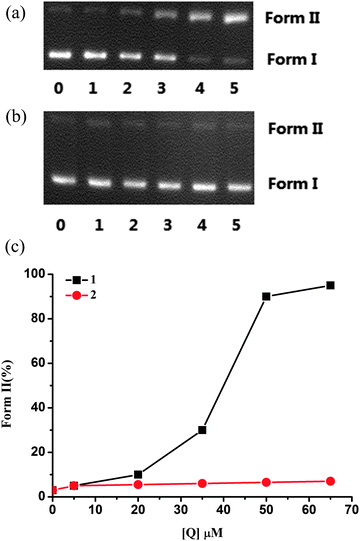 |
| | Fig. 5 Cleavage of plasmid pBR322 DNA (0.1 μg/μL) at different concentrations of complexes after 3 h incubation at 37 °C ((a) for 1, (b) for 2); Line 0: DNA control, Line 1–5: DNA+ complex (5, 20, 35, 50, 65 μM); (c) the percentage of Form II versus concentrations of 1 (■) and 2 (●). | |
DNA cleavage mechanism.
The activity of DNA-cleaving complexes without an oxidant or a reducing agent is often related to a hydrolytic rather than an oxidative mechanism. However, without a co-reagent, there are still many complexes that act by an oxidative mechanism.41–45 As a result, the possible ROS responsible for DNA cleavage were investigated using common agents like KI and DMSO as hydroxyl radical scavengers; L-Histidine and NaN3 as singlet oxygen (1O2) quenchers; and superoxide dismutase (SOD) as an O2− radical scavenger. The experiment was also carried out in the presence of a major groove binding agent, methyl green; a minor groove binder, SYBR green; and the metal ion chelating agent, EDTA.
From Fig. 6, the cleavage activity of complexes 1 and 2 is reduced dramatically in the presence of KI and EDTA, indicating that ˙OH radicals and the metal ions may play the key role in the cleavage process. For complex 1, addition of L-His also prevents the cleavage, indicating that singlet oxygen is also involved in the cleavage mechanism.11 Methyl green efficiently inhibits the process, which implies that complex 1 may bind to DNA in the major groove. However, for 2, the binding position may be in the minor groove. In conclusion, ˙OH radicals are the crucial ROS responsible for the cleavage activity of two complexes; singlet oxygen is less influential in the cleavage for 1; metal ions also play an important role in the process; however, the exact mechanism is still unknown.
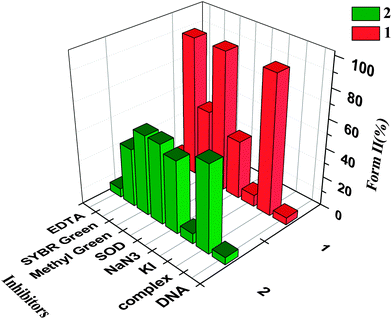 |
| | Fig. 6 Bar diagram shows the cleavage of DNA by complexes 1 (50 μM), and 2 (50 μM + 0.25 mM H2O2) in the presence of different inhibitors. | |
Protein binding activities
Fluorescence quenching of BSA by complexes.
Investigation of the binding between drug with protein will facilitate interpretation of metabolism and transporting process of a drug, and explain the relationship between structures and functions of a protein. Bovine serum albumin (BSA) was utilized extensively as a result of its structural homology with human serum albumin (HSA). Qualitative analysis of the binding of chemical compounds to BSA is usually detected by inspecting the fluorescence spectra. The interaction of complexes 1 and 2 with BSA has been studied from the concentration dependence of the change in the fluorescence intensity of protein upon the addition of complexes. Fluorescence spectra were recorded in the range of 290–450 nm upon excitation at 280 nm. The effect of the fluorescence intensity of BSA on complex 1 is shown in Fig. 7 (Fig. S6 for 2, ESI†).
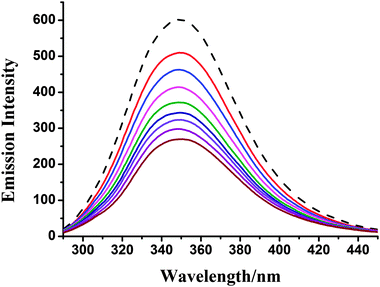 |
| | Fig. 7 Fluorescence emission spectra of the BSA (29.4 μM) system in the absence (dashed line) and presence (solid lines) of complex 1 (0–40 μM). | |
Upon addition of 1 and 2 to the solution of BSA, a significant decrease of fluorescence intensity has been observed. Fluorescence intensity of BSA at 350 nm was decreased to about 55.3% (complex 1) and 54.8% (complex 2) from the initial fluorescence intensity of BSA, which suggested a definite interaction of compounds with BSA protein.46 To study the quenching process, fluorescence quenching data were analyzed using the Stern–Volmer equation. The quenching constant Ksv could be calculated using the Stern–Volmer equation: I0/I = 1 + Ksv[Q], where I0 and I are the fluorescence intensities of the fluorophore in the absence and presence of a quencher, respectively, and Ksv is observed by using the plot of I0/I versus [Q] (Fig. 8). Moreover, based on the Scachard equation,
log[(I0 − I)/I] = log![[thin space (1/6-em)]](https://www.rsc.org/images/entities/char_2009.gif) K + nlog[Q] K + nlog[Q] |
where
K is the binding constant of the compound with DNA and
n is the number of binding sites. The number of binding sites (
n) and the binding constant (
K) have been obtained from the plot of log (
I0 −
I)/
I versus log[
Q]. The calculated
Ksv,
K, and
n values are given in
Table 5. The value of
n is around 1, which indicated the existence of just one single binding site in BSA for the complex.
47 The
K values of complexes are smaller than several reported mononuclear complexes.
47,48
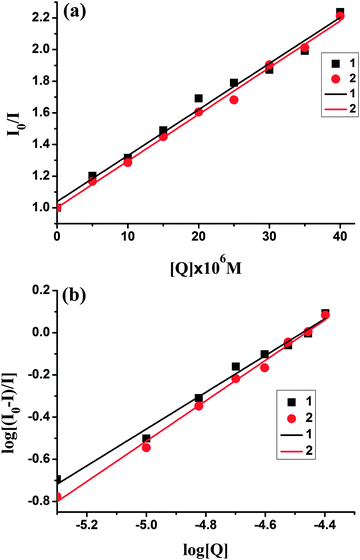 |
| | Fig. 8 The plot of I0/I versus the concentration of complexes 1 and 2; (b) plot of log(I0 − I)/I vs. log [Q] for BSA in the presence of complexes 1 and 2 (1 (■), 2 (●)). | |
Table 5 The quenching constants, binding constants and the number of binding sites for the interaction of complexes 1 and 2 with BSA
| Complex |
K
sv (M−1) |
K
q (M−1 s−1) |
K (M−1) |
n
|
|
1
|
2.91 × 10⁴ |
2.91 × 10¹² |
7.9 × 10³ |
0.87 |
|
2
|
2.97 × 10⁴ |
2.97 × 10¹² |
1.82 × 10⁴ |
0.96 |
UV-vis absorption spectroscopy
UV-vis absorption spectroscopy is a simple method to explore the quenching mechanism of BSA by the interaction with complexes. If the fluorophore and quencher come into contact during the transient existence of the exited state, dynamic quenching occurs; however, if the fluorophore–quencher complex was formed in the ground state, it will be static quenching. Electronic spectra of BSA with complexes are shown in Fig. S7 (ESI†). After addition of complexes, a slight enhancement in the absorption intensity was observed, which suggests that the static quenching process may occur between our complex and BSA.24
In vitro cell cytotoxicity
The in vitro cytotoxicity against HeLa cells of complexes 1 and 2 was carried out using the CCK-8 assay. The CCK-8 assay is a well-established method for determination of cell viability in cell proliferation and cytotoxicity assays,49,50 which utilizes Dojindo's highly water-soluble tetrazolium salt, WST-8, to produce water-soluble formazan dye upon reduction in the living cells to determine the number of cells. The results have been analyzed by means of cell inhibition expressed as IC50 values. After incubation for 48 h, 1 (6.89 μM) shows about 11-fold lower IC50 value than 2 (78.4 μM). Notably, 1 even exhibits remarkably high cytotoxicity against HeLa cells compared to cisplain with about 2 times lower IC50 value than cisplain (15 μM),51 which indicates that 1 looks like a potential metal-based anticancer drug. However, further studies are still needed to assess the actual mechanism of biological activity of 1.
Conclusion
Two new mononuclear complexes have been synthesized and characterized in this work. The crystal structure of 2 is different from 1 as a result of coordination of water molecules; but they show a similar structure in solution, moreover, complex 1 shows good water solubility than 2. The two complexes show similar DNA binding abilities, which were investigated by absorption and fluorescence measurements. However, a great difference appeared in their DNA cleavage activities. Complex 1 could cause DNA to cleave effectively without the activator, while with the same concentration, complex 2 causes only about 50% fragmentation of DNA in the presence of external agents such as H2O2. We conclude that the difference in the redox activity of metal ions may play an important role in the cleavage process. So cleavage mechanism assays have been carried out by introduction of ROS inhibitors. The results suggest that the hydroxyl radical was proposed as the main ROS involved in the cleavage mechanism and metal ions also play an important role in the process. However, the exact DNA cleavage mechanism is unknown, further investigations are still needed. According to the results obtained from fluorescence and UV-vis spectrometry, we speculate that complexes could bind with BSA in a static quenching process. Notably, 1 shows a considerable cytotoxic activity (IC50 = 6.89 μM) against HeLa cells even better than cisplatin, which suggests that 1 may be a potential anticancer drug. The difference in the electronic configuration of Cu (d10s1) and Ni (d8s2) resulted in their different redox activity: it is much more easy to reduce Cu(II) to Cu(I) than to reduce or oxidize Ni(II), and Cu(II) is an excellent Fenton catalyst while Ni(II) is very poor. Incorporation of redox active and inactive metals into compounds may result in a difference in their biological activity, we hope that the results may contribute to further investigations of how compounds work in the biological system.
Acknowledgements
This work was supported by the National Natural Science Foundation of China (21171101, 21371103 and 21471085), Tianjin Science Foundation (No. 12JCYBJC13600), NFFTBS (No. J1103306) and MOE Innovation Team (IRT13022) of China.
References
-
World Health Organization, Cancer, WHO Press, Geneva, 2013, Fact sheet No. 297 Search PubMed.
- K. D. Mjos and C. Orvig, Chem. Rev., 2014, 114, 4540 CrossRef CAS PubMed.
- M. F. Primik, S. Göschl, S. M. Meier, N. Eberherr, M. A. Jakupec, A. Enyedy, G. Novitchi and V. B. Arion, Inorg. Chem., 2013, 52, 10137 CrossRef CAS PubMed.
- M. A. Sgambellone, A. David, R. N. Garner, K. R. Dunbar and C. Turro, J. Am. Chem. Soc., 2013, 135, 11274 CrossRef CAS PubMed.
- U. Basu, I. Khan, A. Hussain, B. Gole, P. Kondaiah and A. R. Chakravarty, Inorg. Chem., 2014, 53, 2152 CrossRef CAS PubMed.
- A. Lauria, R. Bonsignore, A. Terenzi, A. Spinello, F. Giannici, A. Longo, A. M. Almerico and G. Barone, Dalton Trans., 2014, 43, 6108 RSC.
- I. E. Leon, A. L. Di Virgilio, V. Porro, C. I. Muglia, L. G. Naso, P. M. Williams, M. Bollati-Fogolin and S. B. Etcheverry, Dalton Trans., 2013, 42, 11868 RSC.
- M. L. Zastrow and V. L. Pecoraro, Biochemistry, 2014, 53, 957 CrossRef CAS PubMed.
- C. Santini, M. Pellei, V. Gandin, M. Porchia, F. Tisato and C. Marzano, Chem. Rev., 2014, 114, 815 CrossRef CAS PubMed.
- L. Li, K. Du, Y. Wang, H. Jia, X. Hou, H. Chao and L. N. Ji, Dalton Trans., 2013, 42, 11576 RSC.
- W. Zhou, X. Wang, M. Hu and Z. J. Guo, J. Inorg. Biochem., 2013, 121, 114 CrossRef CAS PubMed.
- M. Kyropoulou, C. P. Raptopoulou, V. Psycharis and G. Psomas, Polyhedron, 2013, 61, 126 CrossRef CAS PubMed.
- J. Tan, L. Zhu and B. Wang, Dalton Trans., 2009, 4722 RSC.
- M. D. Rosch and A. W. C. Trogler, Inorg. Chem., 1990, 29, 2409 CrossRef.
- M. M. Ibrahim, A. M. M. Ramadan, G. M. Mersal and S. A. El-Shazly, J. Mol. Struct., 2011, 998, 1 CrossRef CAS PubMed.
- Q. Y. Chen, H. J. Fu, W. H. Zhu, Y. Qi, Z. P. Ma, K. D. Zhao and J. Gao, Dalton Trans., 2011, 40, 4414 RSC.
- C. Y. Gao, X. Qiao, Z. Y. Ma, Z. G. Wang, J. Lu, J. L. Tian, J. Y. Xu and S. P. Yan, Dalton Trans., 2012, 41, 12220 RSC.
- Q. Jiang, N. Xiao, P. Shi, Y. Zhu and Z. J. Guo, Coord. Chem. Rev., 2007, 251, 1951 CrossRef CAS PubMed.
- Y. Zhao, J. Zhu, W. He, Z. Yang, Y. Zhu, Y. Li, J. Zhang and Z. J. Guo, Chem. – Eur. J., 2006, 12, 6621 CrossRef CAS PubMed.
- M. Ozyanik, S. Demirel, H. Bektas, N. Demirbas and S. A. Karaoglu, Turk. J. Chem., 2012, 36, 233 CAS.
- G. P. Volynets, M. O. Chekanov, A. R. Synyugin, A. G. Golub, O. P. Kukharenko, V. G. Bdzhola and S. M. Yarmoluk, J. Med. Chem., 2011, 54, 2680 CrossRef CAS PubMed.
- O. K. Abou-Zied and O. I. K. Al-Shihi, J. Am. Chem. Soc., 2008, 130, 10793 CrossRef CAS PubMed.
- A. Patra, T. K. Sen, A. Ghorai, G. T. Musie, S. K. Mandal, U. Ghosh and M. Bera, Inorg. Chem., 2013, 52, 2880 CrossRef CAS PubMed.
- S. M. T. Shaikh, J. Seetharamappa, S. Ashoka and P. B. Kandagal, Dyes Pigm., 2007, 73, 211 CrossRef CAS PubMed.
- A. S. Kunishita, T. Osako, Y. Tachi, J. Teraoka and A. S. Itoh, Bull. Chem. Soc. Jpn., 2006, 79, 1729 CrossRef CAS.
- S. V. Kryatov, S. Taktak, I. V. Korendovych and E. V. Rybak-Akimova, Inorg. Chem., 2005, 44, 85 CrossRef CAS PubMed.
-
G. M. Sheldrick, Program for the Solution of Crystal Structure, University of Göttingen, Germany, 1997 Search PubMed.
-
G. M. Sheldrick, Program for the Refinement of Crystal Structure, University of Göttingen, Germany, 1997 Search PubMed.
- A. L. Spek, J. Appl. Crystallogr., 2003, 36, 7 CrossRef CAS.
- J. Marmur, J. Mol. Biol., 1961, 2, 1961 Search PubMed.
- R. Kannappan, S. Tanase, I. Mutikainen, U. Turpeinen and J. Reedijk, Inorg. Chim. Acta, 2005, 358, 383 CrossRef CAS PubMed.
- C. Rajarajeswari, R. Loganathan, M. Palaniandavar, E. Suresh, A. Riyasdeen and M. A. Akbarsha, Dalton Trans., 2013, 42, 8347 RSC.
- J. Adhikary, P. Chakraborty, S. Das, T. Chattopadhyay, A. Bauzá, S. K. Chattopadhyay, B. Ghosh, F. A. Mautner, A. Frontera and D. Das, Inorg. Chem., 2013, 52, 13442 CrossRef CAS PubMed.
- M. Kyropoulou, C. P. Raptopoulou, V. Psycharis and G. Psomas, Polyhedron, 2013, 61, 126 CrossRef CAS PubMed.
- M. T. Carter, M. Rodriguez and A. J. Bard, J. Am. Chem. Soc., 1989, 111, 8901 CrossRef CAS.
- G. J. Chen, Z. G. Wang, Y. Y. Kou, J. L. Tian and S. P. Yan, J. Inorg. Biochem., 2013, 122, 49 CrossRef CAS PubMed.
- A. M. Angeles-Boza, P. M. Bradley, K. L. Fu, S. E. Wicke, J. Bacsa, K. R. Dunbar and C. Turro, Inorg. Chem., 2004, 43, 8510 CrossRef CAS PubMed.
- F. J. Meyer-Almes and D. Porschke, Biochemistry, 1993, 32, 4246 CrossRef CAS.
- R. F. Pasternack, M. Caccam, B. Keogh, T. A. Stephenson, A. P. Williams and A. E. J. Gibbst, J. Am. Chem. Soc., 1991, 113, 6835 CrossRef CAS.
- J. R. Lakowicz and A. G. Weber, Biochemistry, 1973, 12, 4161 CrossRef CAS.
- P. U. Maheswari, K. Lappalainen, M. Sfregola, S. Barends, P. Gamez, U. Turpeinen, I. Mutikainen, G. P. Van Wezel and J. Reedijk, Dalton Trans., 2007, 3676 RSC.
- P. U. Maheswari, S. Roy, H. D. Dulk, S. Barends, G. V. Wezel, B. Kozlevc, P. Gamez and J. Reedijk, J. Am. Chem. Soc., 2006, 128, 710 CrossRef CAS PubMed.
- P. P. Silva, W. Guerra, J. N. Silveira, A. M. D. C. Ferreira, T. Bortolotto, F. L. Fischer, H. N. Terenzi, A. Neves and E. C. Pereira-Maia, Inorg. Chem., 2011, 50, 6414 CrossRef CAS PubMed.
- S. Borah, M. S. Melvin, N. Lindquist and A. R. A. Manderville, J. Am. Chem. Soc., 1998, 120, 4557 CrossRef CAS.
- J. Tan, B. Wang and L. Zhu, J. Biol. Inorg. Chem., 2009, 14, 727 CrossRef CAS PubMed.
- R. D. Senthil, G. Paramaguru, N. S. P. Bhuvanesh, J. H. Reibenspies, R. Renganathan and K. Natarajan, Dalton Trans., 2011, 40, 4548 RSC.
- R. D. Senthil, N. S. P. Bhuvanesh and K. Natarajan, Inorg. Chem., 2011, 50, 12852 CrossRef PubMed.
- M. Alagesan, N. S. P. Bhuvanesh and N. Dharmaraj, Dalton Trans., 2013, 42, 7210 RSC.
- M. Liong, J. Lu, M. Kovochich, T. Xia, S. G. Ruehm, A. E. Nel, F. Tamanoi and J. I. Zink, ACS Nano, 2008, 2, 889 CrossRef CAS PubMed.
- L. Yuan, W. Chen, J. Hu, J. Z. Zhang and D. Yang, Langmuir, 2013, 29, 734 CrossRef CAS PubMed.
- R. W. Y. Sun, A. L. F. Chow, X. H. Li, J. J. Yan, S. S. Y. Chui and C. M. Che, Chem. Sci., 2011, 2, 728 RSC.
Footnote |
| † Electronic supplementary information (ESI) available. CCDC 1028398 and 1028399. For ESI and crystallographic data in CIF or other electronic format see DOI: 10.1039/c4nj00876f |
|
| This journal is © The Royal Society of Chemistry and the Centre National de la Recherche Scientifique 2015 |
Click here to see how this site uses Cookies. View our privacy policy here. 


