Sustained anti-BCR-ABL activity with pH responsive imatinib mesylate loaded PCL nanoparticles in CML cells†
Barbara
Cortese
ab,
Stefania
D'Amone
a,
Giuseppe
Gigli
acd and
Ilaria Elena
Palamà
*a
aInstitute Nanoscience CNR (NNL, CNR-NANO), via Arnesano, Lecce, Italy. E-mail: ilariaelena.palama@nano.cnr.it
bDepartment of Physics, University Sapienza, P. le A. Moro 5, Rome, Italy
cDept. Matematica e Fisica ‘Ennio De Giorgi’, University of Salento, via Monteroni, Lecce, Italy
dItalian Institute of Technology (IIT) – Center for Biomolecular Nanotechnologies, via Barsanti, Arnesano, Italy
First published on 8th October 2014
Abstract
Imatinib mesylate (IM) is an inhibitor that targets the tyrosine kinase activity of BCR-ABL present in Chronic Myeloid Leukemia (CML). Here, IM–chitosan complex loaded poly(ε-caprolactone) (PCL) nanoparticles (NPs) are recommended for their potential in supporting controlled release and improving the chemotherapeutic efficiency of IM. The nanoparticles with a size of about 247 nm have a core–shell structure with an IM-containing inner core surrounded by a PCL layer. The presence of chitosan (CH) allows one to modulate the release kinetics in a pH-dependent manner. IM is released from the NPs much more quickly at pH 4.0 and 6.0 than at pH 7.4, which is a desirable characteristic for cancer-targeted drug delivery. Our core–shell PCL NPs could provide a simple and easy way to allow controlled release of IM and improve their chemotherapeutic efficiency, combining the pH sensibility of CH and the slow degradation of PCL.
Introduction
CML is a hematologic malignancy that is recognized by the presence of Philadelphia (Ph) chromosome which is the result of a reciprocal chromosomal translocation t (9; 22) in hemopoietic cells.1,2 BCR-ABL, a constitutively active protein kinase, is the product of Ph chromosome and plays a key role in the pathogenesis of CML, likely via phosphorylation of multiple downstream protein targets, resulting in the activation of cellular pathways and therapeutic resistance. The introduction of the tyrosine-kinase inhibitor (TKI) imatinib mesylate (IM, STI571, Gleevec) in the treatment of CML has been a major medical breakthrough in controlling this disease.3 Nevertheless, a subpopulation of BCR-ABL+ cells in the niche are found which display stem cell-like features, such as self-renewal and quiescence.4–7 These CML stem cells are shown to be unresponsive to the TKI treatment and are capable of deriving the disease during relapse. This leads to IM dose escalation or early disease relapses when therapy is stopped or discontinued. Potential risks of adverse effects with long-term treatment with IM have refocused the interest of researchers towards nanocarriers for delivery to increase the drug's retention effects8 and antileukemic activity in viable residual CML cells. In this context, we have previously validated two types of polymeric vectors for IM delivery to CML cells. IM-loaded polyelectrolyte microcapsules were validated as effective purging agents to eradicate positive BCR-ABL cells from CML patients.9 Then, we have also validated IM loaded polyelectrolyte nanocomplexes (PECs) as effective carriers to maximize the apoptotic effects of IM in CML cells, at a tenfold lower dose compared with that reaching 50% cell viability inhibition in vitro.10,11 IM-loaded PECs, in marrow CD34+ cells derived from CML patients, have enhanced antileukemic effects compared with the same concentration of free IM. The better efficacy of IM–PECs in promoting a constant inhibition of BCR-ABL in a more effective fashion compared with IM-loaded polyelectrolyte microcapsules could reveal their capacity to delay with cytosolic and nuclear BCR-ABL activity.In recent years, more attention has been paid to stimuli-sensitive drug delivery systems that are promising strategies for drug release.12 Many techniques have been developed to produce systems that could be used for effective encapsulation of active agents, as drugs or genes.13–16 More studies, for example, were focused on delivery systems that could be simply extravasated from the blood vessels and deliver the loaded drugs to cancer cells by improved permeability and retention effect during cancer chemotherapy.17
In particular, external and internal stimuli, such as temperature,18 pH,19,20 light,21 and protease,22 could be utilized to control the drug release in delivery systems.23 Among all these strategies, release systems based on pH variation have obtained more attention, in particular in the cancer therapy field, because the pH difference between normal and tumour cells could be used for targeting drug design. The pH values in the human body naturally vary between the different organs and tissues, which makes the pH-triggered approach one of the most efficient strategies for drug delivery.24 With this aim, in this work we explore a novel IM delivery system based on pH responsive core shell nanoparticles. An attractive polymer for drug delivery applications is poly(ε-caprolactone) (PCL), approved by the Food and Drug Administration (FDA). PCL nanoparticles are promising for their high colloidal stability in biological fluid, facile cellular uptake, low toxicity in vitro and in vivo, slow degradation and controlled release.25
The PCL NPs, obtained by the emulsion–diffusion–evaporation method, are composed of a core with the IM and a PCL shell. Prior to the particle assembly, IM complexes with chitosan (CH), a polycation widely used as a matrix in drug release systems based on pH variation.26 Our core–shell PCL NPs could provide a simple and easy way to enable controlled release of IM and improve its therapeutic efficiency, by combining the pH sensibility of CH and the slow degradation of PCL. In addition, PVA coating of PCL NPs is used to increase colloidal stability.
The physicochemical properties of the NPs were characterized by using various techniques. The loading efficiency and release kinetics were analysed under different physiological conditions. Cellular uptake and cytotoxicity of PCL NPs were evaluated on CML and healthy cells.
Materials and methods
Materials
All tissue culture media and serum were purchased from Sigma-Aldrich, cell lines were purchased from American Tissue Type Collection (ATTC). The supplies of the chemicals were as follows and were supplied by Sigma-Aldrich: thiazolyl blue tetrazolium bromide (MTT), ethidium bromide (EtBr), acridine orange (AO), HOECHST 33342, anti-clathrin light chain monoclonal antibody, fluoroshield with DAPI, chitosan (CH) low molecular range with degree of deacetylation 75–85%, poly(caprolactone) (PCL) with an average molecular weight (MW) of 14.800 Da, and polyvinyl alcohol (PVA, MW 13–23 kDa, 87–80% hydrolyzed). MitoTracker, ERtracker, and LysoTracker from Life Technology.PCL NP preparation
PCL nanoparticles were prepared by an emulsion–diffusion–evaporation method. Briefly, a solution of IM (10–100 μM) complexes with a 1% (w/v) chitosan in acetic acid aqueous solution by incubating at room temperature (RT) for 24 hours under stirring. A 100 mg of PCL was dissolved in 10 mL organic phase (9 mL ethyl acetate and 1 mL acetone) for 1 hour at 30 °C. As for the aqueous phase, 100 mg PVA were stirred in 5 mL water at RT until a clear solution was obtained, after, IM–CH complex solution was mixed. The organic phase was passed through a 0.22 μm syringe filter and then added dropwise to the aqueous phase under constant stirring. The resulting emulsion was kept under constant agitation at 1000 rpm for 1 hour and was subsequently sonicated for 30 minutes. This colloidal preparation was diluted to a volume of 50 mL by adding water dropwise under stirring conditions (1000 rpm), which resulted in nanoprecipitation. In order to remove the organic solvent and to harden the PCL nanoparticles, the suspension was dried with a rotary evaporator at 50 mbar at 40 °C for 20 minutes. Next, the nanoparticle suspension was washed three times with water by centrifugation at 12![[thin space (1/6-em)]](https://www.rsc.org/images/entities/char_2009.gif) 000 rpm for 10 minutes and then resuspended in water. The final nanoparticle suspension was stored at 4 °C for further use. To determine the concentration of nanoparticles (w/v), this suspension was centrifuged at 12
000 rpm for 10 minutes and then resuspended in water. The final nanoparticle suspension was stored at 4 °C for further use. To determine the concentration of nanoparticles (w/v), this suspension was centrifuged at 12![[thin space (1/6-em)]](https://www.rsc.org/images/entities/char_2009.gif) 000 rpm for 10 minutes; the supernatant was removed and the pellet was allowed to dry under a nitrogen stream before weighing. For preparing fluorescent CH-FITC or CH-TRITC PCL nanoparticles, a 1 mg mL−1 CH-FITC or CH-TRITC was added to PCL solution and the formulation was carried out as described previously. The labeled nanoparticles were stored in the dark at 4 °C until use.
000 rpm for 10 minutes; the supernatant was removed and the pellet was allowed to dry under a nitrogen stream before weighing. For preparing fluorescent CH-FITC or CH-TRITC PCL nanoparticles, a 1 mg mL−1 CH-FITC or CH-TRITC was added to PCL solution and the formulation was carried out as described previously. The labeled nanoparticles were stored in the dark at 4 °C until use.
Nanoparticle size, surface charge studies and stability
The particle size and zeta potential were determined by Dynamic Light Scattering (DLS) analysis using a Zetasizer Nano ZS90 (Malvern Instruments Ltd., USA) equipped with a 4.0 mW He–Ne laser operating at 633 nm and an avalanche photodiode detector. Measurements were made at 25 °C in aqueous solutions (pH 7). The PCL NP solution (1 mg mL−1) was passed through a 0.45 μm pore size filter before measurements and appropriately diluted if necessary according to the instrument's requirements. The stability of IM–CH PCL NPs was tested under physiological conditions. Nanoparticles were incubated in complete RPMI medium at 37 °C and the size variation was measured over a period of 8 days by DLS analysis. Representative measurements of three distinct sets of data have been reported (Student's t-test, P < 0.05).Scanning electron microscopy (SEM) and atomic force microscopy (AFM)
For SEM and AFM analyses, samples were prepared by applying a drop of the particle suspension to a SiO2 wafer and then drying overnight. Prior to SEM (RHAIT 150) observation, the samples were sputter-coated with a 10 nm gold layer to make them electronically conductive and to avoid electronic charging during SEM imaging. The morphological characterization has been performed by tapping mode AFM using a Solver PRO Scanning Probe Microscope (NT-MDT) in air at room temperature and we used TESPA (Veeco, USA) silicon cantilevers of 20–80 N m−1 spring constant and a resonance frequency of around 300 kHz.Determination of drug loading and in vitro drug release
The nanoparticle drug loading efficacy was determined by evaluating the IM content present in the supernatant of the nanoparticle suspension (100 μL of supernatant diluted in 1 mL with PBS 1×) evaluated using an UV-visible spectrophotometer (Varian Cary® 300 Scan; Varian Instruments, CA, USA) at a wavelength of 260 nm. The dose of IM loaded into PCL NPs was calculated using eqn (1): | (1) |
Release behaviour of IM from NPs was investigated at pH 4.0 (pH in endosome/lysosomes), pH 6.0 (tumour environment pH), and pH 7.4 (pH of physiological blood). 50 mg of lyophilized IM–CH PCL nanoparticles were dispersed in 5 mL of PBS 1× at pH 7.4 and 500 μL of sample was dialyzed in a large volume of PBS 1× at pH 4.0, pH 6.0 and pH 7.4, and kept at 37 °C ± 0.5 °C under stirring at 50 rpm. At specified time intervals, the samples were centrifuged (12![[thin space (1/6-em)]](https://www.rsc.org/images/entities/char_2009.gif) 000 rpm for 10 minutes) and supernatants were collected. Samples were taken and analysed in triplicate. The concentration of IM release was determined from the corresponding absorbance measured using the spectrophotometer at 260 nm. Representative measurements of three distinct sets of data have been reported (Student's t-test, P < 0.05).
000 rpm for 10 minutes) and supernatants were collected. Samples were taken and analysed in triplicate. The concentration of IM release was determined from the corresponding absorbance measured using the spectrophotometer at 260 nm. Representative measurements of three distinct sets of data have been reported (Student's t-test, P < 0.05).
Cell culture
Human BCR-ABL positive cells (KU812) were established from a CML patient27 and human normal B lymphoblast (C13589) was cultured in RPMI 1640 (Sigma-Aldrich) containing 10% FBS (Sigma-Aldrich), 100 units per mL penicillin, 100 μg mL−1 streptomycin and 2 mM L-glutamine (Sigma-Aldrich) at 37 °C and 5% CO2.Cell uptake efficiency of IM loaded NPs
KU812 and C13895 cells were seeded in 24-well plates (105 cells per well) in complete culture media and were incubated with drug or drug loaded nanoparticles for 1, 2, 3 and 4 hours, respectively at 37 °C. For each sample, we have seeded six wells for positive control and six wells for sample wells. At the selected interval, the sample wells were washed three times with cold PBS 1×. After that, all the wells were lysed by 0.5% Triton X-100 in 0.2 N NaOH solution. The quantity of IM in the cells was fluorometrically determined for the lysate with an excitation wavelength of 254 nm and an emission wavelength of 380 nm using a fluorescence spectrometer. The cellular uptake efficiency was expressed as the percentage of the fluorescence associated with the cells vs. that are present in the positive control cells. Representative measurements of three distinct sets of data have been reported (Student's t-test, P < 0.05).Analysis of uptake modality and intracellular localization
KU812 CML cells and C13895 (105 cells per mL) were incubated with the FITC PCL NP dispersions at a concentration of 0.05 mg mL−1 to determine the cellular uptake of the PCL NPs. After 3 hours of incubation at 37 °C, the culture medium was removed, and the cells were washed three times with PBS 1×. For fluorescent microscopic observation, cells were fixed in situ for 5 minutes in 3.7% formaldehyde and mounting with fluoroshield with DAPI.The uptake modality of the PCL NPs was evaluated by incubating KU812 cells (105 cells per mL) with 0.05 mg mL−1 PCL-TRICT NPs for 1–3 hours, then washed three times with 0.27% glucose/PBS and fixed in ice-cold methanol. After several washes with PBS, cells were incubated at RT for 50 min with blocking buffer (PBS with 4% horse serum, 0.3% Triton X-100 and 1% BSA) to block non-specific binding. They were then incubated with an anti-clathrin light chain monoclonal antibody (10 μg mL−1; Sigma-Aldrich) at 37 °C for 1 hour. The primary antibody was revealed using a fluorescein isothiocyanate conjugated anti-mouse antibody (4 μg mL−1; Millipore, MA, USA) as the secondary antibody and mounting with fluoroshield with DAPI.
To study the intracellular localization of FITC-PCL NPs, immunostaining with LysoTracker Red (Life technology), MitoTracker Red (Life technology) and ER-Tracker Red (Life technology) was performed, in accordance with the manufacturer's instructions, to label lysosomes, mitochrondria and endoplasmic reticulum, respectively. Confocal micrographs were taken with a Leica confocal scanning system mounted into a Leica TCS SP5 (Leica Microsystem GmbH, Mannheim, Germany), equipped with a 63× oil immersion objective and a spatial resolution of approximately 200 nm in x–y and 100 nm in z.
Quantitative analysis of colocalization
For colocalization analysis, ten different fields were randomly selected for each sample, and three distinct experiments were performed. We employed the coefficient of correlation (CC or Pearson's r),28 intensity correlation quotient (ICQ)29 and overlap coefficient (OC)30 as indices of the frequency of colocalization between PCL NPs and LysoTracker, MitoTracker and ER-Tracker. These indices are all based on pixel-based quantitative analysis of confocal images. CC immunofluorescence signals in the confocal images can range from −1 to 1, where 1 means the perfect overlap, and 0 means random distribution. ICQ for the fluorescence signals can show a range from −0.5 to 0.5, where 0.5 means the perfect overlap, and 0 means the random overlap. OC for the fluorescence signals can range from 0 to 1, where 0 means no overlap, and 1 indicates the perfect overlap.In 12 bit confocal images, pixels with an intensity of 0 or 4095 are deemed to be lacking linearity of fluorescence signals. We therefore carefully determined gain and offset values not to contain pixels with 0 or 4095 intensity when capturing confocal images. Only a few pixels with 0 or 4095 intensity in the red or green colour channels were excluded from the calculation of CC, ICQ and OC. It has been reported that exclusion of such pixels improves fidelity of quantitative co-localization analysis.31 For objective selection of the pixels, we defined thresholds according to background immunofluorescence measured from the negative control sections. Because the maximum intensity in an image of the control sample fluctuated between images presumably due to thermal noise arising in the photon detector, we instead used the 999/1000 quantile of intensity (i.e. the highest intensity after removal of the highest 0.1% of data) in each colour channel as the thresholds, we defined the threshold of each colour channel to be the mean value from three images of the control sections. Randomized confocal images were prepared by shuffling of pixels within an image and used for calculation of the coefficients and quotients, as described elsewhere.32 After the exclusion of pixels unsuitable for the present analysis, shuffling was done only for pixels in the green channel of an image, and the shuffled pixels were paired with pixels in the unchanged red channel. For each confocal image, shuffling was repeated three times, and the mean of coefficients from the three shuffled data was calculated as a representative value for the image unless otherwise stated. All the calculations of coefficients and quotients from each confocal image, as well as pixel shuffling and calculation of the 999/1000 quantile of intensity, were done using custom-made plug-in programs (available at http://www.mbs.med.kyoto-u.ac.jp/imagej/index.html) combined with ImageJ software (National Institute for Health, Bethesda, MD, USA). The numerical data were imported to Excel software (Microsoft, Redmond, WA, USA) for further calculation and the results were plotted as graphs. Representative measurements of three distinct sets of data have been reported (Student's t-test, P < 0.05).
Apoptosis evaluation
KU812 leukemia cells (105 cells per mL) were incubated with free IM (10 nM) and IM loaded PCL NPs (10 nM) and after 3 days of incubation, cells were washed and resuspended with PBS 1×. Then, cells were stained with May-Grünwald and Giemsa (Sigma-Aldrich, USA) and were analysed for the morphometric analysis using a light microscope BX61 (Olympus).The apoptotic cells were evaluated by mixing 9 mL of cell suspension (105 cells per mL) with 5 μL of dye mixture composed of 100 mg mL−1 acridine orange (AO) and 100 mg mL−1 ethidium bromide (EtBr). After 5 minutes of incubation, cells were visualized under a fluorescence microscope BX61 (Olympus) with an excitation filter at 510–590 nm. The percentage of total apoptotic cells is determined by eqn (2):
 | (2) |
Ten different fields were randomly selected for counting 300 cells. Representative measurements of three distinct sets of data have been reported (Student's t-test, P < 0.05).
In addition, apoptosis was investigated by staining the cells with HOECHST 33342 (Sigma-Aldrich, USA). The cells were washed with PBS 1× and then fixed in PBS containing 10% formaldehyde for 2 hours at RT. The fixed cells were washed with PBS 1× and stained with HOECHST 33342 for 1 hour at RT. The Hoechst-stained nuclei were visualized using a fluorescence microscope BX61 (Olympus) with an excitation filter at 358–461 nm.
In vitro cytotoxicity assay
To test the effect of empty (CH–PCL) or IM loaded NPs on cell growth, 3-[4,5-dimethylthiazol-2-yl]-2,5-diphenyl tetrazolium bromide (MTT) survival tests were performed in accordance with the manufacturer's instructions (Sigma-Aldrich, USA). The IC50 of IM was calculated. Briefly, KU812 and C13895 cells were seeded on 24-well plates at a density of 105 cells per well in complete culture media and NPs were added to each well. Untreated samples were used as the control groups. The medium was changed every two days for long time windows of incubations. After an appropriate incubation period, the cultures were removed from the incubator and the MTT solution was added in an amount equal to 10% of the culture volume. Then the cultures were returned to the incubator and incubated for 3 hours. After the incubation period, the cultures were removed from the incubator and the resulting MTT formazan crystals were dissolved with acidified isopropanol solution to an equal culture volume. The plates were read within 1 hour after adding acidified isopropanol solution. The absorbance was spectrophotometrically measured at wavelength 570 nm and the background absorbance was measured at 690 nm subtracted.The percentage viability is expressed as the relative growth rate (RGR) by eqn (3):
 | (3) |
Detection of DNA fragmentation
KU812 leukemia cells (106 cells per mL) were incubated for 12 hours with IM free and IM–CH loaded PCL NP suspension (10 nM). The control (NT) was complete culture medium only. Then, the cells lysed with lysis buffer (50 mM Tris HCl, pH 8.0, 10 mM ethylenediaminetetraacetic acid, 0.1 M NaCl, and 0.5% sodium dodecyl sulfate). The lysate was incubated with 0.5 mg mL−1 RNase A at 37 °C for 1 hour, and then with 0.2 mg mL−1 proteinase K at 50 °C overnight. Phenol extraction of this mixture was carried out and DNA in the aqueous phase was precipitated by 1/10 volume of 7.5 M ammonium acetate and 1/1 volume isopropanol. DNA electrophoresis was performed in a 1% agarose gel containing 1 μg mL−1 EtBr at 70 V, and the DNA fragments were visualized by exposing the gel to ultraviolet light, followed by photography.Validation of BCR-ABL inhibition by Western Blotting
CML cells incubated for 8 days with IM free or IM–CH loaded PCL NPs were washed with PBS at 4 °C and resuspended in lysis buffer (50 mM tris HCL, pH 7.4; 1% Triton X-100; 5 mM EDTA; 150 mM NaCL; 1 mM Na3VO4; 1 mM NaF; 1 mM phenylmethylsulfonylfluoride), and protease inhibitor cocktail (10 μM benzamidine-HCl and 10 μg of aprotinin, leupeptin and pepstatin A per mL) followed by incubation on ice for 30 minutes. Lysates were clarified by centrifugation at 13![[thin space (1/6-em)]](https://www.rsc.org/images/entities/char_2009.gif) 000 rpm for 15 minutes at 4 °C and the protein concentration was determined using the BCA protein assay (Pierce, IL, USA). Protein bands were separated on SDS-polyacrylamide gels and immunoblotting was performed using an Immobilon-P nitrocellulose membrane (Millipore Corp., MA, USA). Primary incubations with anti-phosphotyrosine (clone 4G10, Upstate Biotechnology) and anti-c-ABL antibodies (clone K-12, Santa Cruz Biotechnology Inc., CA, USA) were performed for 1–3 hours. Secondary incubations were performed for 1 hour with HRP-conjugated anti-mouse or anti-rabbit antibodies (Amersham, IL, USA). Proteins were visualized by chemiluminescence (Super Signal, IL, USA).
000 rpm for 15 minutes at 4 °C and the protein concentration was determined using the BCA protein assay (Pierce, IL, USA). Protein bands were separated on SDS-polyacrylamide gels and immunoblotting was performed using an Immobilon-P nitrocellulose membrane (Millipore Corp., MA, USA). Primary incubations with anti-phosphotyrosine (clone 4G10, Upstate Biotechnology) and anti-c-ABL antibodies (clone K-12, Santa Cruz Biotechnology Inc., CA, USA) were performed for 1–3 hours. Secondary incubations were performed for 1 hour with HRP-conjugated anti-mouse or anti-rabbit antibodies (Amersham, IL, USA). Proteins were visualized by chemiluminescence (Super Signal, IL, USA).
Results and discussion
Synthesis and characterization of PCL nanoparticles loaded with IM
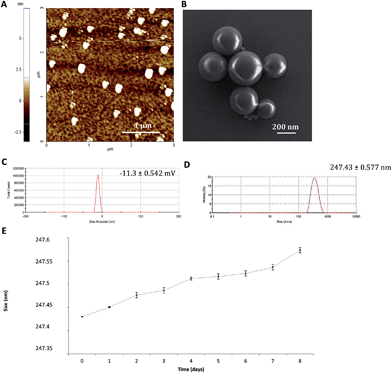
The IM–CH loaded PCL nanoparticles were prepared by the emulsion–diffusion–solvent evaporation method. IM–CH complexes were formed in aqueous solution and then were mixed with PVA aqueous solution and this aqueous core was coated with the oil phase containing the PCL molecules.The nanoparticles observed by AFM and SEM (Fig. 1A and B, respectively) have a spherical morphology with a good size distribution. The resulting NPs were characterized for their physicochemical properties, as size and surface zeta potential. As shown in Fig. 1C, unloaded PCL nanoparticles had a zeta potential of −11.3 mV ± 0.542 mV and a diameter of 247.43 nm ± 0.577 nm (Fig. 1D) with a polydispersion index (PdI) of 0.334 ± 0.040. A similar size and zeta potential of IM–CH PCL nanoparticles were observed, as shown in ESI Fig. S1.†
IM–CH loaded PCL NP stability was tested under physiological conditions. NPs were incubated in complete RPMI medium at 37 °C and the size variation was measured over a period of 8 days by DLS analysis. As shown in Fig. 1E, over a period of 8 days PCL NPs preserve their hydrodynamic size of about 247 nm and no significant change in PdI was observed, supporting particle stability evidence in physiological settings.
IM loading in PCL NPs and drug release kinetics under different physiological conditions
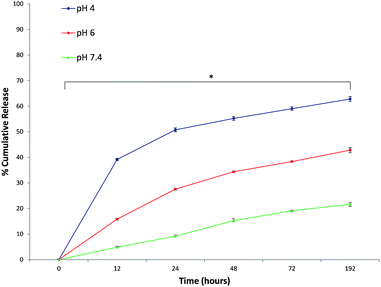
Formulation optimization and purification processes led to a high encapsulation efficiency (88 ± 2.5%) without altering the size and sphere-shaped morphology of nanoparticles. The drug content is a crucial problem for a drug delivery system, different IM doses were tested to maximize the NP IM content. After the lyophilisation and re-dispersion, the hydrodynamic size of the IM PCL NPs was scarcely altered suggesting that the IM–CH loaded PCL NPs have good re-dispersion stability. In addition, it was found that IM loading had insignificant effect either on the size or zeta potential possibly because IM is principally dispersed in the polymer nanoparticle core (see ESI Fig. S1 and S2†). Therefore, any additional growth of IM precipitates is prohibited and all IM molecules are immobilized inside the NPs leading to high drug encapsulation efficiency.As shown in Fig. 2, IM release was governed by medium pH and release time. Drug release at pH 7.4 was slow and constant, with release percentage at about 21.65 ± 0.67% in 192 hours. Conversely, at lower pH, the IM release rate was much quicker, with about 42.79 ± 0.98% (pH 6.0) and 62.79 ± 0.98% (pH 4.0) of the IM released. These different release kinetics are indeed associated with different release mechanisms. At pH 7.4, IM release is governed by the molecules diffused out of the hydrophilic core, through the holes of the PCL/PVA shell, endorsing that in neutral pH the IM release is determined by passive diffusion through the polymeric shell holes. In contrast, IM–CH complex protonation at lower pH is probably linked with the CH–PCL shell hydrolysis under acid conditions that would gradually increase the nanoparticle permeability with rapid IM release. It can be assumed that most IM will remain in the NPs for a significant time period under normal physiological conditions, demonstrating the potential for prolonged drug retention time in blood circulation and thereby greatly reducing the side effects to normal tissues. Conversely, when IM-loaded chitosan–PCL nanoparticles are engaged by CML cells, a closer release may occur at lower local pH, leading to substantial enhancement in cancer treatment efficacy.33
Cellular uptake and intracellular localization
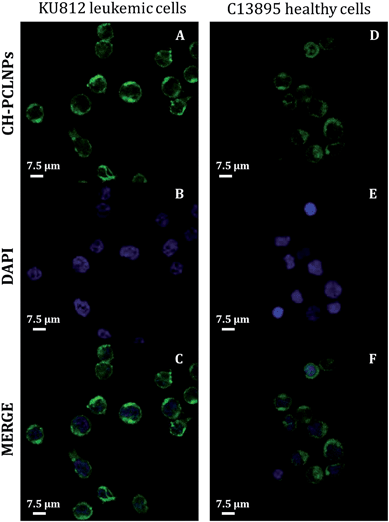
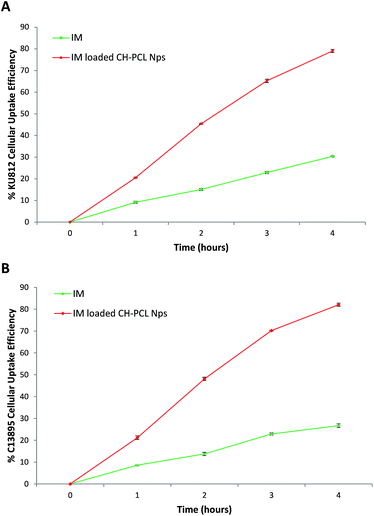
Uptake of CH–PCL NPs in KU812 leukemia cells and in healthy C13895 cells was studied by confocal laser scanning microscopy (CLSM). After 3 hours of incubation, CH–PCL NPs appeared as fluorescent nanodots with a uniform distribution in the cytoplasm and the nucleus (Fig. 3). In the analogous cellular distribution, we have observed in our previous study on the uptake of polyelectrolyte nanocomplexes (PECs) on CML cells11 and we previously described that the particle size could influence their uptake modality and the accessibility of IM to cytosolic and/or nuclear pools of BCR-ABL.9,11The cellular uptake efficacy of IM–CH loaded PCL NPs was compared with IM alone, used as the single agent, after 1, 2, 3 and 4 hours in culture. It can be seen in Fig. 4 that the IM–CH loaded PCL NPs revealed enhanced cellular uptake for KU812 and C13895 cells compared with IM free in the medium. It can be seen that IM–CH loaded PCL NPs demonstrated much higher cellular efficiency that the drug only.
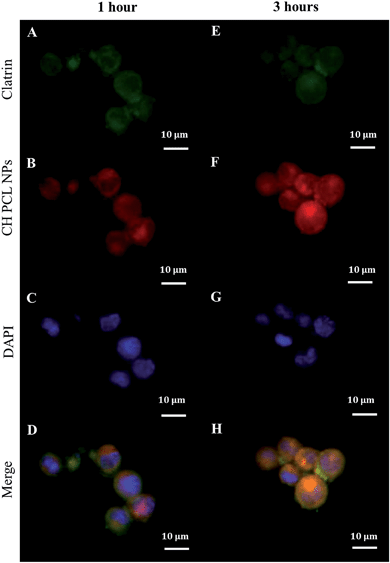
For any delivery system, understanding the initial way of internalization is the first step in achieving optimized drug delivery. In this regard, we previously described that the initial uptake of IM-loaded polyelectrolyte microcapsules (3 μm of diameter) was principally nuclear in CML cells.9 In contrast, nanoscaled PECs (250 nm) were internalized by a clathrin-mediated endocytosis mechanism.11 This disagreement could reflect the typical morphological features of CML stem/myeloid cells, which have a condensed cytoplasm and a large nucleus (Fig. 3).34,35 It seems plausible that the uptake of big particles could be facilitated by fusion between the outer plasma membrane and the perinuclear envelope of CML cells through macropinocytosis/phagocytosis;36 while nanoparticles can be favorably internalized via caveolin/clathrin-mediated endocytosis mechanisms.37–40 NPs larger than 20–40 nm are internalized by endocytosis caveolin-mediated, while NPs with a variable shape and size are internalized by clathrin-mediated endocytosis mechanisms.41,42 Our CH–PCL NPs have an average diameter of 247 nm and we guessed clathrin-mediated endocytosis as an accepted internalization mechanism. Our hypothesis was confirmed by observing after 1 hour of CH–PCL NP incubation inside the cytoplasm, a polarized colocalization (Fig. 5D and ESI Fig. S6D†) of green clathrin light chain (Fig. 5A and ESI Fig. S6A†) and red CH–PCL NPs (Fig. 5B and ESI Fig. S6B†) and after 3 hours a redistribution of clathrin inside the cells was evident (Fig. 5E–H and ESI Fig. S6E–H†). These results suggested the quick induction of clathrin vesicles at the outer plasma membrane in reply to CH–PCL NP incubation, and their rapid redistribution in specific subcellular compartments.
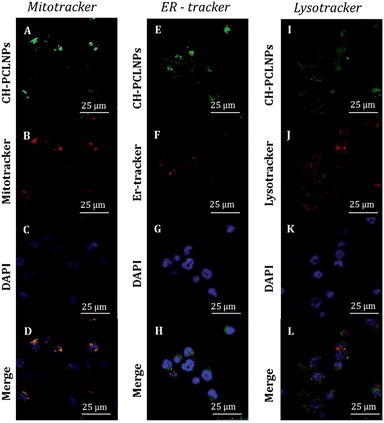
As shown in Fig. 6 and in ESI S7,† NPs were principally transported to mitochondria and lysosome, as evident by high colocalization (yellow present in the merge channel of CLSM images of Fig. 6D and L and in ESI S7D and L†) of green fluorescence CH-FITC PCL NPs and red fluorescence of MitoTracker and Lysotracker markers. In opposition, low colocalization with red fluorescence of ERtracker was observed, and this indicates that the NPs are not typically localized within endoplasmic reticulum. In particular, in ESI Fig. S8† a quantitative colocalization analysis between PCL NPs and LysoTracker, MitoTracker and ER-Tracker for KU812 leukemic cells (ESI Fig. S8A†) and C13895 healthy cells (ESI Fig. S8B†) is shown. The coefficient of correlation (CC, typically in the range of −1 to 1, where 1 means the perfect overlap, and 0 means random distribution) between PCL NPs and LysoTracker or MitoTracker was around 0.61 ± 0.02 and 0.67 ± 0.02 respectively, for KU812 leukemic cells and this analysis confirmed the colocalization. In contrast, CC between PCL NPs and ER-Tracker was around 0.12 ± 0.02 confirming low colocalization.
A common characteristic of nanoparticle-based drug delivery systems is the rapid internalization and intracellular localization into acid endosomes/lysosomes.43–46 Due to this mutual pathway of cellular uptake, there has been important interest in methods to engineer acid-triggered response from drug delivery systems for sustained intracellular release of therapeutics.
Apoptotic response and sustained BCR-ABL inhibition
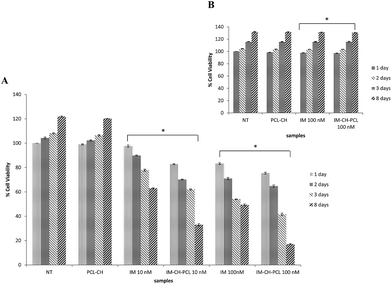
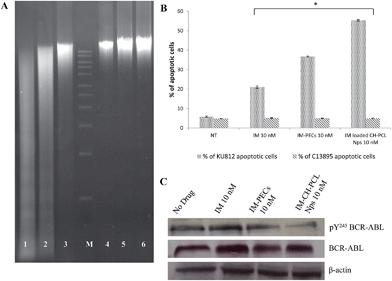
To explore the sustained killing of CML cells at nanomolar therapeutic dosage of the IM–CH loaded PCL NPs, KU812 leukemia cells and healthy C13895 cells were cultured with IM at different concentrations (10–100 nM) and IM loaded NPs with the same drug dose for 1, 2, 3 and 8 days. Cytotoxicity results were valued by MTT assay (Fig. 7). No hostile effects on healthy C13895 cells were detected by using free or encapsulated IM at 100 nM (Fig. 7B). For IM loaded CH–PCL NPs, we observed a dose-dependent antiproliferative effect. Leukemic cells incubated with the equivalent doses of free IM in the medium showed inhibition kinetics of proliferation much slower that declined with time (Fig. 7A). The amounts of IM loaded in CH–PCL NPs are considerably minor than the IC50 value than for KU812 cells which is between 100–300 nM, this clarified why apoptosis of KU812 cells was only marginally improved (20%) by using free IM at 10 nM (Fig. 8B) consistent with an incomplete inhibition of BCR-ABL phosphorylation/activation that can be cancelled up to 8 days (Fig. 8C), while total BCR-ABL protein levels remained unaffected.In contrast, IM–CH loaded PCL NPs enhanced the drug's kinetics and efficiency, producing a long-lasting inactivation of BCR-ABL activity that is mandatory to significantly promote leukemia cell death and growth inhibition (Fig. 7A and 8B). The durable inhibitory effect of IM–CH loaded PCL NPs could be due to their improved effectiveness in preventing BCR-ABL autophosphorylation compared with IM free or IM loaded PECs, without altering the total protein levels of BCR-ABL (Fig. 8C). The core–shell PCL NPs could provide to allow controlled release of IM and enhance its chemotherapeutic efficiency, combining the pH sensibility of CH and the slow degradation of PCL. Whereas the spontaneous intracellular degradation of PECs under physiological conditions, mediated by the presence of biodegradable dextran polyelectrolytes that were sensible to the action of intracellular proteases promote the IM release and the inhibition of BCR-ABL protein kinase activity until all polyelectrolytes were degraded.11
The supplementary signal of apoptosis induction by IM free and IM–CH loaded PCL NPs at the dose of 10 nM in KU812 leukemia cells was confirmed by DNA fragmentation (Fig. 8A). DNA fragmentation is largely considered as a characteristic feature of apoptosis. Fig. 8A clearly indicates the high DNA laddering pattern in KU812 leukemia cells treated with IM–CH loaded PCL NPs, liken to IM free.
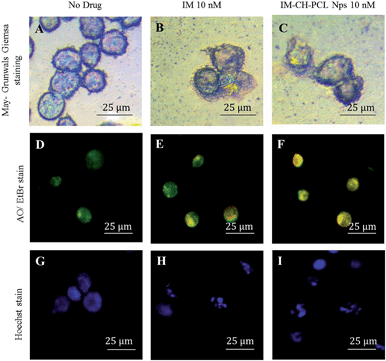
It is apparent that IM and IM–CH loaded PCL NPs could arrest the growth of CML cells and cause more important morphological changes, indicating an increased probability in cell death. The May-Grünwald–Giemsa staining of leukemic KU812 cells after treatment with IM free or loaded in PCL NPs (Fig. 9B and C) indicates a significant morphological evidence of apoptosis in the cell treated with IM–CH loaded PCL NPs. In addition, the fluorescent microscopy study on leukemic KU812 cells treated with IM free or loaded in PCL NPs was performed using AO/EtBr (Fig. 9D–F) and Hoechst nuclear stain (Fig. 9G–I). AO/EtBr staining cells observed as orange cells are apoptotic, while necrotic cells were observed as red colour due to their loss of membrane integrity.47 The Hoechst nuclear staining cells had intact round nucleus and had a normal morphology which emitted a weak blue fluorescence (Fig. 9G), additionally the cells treated with IM–CH loaded in PCL NPs exhibited bright blue colour emission concluding nuclear fragmentation with increased chromatin condensation leading to induction of apoptosis. In contrast, any evidence of apoptosis was observed in healthy C13895 cells (see ESI Fig. S9†).
Conclusions
In the present study, IM–CH loaded PCL nanoparticles were formulated revealing pH-responsive drug release from the chitosan and PCL shell, considerably enhanced by decreasing pH from 7.4 to 4.0. The effective inhibition of the activity of the BCR-ABL tyrosine kinase was assessed by Western Blot analysis for 8 days of incubation with the IM–CH loaded PCL NPs with 10 nM of drug and the same concentrations of IM free. Using free IM or loaded in PECs at 10 nM, we observed a partial/intermittent inhibition of BCR-ABL protein kinase activity that can be cancelled with time, as judged by an immunoprofiling with antibodies against phospho-tyrosine BCR-ABL and its total protein levels. Conversely, by using IM–CH loaded PCL NPs to reach a final 10 nM drug concentration in vitro, KU812 cell viability was irreversibly blocked indicating that IM loaded in a core–shell structure improved the drug's kinetics and efficacy, combining the pH sensibility of CH and the slow degradation of PCL, at single cell level consistent with a long-lasting inactivation of BCR-ABL autokinase activity that is mandatory to promote cell death. This system offers an improved alternative for the current CML therapies by reducing the dose of IM required to reach therapeutic efficacy by using single administration as opposed to multiple doses.Acknowledgements
This study was supported by MAAT – Nanotecnologie molecolari per la salute dell'uomo e l'ambiente (PON R&C 2007–2013, project's code PON02_00563_3316357). No writing assistance was utilized in the production of this manuscript. The authors have no competing interests to disclose.Notes and references
- N. Sharma, H. Dua and D. Rosha, J. Assoc. Physicians India, 2012, 60, 47 Search PubMed.
- C. Lin and Y. Li, Cancer Cell Int., 2013, 13, 13 CrossRef CAS PubMed.
- A. Bennour, I. Ouahchi, B. Achour, M. Zaier, Y. B. Youssef, A. Khelif, A. Saad and H. Sennana, Med. Oncol., 2013, 30, 348 CrossRef PubMed.
- D. L. Barnes and J. V. Melo, Cell Cycle, 2006, 5, 2862 CrossRef CAS.
- D. S. Krause and R. A. Van Etten, N. Engl. J. Med., 2005, 353(2), 172 CrossRef CAS PubMed.
- P. le Coutre, E. Tassi and M. Varella-Garcia, Blood, 2000, 95, 1758 CAS.
- H. G. Jørgensen and T. L. Holyoake, Biochem. Soc. Trans., 2007, 35(5), 1347 CrossRef PubMed.
- S. Y. Shieh, M. Ikeda, Y. Taya and C. Prives, Cell, 1997, 91, 325 CrossRef CAS.
- I. E. Palamà, S. Leporatti, E. De Luca, C. Gambacorti-Passerini, N. Di Renzo, M. Maffia, R. Rinaldi, G. Gigli, R. Cingolani and A. M. L. Coluccia, Nanomedicine, 2010, 5, 4195 CrossRef PubMed.
- I. E. Palamà, M. Musarò, A. M. L. Coluccia, S. D'Amone and G. Gigli, J. Drug Delivery, 2011, 1, 1 CrossRef PubMed.
- I. E. Palamà, A. M. L. Coluccia and G. Gigli, Nanomedicine, 2013 DOI:10.2217/nnm.13.147.
- W. J. Stark, Angew. Chem., 2011, 50, 1242 CrossRef CAS PubMed.
- A. D. Dinsmore, M. F. Hsu, M. G. Nikolaides, M. Marquez, A. R. Bausch and D. A. Weitz, Science, 2002, 298, 1006 CrossRef CAS PubMed.
- S. Mandal, M. Sathish, G. Saravanan, K. K. R. Datta, Q. Ji, J. P. Hill, H. Abe, I. Honma and K. Ariga, J. Am. Chem. Soc., 2010, 132, 14415 CrossRef CAS PubMed.
- Y. Li, X. Li, Y. S. Wong, T. Chen, H. Zhang, C. Liu and W. Zheng, Biomaterials, 2011, 32, 9068 CrossRef CAS PubMed.
- R. Haag and F. Kratz, Angew. Chem., 2006, 45, 1198 CrossRef CAS PubMed.
- A. Nori and J. Kopecek, Adv. Drug Delivery Rev., 2005, 57, 609 CrossRef CAS PubMed.
- S. W. Choi, Y. Zhang and Y. Xia, Angew. Chem., 2010, 49, 7904 CrossRef CAS PubMed.
- R. Guillet-Nicolas, A. Popat, J. L. Bridot, G. Monteith, S. Z. Qiao and F. Kleitz, Angew. Chem., 2013, 52(8), 2318 CrossRef CAS PubMed.
- Y. Li, W. Xiao, K. Xiao, L. Berti, J. Luo, H. P. Tseng, G. Fungand and K. S. Lam, Angew. Chem., 2012, 51, 2864 CrossRef CAS PubMed.
- K. Riehemann, S. W. Schneider, T. A. Luger, B. Godin, M. Ferrari and H. Fuchs, Angew. Chem., 2009, 48, 872 CrossRef CAS PubMed.
- Y. Zhu, W. Meng, H. Gao and N. Hanagata, J. Phys. Chem. C, 2011, 115, 13630 CAS.
- J. L. Wu, F. Qin, F. Y. F. Chan, G. Cheng, H. Li, Z. Lu and R. Chen, Mater. Lett., 2010, 64, 287 CrossRef CAS PubMed.
- Y. Wang, Y. Yan, J. Cui, L. Hosta-Rigau, J. K. Heath, E. C. Nice and F. Caruso, Adv. Mater., 2010, 22, 4293 CrossRef CAS PubMed.
- M. D. Bhavsar and M. M. Amiji, AAPS PharmSciTech, 2008, 9, 288 CrossRef CAS PubMed.
- D. Schmaljohann, Adv. Drug Delivery Rev., 2006, 58, 1655 CrossRef CAS PubMed.
- P. Le Coutre, L. Mologni and L. Cleris, J. Natl. Cancer Inst., 1991, 91, 163 CrossRef PubMed.
- E. M. Manders, J. Stap, G. J. Brakenhoff, R. van Driel and J. A. Aten, J. Cell Sci., 1992, 103, 857 CAS.
- Q. Li, A. Lau, T. J. Morris, L. Guo, C. B. Fordyce and E. F. Stanley, J. Neurosci., 2004, 24, 4070 CrossRef CAS PubMed.
- E. M. Manders, F. J. Verbeek and J. A. Aten, J. Microsc., 1993, 169, 375 CrossRef PubMed.
- M. A. Silver and M. P. Stryker, J. Neurosci. Methods, 2000, 94, 205 CrossRef CAS.
- S. V. Costes, D. Daelemans, E. H. Cho, Z. Dobbin, G. Pavlakis and S. Lockett, Biophys. J., 2004, 86, 3993 CrossRef CAS PubMed.
- H. Zhang, C. Wang, B. Chen and X. Wang, Int. J. Nanomed., 2012, 7, 242 Search PubMed.
- M. Savona and M. Talpaz, Nat. Rev. Cancer, 2008, 8, 341 CrossRef CAS PubMed.
- M. Deininger, E. Buchdunger and B. J. Druker, Blood, 2005, 105, 2640 CrossRef CAS PubMed.
- R. Misra and S. K. Sahoo, Eur. J. Pharm. Sci., 2010, 39, 152 CrossRef CAS PubMed.
- E. B. Garon, L. Marcu, Q. Luong, O. Tcherniantchouk, G. M. Crooks and H. P. Koeffler, Leuk. Res., 2007, 31, 643 CrossRef CAS PubMed.
- I. A. Khalil, K. Kogure, H. Akita and H. Harashima, Pharmacol. Rev., 2006, 58, 32 CrossRef CAS PubMed.
- S. Mayor and R. E. Pagano, Nat. Rev. Mol. Cell Biol., 2007, 8, 603 CrossRef CAS PubMed.
- A. Verma and F. Stellacci, Small, 2010, 6, 12 CrossRef CAS PubMed.
- M. Ehrlich, W. Boll and A. Van Oijen, Cell, 2004, 118, 591 CrossRef CAS PubMed.
- L. Pelkmans and A. Helenius, Traffic, 2002, 3, 311 CrossRef CAS.
- J. Panyama and V. Labhasetwar, Adv. Drug Delivery Rev., 2003, 55, 329 CrossRef.
- S. Ganta, H. Devalapally, A. Shahiwala and M. Amiji, J. Controlled Release, 2008, 126, 187 CrossRef CAS PubMed.
- H. Kamada, Y. Tsutsumi, Y. Yoshioka, Y. Yamamoto, H. Kodaira, S. Tsunoda, T. Okamoto, Y. Mukai, H. Shibata, S. Nakagawa and T. Mayumi, Clin. Cancer Res., 2004, 10, 2545 CrossRef CAS.
- F. Kratz, U. Beyer, T. Roth, N. Tarasova, P. Collery, F. Lechenault, A. Cazabat, P. Schumacher, C. Unger and U. Falken, J. Pharm. Sci., 1998, 87, 338 CrossRef CAS PubMed.
- R. Vivek, R. Thangam, K. Muthuchelian, P. Gunasekaran, K. Kaveri and K. Kannan, Process Biochem., 2012, 47, 2410 CrossRef PubMed.
Footnote |
| † Electronic supplementary information (ESI) available. See DOI: 10.1039/c4md00348a |
| This journal is © The Royal Society of Chemistry 2015 |

