DOI:
10.1039/C4MD00223G
(Concise Article)
Med. Chem. Commun., 2015,
6, 192-201
Synthesis, structure–activity relationship, and mechanistic investigation of lithocholic acid amphiphiles for colon cancer therapy†
Received 28th May 2014 , Accepted 14th October 2014
First published on 15th October 2014
Abstract
We report a structure–activity relationship of lithocholic acid amphiphiles for their anticancer activities against colon cancer. We synthesized ten cationic amphiphiles, differing in nature of their cationic charged head groups, using lithocholic acid. We observed that anticancer activities of these amphiphiles against colon cancer cell lines are contingent on nature of the charged head group. The lithocholic acid-based amphiphile possessing a piperidine head group (LCA-PIP1) is ∼10 times more cytotoxic than its precursor. Biochemical studies revealed that enhanced activity of LCA-PIP1 compared to lithocholic acid is due to a greater activation of apoptosis. LCA-PIP1 induces sub G0 arrest and causes cleavage of caspases. A single dose of lithocholic acid–piperidine (LCA-PIP1) derivative is enough to reduce the tumor burden by 75% in a tumor xenograft model.
Introduction
Colon cancer is the third most malignant tumor type, involving uncontrolled growth of cells in the colon.1 Many small molecule and antibody-based therapeutics have been engineered and developed for cancer therapy to target this disease effectively.2 Apart from genetic reasons, prolonged high consumption of a western-type diet augments the risk of colon cancer in the majority of patients. An increased uptake of fatty diets requires extensive recirculation of bile acids for its digestion. Therefore, colon epithelial cells experience enhanced exposure to this high concentration of bile acids. Clinical studies have revealed elevated levels of fecal secondary bile acids in patients diagnosed with colon cancer.3 Therefore, bile acids are critical for pathogenesis of colon cancer progression and renewal of colon epithelium. Bile acids are COMPOUND LINKS
Read more about this on ChemSpider
Download mol file of compound
Explore further on Open PHACTScholesterol-derived amphiphile molecules that help in the absorption of fats and fat-soluble vitamins.4 Primary bile acids, like COMPOUND LINKS
Read more about this on ChemSpider
Download mol file of compound
Explore further on Open PHACTSchenodeoxycholic acid and COMPOUND LINKS
Read more about this on ChemSpider
Download mol file of compound
Explore further on Open PHACTScholic acid, are synthesized and secreted from the liver and get re-circulated via a portal system.5 Gut microflora convert these primary bile acids to secondary bile acids, lithocholic acid and COMPOUND LINKS
Read more about this on ChemSpider
Download mol file of compound
Explore further on Open PHACTSdeoxycholic acid, by de-hydroxylation.6 A high concentration of bile acids and their accumulation in the gut can induce apoptosis in the colon epithelium.7 Bile acid-induced cytotoxicity causes colon cancer progression by disrupting the balance between cell growth and apoptosis, and helps in the selection of bile acid-resistant colon cancer cells.8
Bile acids exercise their cytotoxic effect via different cellular mechanisms that are contingent on the structure, hydrophobicity, and stereochemistry of the bile acids.9 Glycine and taurine conjugated primary bile acids are the least toxic due to their low hydrophobicity, whereas unconjugated hydrophobic secondary bile acids are more cytotoxic.10 Diverse cellular mechanisms, including membrane disruptions, the role of PKC, MAPK pathways, and nuclear factor-kappa β activation, have been proposed for the toxicity of bile acids.11 Stenson and coworkers suggested an enantiospecific bile acid-mediated apoptosis in colon cancer cells.12 Natural bile acids induce apoptosis, escalated cellular detachment and enhanced caspases-3 and -9 cleavage as compared to synthetic enantiomers of bile acids in HT-29 and HCT-116 cells.13
Cationic lipid amphiphiles and their drug conjugates have been explored for potential biological activities as anticancer and antibacterial candidates as they have the ability to interact with cellular membranes effectively due to their charged hydrophobic character.14 Chhikara et al. synthesized lipophilic derivatives of the anticancer drug COMPOUND LINKS
Read more about this on ChemSpider
Download mol file of compound
Explore further on Open PHACTSdoxorubicin for anticancer therapy15 and COMPOUND LINKS
Read more about this on ChemSpider
Download mol file of compound
Explore further on Open PHACTSemtricitabine-based prodrugs for enhanced anti-HIV activity.16 Banerjee and co-workers synthesized haloperidol-conjugated cationic lipids17 and lipids targeting estrogen receptors for targeted delivery to cancer cells.18 Sreekanth et al. synthesized charged bile acid tamoxifen conjugates for breast cancer therapy and revealed that the conjugation of multiple COMPOUND LINKS
Read more about this on ChemSpider
Download mol file of compound
Explore further on Open PHACTStamoxifen molecules to cationic COMPOUND LINKS
Read more about this on ChemSpider
Download mol file of compound
Explore further on Open PHACTScholic acid induces membrane perturbations and enhanced activity.19 We have recently shown that the conjugation of single charged head groups on bile acids induces favorable interactions with model membranes and cancer cells for their cytotoxicity, whereas multi-headed amphiphiles do not interact with mammalian cells due to an enhanced hydration barrier between the amphiphiles and cellular membranes.20
In this paper, we hypothesize that anticancer activity of amphiphiles is contingent on nature of single charged head group on a lithocholic acid amphiphile. Therefore, we synthesized ten lithocholic acid-based amphiphiles differing in nature of the charged head group attached to hydroxyl group of lithocholic acid. Anticancer activities of these amphiphiles were investigated against three human colon cancer cell lines. Annexin-FITC and cell cycle analysis were performed to study the mechanism of cellular death by these amphiphiles. We then evaluated in vivo anticancer potential of the amphiphiles in tumor xenograft models, and analyzed the mechanism of activity in tumor regression.
Results and discussion
We synthesized and characterized ten amphiphiles (Fig. 1) differing in the charged head group on lithocholic acid (LCA). All the lithocholic acid amphiphiles were synthesized and characterized (except LCA-PPZ1, LCA-MOR1 and LCA-TMOR1) as described previously.20 Amphiphiles LCA-PPZ1, LCA-MOR1 and LCA-TMOR1 were synthesized through the reaction of a chloroacetyl derivative of lithocholic acid methyl ester with the corresponding amine, and purified by column chromatography as described in the experimental section. All the synthesized amphiphiles were purified and characterized by 1H-NMR, 13C-NMR, mass spectrometry, and HPLC (Waters, RI-410).  |
| | Fig. 1 Molecular structures of the lithocholic acid amphiphiles synthesized and studied. | |
Anticancer activities in colon cancer cell lines (MTT assay)
We examined the cytotoxic effect of these amphiphiles against three human colon cancer cell lines (HCT-8, HCT-116 and DLD-1) after 48 h. We discovered that introduction of a soft charge ammonium head group (LCA-AMM1) on lithocholic acid enhances its cytotoxicity by 3–6 fold (Fig. 2, Table 1). Other soft charge modifications on lithocholic acid like piperazine (LCA-PPZ1), morpholine (LCA-MOR1) and thiomorpholine (LCA-TMOR1) are not effective in enhancing the cytotoxic potential of lithocholic acid (Fig. 2, Table 1). Further quaternization of lithocholic acid with a trimethyl ammonium head group (LCA-TMA1) lowers its cytotoxicity compared to ammonium head group amphiphiles. Amphiphile LCA-PIP1 bearing a piperidine head group is most active with an IC50 value of ∼12–15 μM in HCT-116, HCT-8 cells and DLD-1 cells (Fig. 2). Amphiphile LCA-PIP1 is nearly 6–10 fold more cytotoxic than LCA, and 3-fold more effective than LCA-AMM1 (Table 1). Structure–activity studies revealed that aliphatic 6-membered head group-based amphiphile LCA-PIP1 is 2–3 fold more cytotoxic than aromatic head group-based amphiphile LCA-PYR1 and the 5-membered aliphatic-derived amphiphile LCA-PYRO1. The introduction of a hydrophobic 6-membered piperidine head group allows efficient interactions with intra-cellular targets, making it more effective. Therefore, the structure–activity studies conclude that anticancer activities of amphiphiles are strongly contingent on nature of head group. As bile acids are known to bind with cell membrane TGR5 receptors or nuclear FXR receptors, nature of charged head group may help in preferential interactions of these amphiphiles with cell surface membrane receptors or intracellular receptors. We believe that nature of head group may also help in preferential activation of death receptors or intracellular proteins responsible for apoptosis, as these amphiphiles induce apoptosis by intrinsic and extrinsic pathways as described later.  |
| | Fig. 2 (a–f) Structure–activity investigation showing cell viability with different amphiphiles in three colon cancer cell lines: (a and b) HCT-116, (c and d) DLD-1, and (e and f) HCT-8. All experiments have been performed at least two times in four replicates and the values reported are mean ± SD. | |
Table 1 IC50 of lithocholic acid amphiphiles againt three colon cancer cell lines, HCT-116, DLD-1 and HCT-8a
Selectivity over normal cells
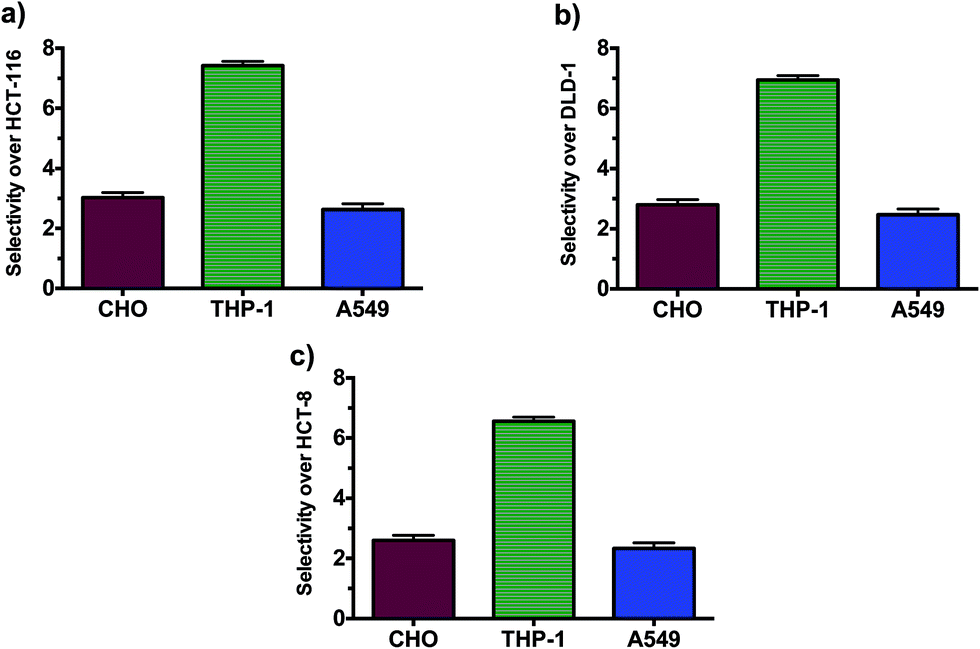
We then studied the selectivity of the most potent amphiphile LCA-PIP1 over normal cells, and investigated the toxicity of LCA-PIP1 against macrophages (THP-1), CHO, A549, and red blood cells. As shown in Fig. 3, LCA-PIP1 is five times less toxic in normal macrophages than in colon cancer cells and ∼3-fold more selective for colon cancer cells over CHO cells. LCA-PIP1 is also ∼2-fold more selective over lung cancer A549 cells (Fig. 3). As these are charged amphiphiles, we investigated the membrane disruptive character of LCA-PIP1 and performed a hemolytic assay. LCA-PIP1 was found to be non-hemolytic against RBCs with MHC50 > 1 mM.20b These results suggest that LCA-PIP1 is inducing the apoptotic machinery in colon cancer cells for its activity, and does not disrupt the cellular membranes in the manner of a detergent. We therefore investigated the mechanism of cell death induced by LCA-PIP1 in colon cancer cells.  |
| | Fig. 3 Selectivity of LCA-PIP1 for different colon cancer cell lines over CHO, THP-1 and A549 cell lines: (a) HCT-116, (b) DLD-1 and (c) HCT-8. | |
Effect of ester and amide linkages
In LCA-PIP1, piperidine head group is conjugated to lithocholic acid through an ester linkage. To explore the effect of linkage between piperidine head group and lithocholic acid, we synthesized an amide derivative of LCA-PIP1 and compared the cytotoxicity of ester and amide derivatives of LCA-PIP1 against three colon cancer cell lines (Fig. S1, ESI†). MTT studies suggested that ester derivative of LCA-PIP1 is more effective than amide derivative of LCA-PIP1 (Fig. S1, ESI†), which might be due to easy cleavage of piperidine head group for enhanced activity. Colony forming assay
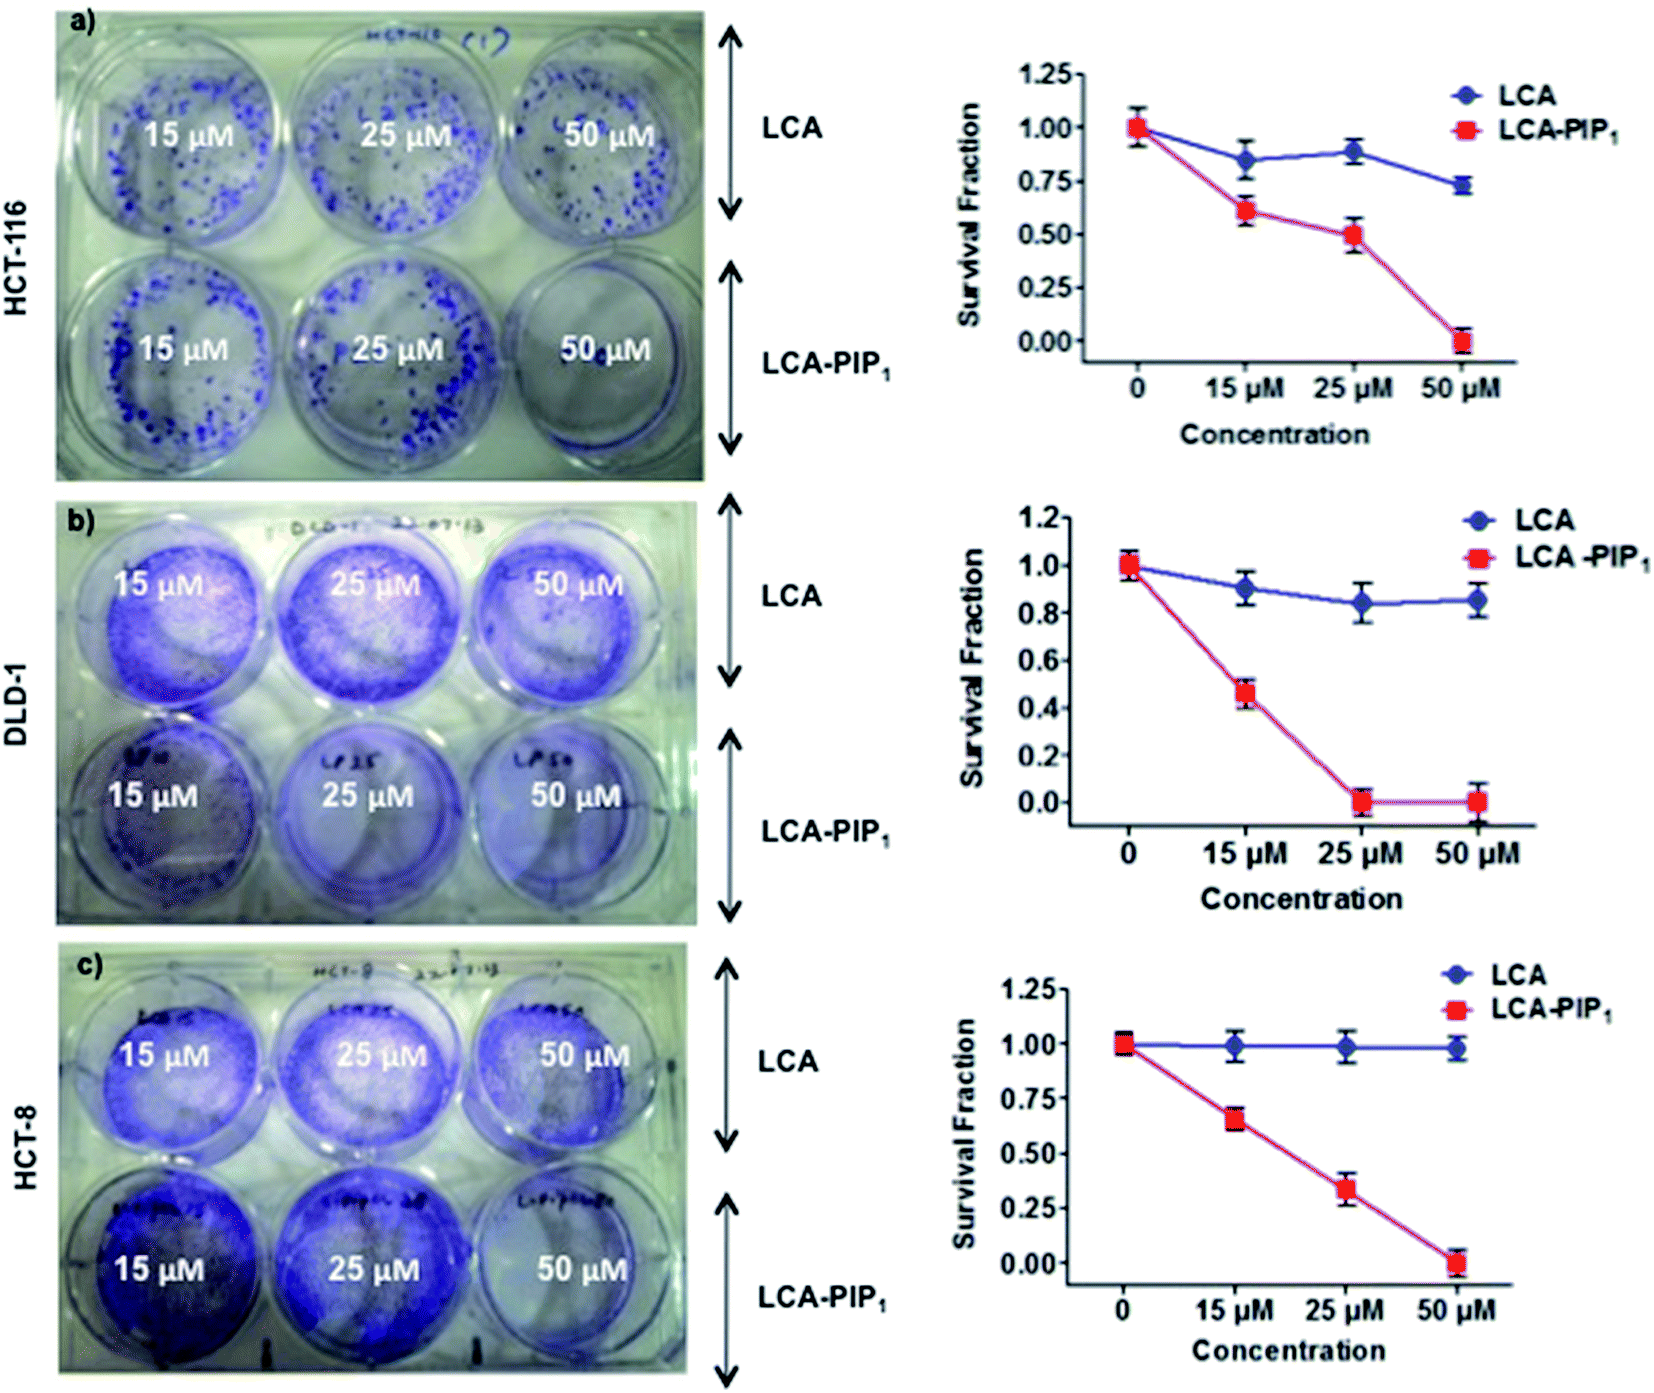
We then studied the colony-forming abilities of colon cancer cells on treatment with LCA and LCA-PIP1 at different concentrations. The treatment of these cells with LCA does not inhibit colony formation at 15, 25 and 50 μM concentrations, whereas LCA-PIP1 on treatment at 15 μM induces ∼50% inhibition in HCT-116 cells (Fig. 4a). We did not observe any colonies on treatment with 50 μM LCA-PIP1. Similarly, treatment with LCA-PIP1 inhibits colony formation in DLD-1 and HCT-8 colon cancer cells (Fig. 4b and c). These studies show that introduction of a single piperidine head group on LCA makes it highly active and able to inhibit the colony-forming properties of cancer cells.  |
| | Fig. 4 Colony forming assay showing effect of LCA and LCA-PIP1 at different concentrations on the colony forming abilities and survival fraction of (a) HCT-116, (b) DLD-1, and (c) HCT-8 cells. All experiments were carried out two times in duplicate and the survival fraction values are reported as mean ± SD. | |
Cell cycle and Annexin-FITC analysis
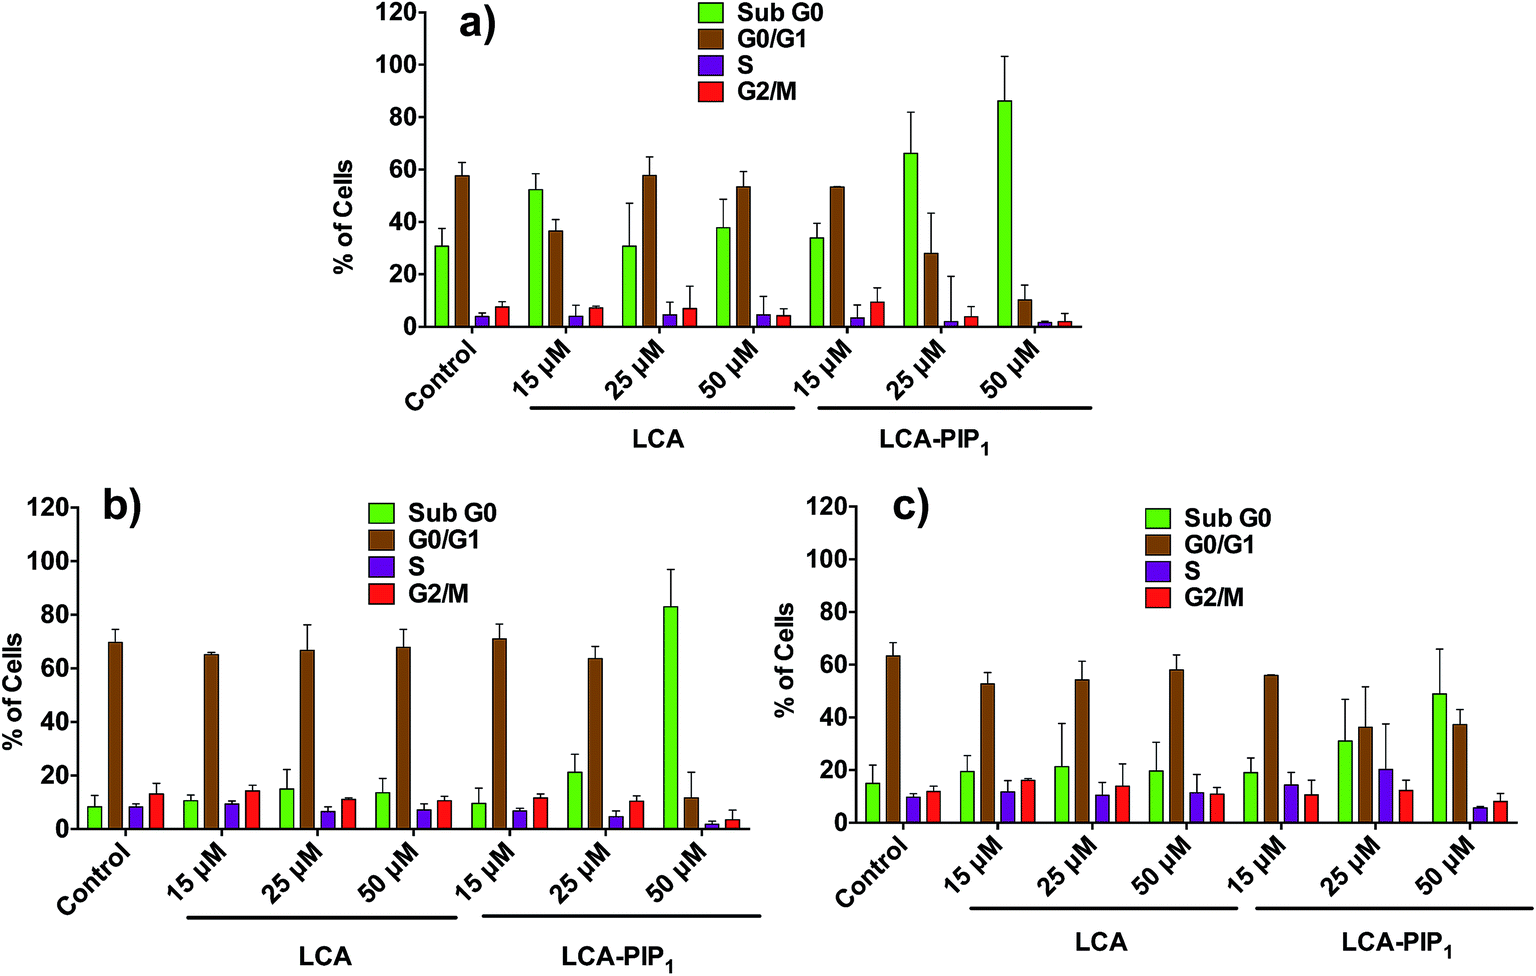
We then performed cell cycle analysis to know the fate of cells in different phases of cell cycle on treatment with LCA and LCA-PIP1 at different concentrations for 48 h. Cell cycle analysis revealed that LCA alone does not induce any concentration dependent change in cell cycle in HCT-116, DLD-1 and HCT-8 cells, whereas treatment with LCA-PIP1 arrests cells in sub-G0 phase and does not allow them to enter in G0-G1 phase (Fig. 5). LCA-PIP1 at 50 μM induces ∼80% arrest in sub-G0 phase in HCT-116 and DLD-1 cells, and ∼40% arrest in HCT-8 cells. To determine whether the arrest in cell cycle phase by LCA-PIP1 induces apoptosis, we probed LCA and LCA-PIP1 treated HCT-116 cells using an Annexin-V-FITC apoptosis assay. As shown in Fig. 6, treatment with LCA-PIP1 induces 1.3 and 2.0-fold increases in apoptotic cells at 25 μM and 50 μM concentrations compared to LCA. LCA-PIP1 at 50 μM induces ∼40% cells to undergo early apoptosis and ∼26% cells to undergo late apoptosis. Therefore, cell cycle and Annexin-FITC studies show that introduction of a piperidine head group on LCA in case of LCA-PIP1 enhances sub-G0 arrest of cells and induces apoptosis.  |
| | Fig. 5 Cell cycle analysis of (a) HCT-116, (b) DLD-1, and (c) HCT-8 cells treated with LCA and LCA-PIP1 at concentrations of 15, 25 and 50 μM for 48 h, showing enhanced sub-G0 arrest on treatment with LCA-PIP1. All experiments were performed in triplicate, and values are reported as mean ± SD. | |
In vivo anticancer activities
HCT-116 nude mice colon tumor model. To explore the in vivo potential of LCA-PIP1, we studied the anticancer activity of LCA-PIP1 in a xenograft tumor model in nude mice. We used HCT-116 cancer cells in nude mice to develop tumors on the flank. To test the potential of LCA-PIP1 in larger tumor volumes, we developed tumors of ∼750 mm3, as compared to the ∼100–200 mm3 tumors usually reported in studies. A single injection of 20 mg kg−1 body weight is able to reduce tumor volume by 75% as shown in Fig. 7. We observed a more than 50% decrease in tumor weight after 6 days of treatment. These studies show that the introduction of a single piperidine head group on LCA makes it a highly potent anticancer agent.  |
| | Fig. 7 In vivo anticancer effect of LCA-PIP1 in HCT-116 tumor models in nude mice: (a) representative excised tumors from control and treated groups; (b) change in tumor volume on treatment with LCA-PIP1; (c) change in tumor weight after treatment with LCA-PIP1. | |
In vitro and in vivo mechanism
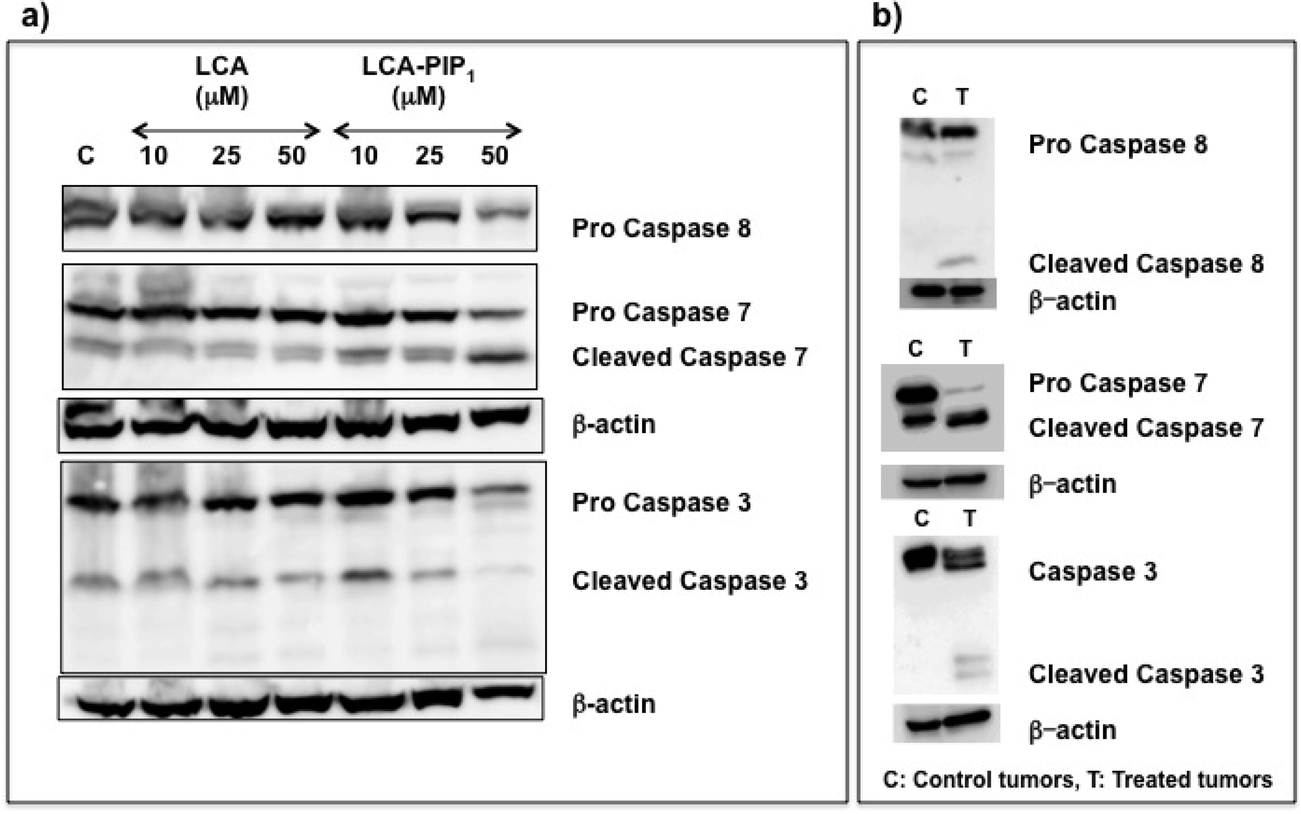
To unravel the mechanism of cell death, we performed western blot studies in HCT-116 cells on treatment with LCA and LCA-PIP1 to see the expression of caspases required for apoptosis. Western blot studies showed increased expression of pro-caspase 8 on LCA-PIP1 treatment at low concentrations, and a decrease at high concentration (Fig. 8a). We observed increased levels of cleaved caspase-7 and caspase-3 on LCA-PIP1 treatment. To determine the mechanism involved in tumor regression upon treatment with LCA-PIP1, we harvested tumors from mice and subjected them to western blot analysis for the expression of caspases (Fig. 8b). We observed elevated expression of activated (cleaved) caspases 3, 7 and 8 in LCA-PIP1 treated tumors compared to vehicle control group (Fig. 8b). Induction of apoptotic pathway leads to a cascade of events, releasing various apoptotic mediators from mitochondria, and activating caspase-3 and caspase-7 required for apoptosis.21,22 Caspase 3 is critical for apoptosis by intrinsic apoptotic pathway and activation of caspase 8 is critical for the extrinsic apoptotic pathway.23 Therefore, these studies show that amphiphile LCA-PIP1 induces tumor regression through activation of intrinsic and extrinsic pathways.  |
| | Fig. 8 Representative western blots of lysates of (a) LCA- and LCA-PIP1-treated HCT-116 cells and (b) control and LCA-PIP1-treated tumors, showing the activation of caspases. | |
Conclusions
In summary, we have shown that conjugation of charged head groups on lithocholic acid modulates their interactions with cancer cells. Anticancer potential of these amphiphiles is contingent on nature of charged head groups. The piperidine head group-based amphiphile LCA-PIP1 is the most active compared to LCA suggesting effective intracellular interactions with targets responsible for inducing apoptosis. Annexin-FITC studies and cell cycle studies suggest induction of apoptosis and sub-G0 cell cycle arrest by LCA-PIP1. A single dose of LCA-PIP1 could induce ∼75% reduction in tumor volume and ∼50% reduction in tumor weight for highly aggressive HCT-116 tumor models. Western blot studies on tumors indicated that activation of caspases was responsible for inducing apoptosis. As these molecules are based on bile acids, further modification of these molecules would have future applications in treatment of different gastrointestinal cancers. Due to amphiphilic character of these molecules, formation of nanoparticles and their delivery can also be explored. Therefore, engineering of these lithocholic acid amphiphiles opens up a new class of molecules as therapeutic agents for colon cancer. Experimental section
Materials and methods
All the chemicals and solvents used are of ACS grade. Lithocholic acid (LCA), COMPOUND LINKS
Read more about this on ChemSpider
Download mol file of compound
Explore further on Open PHACTSpropidium iodide and Annexin-FITC kit were purchased from Sigma-Aldrich. All antibodies were purchased from Cell Signaling, except β-actin, which was purchased from Sigma. MTT and ECL kits were purchased from Amersham. Cell culture media, trypsin, and antibiotics were purchased from Hyclone, USA or Sigma-Aldrich. Plasmocin prophylactic and plasmocin treatment were purchased from Invivogen. All synthesized compounds were purified using Combi-flash or glass chromatography using 230–400 mesh size silica gel. 1H and 13C NMR spectra were recorded using a Bruker 400 MHz spectrometer. Chemical shifts (δ) are reported in ppm with COMPOUND LINKS
Read more about this on ChemSpider
Download mol file of compound
Explore further on Open PHACTStetramethyl silane as the internal standard. High-resolution mass spectra were measured on LC-MS/MS (AB-SCIEX TRIPLE TOF-5600) and MALDI (AB SCIEX TOF/TOF 5800) mass spectrometers. General procedure for the synthesis of cationic amphiphiles
Lithocholic acid amphiphiles were synthesized (except LCA-PPZ1, LCA-MOR1 and LCA-TMOR1) from the chloroacetyl derivative of lithocholic acid methyl ester as described previously.20 Amphiphiles LCA-PPZ1, LCA-MOR1 and LCA-TMOR1 were synthesized from the chloroacetyl derivative of lithocholic acid methyl ester20 as described below. Amphiphile LCA-PPZ1. Piperazine (86 mg, 1 mmol) was added to a solution of the chloroacetyl derivative of lithocholic acid methyl ester (200 mg, 0.42 mmol) in ethyl acetate (5 mL) and COMPOUND LINKS
Read more about this on ChemSpider
Download mol file of compound
Explore further on Open PHACTSK2CO3 in a sealed tube and the reaction mixture was refluxed for 36 h. After completion of the reaction, the reaction mixture was filtered to remove COMPOUND LINKS
Read more about this on ChemSpider
Download mol file of compound
Explore further on Open PHACTSK2CO3. Solvent was removed by evaporation, and the product was purified by column chromatography using COMPOUND LINKS
Read more about this on ChemSpider
Download mol file of compound
Explore further on Open PHACTSEtOAc : pet. ether (20 : 80) to give a colorless solid (185 mg, 85%; Rf = 0.40, COMPOUND LINKS
Read more about this on ChemSpider
Download mol file of compound
Explore further on Open PHACTSEtOAc : pet. ether, 50 : 50); 1H-NMR (COMPOUND LINKS
Read more about this on ChemSpider
Download mol file of compound
Explore further on Open PHACTSCDCl3, 400 MHz) δ: 0.63 (s, 3H, –CH3), 0.91 (s, 6H, 2 × CH3), 0.99–2.23 (steroid), 2.67 (s, 4H, –N–(CH2)2), 3.19 (m, 2H, –CO–CH2–N–), 3.66 (s, 3H, –CO–OCH3), 4.78 (s, 1H, –O–CH); 13C-NMR (COMPOUND LINKS
Read more about this on ChemSpider
Download mol file of compound
Explore further on Open PHACTSCDCl3, 100 MHz) δ: 12.04, 18.28, 20.84, 23.30, 24.19, 26.32, 26.66, 27.01, 28.19, 29.70, 31.23, 34.60, 35.01, 35.79, 40.13, 40.41, 42.74, 51.49, 52.68, 55.99, 56.48, 74.92, 169.59, 174.78; MALDI mass: m/z (C31H52N2O4) calculated 516.39; found (M)+ 517.402. Amphiphile LCA-MOR1. To a solution of the chloroacetyl derivative of lithocholic acid methyl ester (250 mg, 0.53 mmol) in ethyl acetate (5 mL) was added COMPOUND LINKS
Read more about this on ChemSpider
Download mol file of compound
Explore further on Open PHACTSK2CO3 and morpholine (95 mg, 1.1 mmol) in a sealed tube and the mixture was refluxed for 48 h. After completion of the reaction, COMPOUND LINKS
Read more about this on ChemSpider
Download mol file of compound
Explore further on Open PHACTSK2CO3 was removed by filtration and solvent was removed by evaporation. The final product was purified by column chromatography using COMPOUND LINKS
Read more about this on ChemSpider
Download mol file of compound
Explore further on Open PHACTSEtOAc : pet. ether (20 : 80) to give a colorless solid (246 mg, 90%; Rf = 0.35, COMPOUND LINKS
Read more about this on ChemSpider
Download mol file of compound
Explore further on Open PHACTSEtOAc : pet. ether, 50 : 50); 1H-NMR (COMPOUND LINKS
Read more about this on ChemSpider
Download mol file of compound
Explore further on Open PHACTSCDCl3, 400 MHz) δ: 0.63 (s, 3H, –CH3), 0.92 (s, 6H, 2 × CH3), 0.99–2.38 (steroid), 2.59 (s, 4H, –N–(CH2)2), 3.18 (m, 2H, –CO–CH2–N–), 3.66 (s, 3H, –CO–OCH3), 3.76 (t, J = 4.4, 4H, –N–(CH2)2), 4.78 (s, 1H, –O–CH); 13C-NMR (COMPOUND LINKS
Read more about this on ChemSpider
Download mol file of compound
Explore further on Open PHACTSCDCl3, 100 MHz) δ: 12.04, 18.28, 20.84, 23.31, 24.19, 26.32, 26.67, 27.01, 28.19, 29.70, 31.01, 31.07, 32.25, 34.60, 35.00, 35.38, 35.79, 40.14, 40.43, 41.91, 42.74, 51.50, 53.25, 56.00, 56.50, 59.97, 66.75, 74.97, 74.92, 169.50, 174.78; MALDI mass: m/z (C31H51NO5) calculated 517.38; found (M)+ 518.377. Amphiphile LCA-TMOR1. A reaction mixture of chloroacetyl derivative of lithocholic acid methyl ester (300 mg, 0.64 mmol) in ethyl acetate (6 mL), COMPOUND LINKS
Read more about this on ChemSpider
Download mol file of compound
Explore further on Open PHACTSK2CO3 (300 mg) and thiomorpholine (124 mg, 1.2 mmol) was refluxed in a sealed tube for 40 h. Solid COMPOUND LINKS
Read more about this on ChemSpider
Download mol file of compound
Explore further on Open PHACTSK2CO3 was removed from reaction mixture and solvent was removed by evaporation. The product was purified by column chromatography using COMPOUND LINKS
Read more about this on ChemSpider
Download mol file of compound
Explore further on Open PHACTSEtOAc : pet. ether (20 : 80) to give a colorless solid (310 mg, 91%; Rf = 0.62, COMPOUND LINKS
Read more about this on ChemSpider
Download mol file of compound
Explore further on Open PHACTSEtOAc : pet. ether, 50 : 50); 1H-NMR (COMPOUND LINKS
Read more about this on ChemSpider
Download mol file of compound
Explore further on Open PHACTSCDCl3, 400 MHz) δ: 0.63 (s, 3H, –CH3), 0.91 (s, 6H, 2 × CH3), 0.99–2.33 (steroid), 2.72 (s, 4H, –S–(CH2)2), 2.84 (d, J = 4.4, 4H, –N–(CH2)2) 3.20 (s, 2H, –CO–CH2–N–), 3.66 (s, 3H, –CO–OCH3), 4.77 (s, 1H, –O–CH); 13C-NMR (COMPOUND LINKS
Read more about this on ChemSpider
Download mol file of compound
Explore further on Open PHACTSCDCl3, 100 MHz) δ: 12.04, 18.27, 20.84, 23.31, 24.18, 26.32, 26.71, 27.00, 27.81, 28.18, 29.69, 31.01, 31.07, 3 32.28, 34.59, 35.00, 35.37, 35.79, 40.13, 40.44, 41.92, 42.74, 51.48, 54.53, 56.00, 56.49, 60.51, 74.94, 169.75, 174.74; MALDI Mass: m/z (C31H51NO4S) calculated 533.35; found (M)+ 534.284. Amide derivative of LCA-PIP1
The amino derivative of lithocholic acid was synthesized as described previously.24 The amide derivative of LCA-PIP1 was synthesized using the amino derivative of lithocholic acid (LCA-NH2) using a similar procedure to that published.20 Yield 80% (solid). 1H-NMR (COMPOUND LINKS
Read more about this on ChemSpider
Download mol file of compound
Explore further on Open PHACTSCDCl3, 400 MHz) δ: 0.62 (d, J = 5.6, 3H, –CH3), 0.90 (s, 6H, 2 × CH3), 0.99–2.37 (steroid), 3.39 (s, 3H, –N–CH3), 3.42 (m, 2H, –N–CH2), 3.65 (s, 3H, –CO–OCH3), 3.91 (m, 2H, –N–CH2), 4.69 (m, 2H, –CO–CH2–N–); 13C-NMR (COMPOUND LINKS
Read more about this on ChemSpider
Download mol file of compound
Explore further on Open PHACTSCDCl3, 100 MHz) δ: 12.03, 18.27, 20.16, 20.87 23.38, 23.64, 24.18, 26.27, 27.07, 28.16, 30.56, 32.75, 34.58, 35.37, 35.64, 40.00, 40.17, 42.73, 50.92, 51.46, 55.97, 56.62, 62.69, 71.84, 162.86, 174.86; MALDI Mass: m/z (C33H57N2O3)+ calculated 529.44; found (M)+ 529.431. Cell cultures
HCT-116, DLD-1, HCT-8, A549 and CHO cell lines were maintained as monolayers. HCT-116 cells in McCoy's medium, DLD-1 and HCT-8 cells in RPMI-1640 medium, and A549 and CHO cells in DMEM medium with 10% (v/v) fetal bovine serum, with antibiotics, were maintained at 37 °C in a humidified atmosphere with 5% COMPOUND LINKS
Read more about this on ChemSpider
Download mol file of compound
Explore further on Open PHACTSCO2. THP-1 cells were grown in DMEM medium and differentiated to adherent macrophages by adding COMPOUND LINKS
Read more about this on ChemSpider
Download mol file of compound
Explore further on Open PHACTSphorbol COMPOUND LINKS
Read more about this on ChemSpider
Download mol file of compound
Explore further on Open PHACTSmyristic acid (PMA). MTT studies were performed for anticancer activities of all amphiphiles in three different colon cancer cell lines. The cells were plated in 96 well plates at a density of 3–4 × 10³ cells per well for 24 h to allow adherence. The cells were treated at concentrations of 25, 50, 100, 150 and 200 μM of synthetic lithocholic acid amphiphiles for 48 h. MTT solution (25 μL of 5 mg mL−1) was added to the cells for incubation to produce formazan crystals. After 3 h of incubation, medium was replaced with 150 μL of COMPOUND LINKS
Read more about this on ChemSpider
Download mol file of compound
Explore further on Open PHACTSDMSO to lyse the cells. The absorbance of formazan crystals was recorded at 555 nm using a Spectramax M5 (Molecular Devices). Cell viability was then calculated using the equation [{A555 (treated cells) − background]/[A555 (untreated cells) − background}] × 100. Colony formation studies were performed with colon cancer cells on treatment with LCA and LCA-PIP1 at different concentrations. 200 cancer cells per well were plated in a 6-well plate. After adherence (24 h), cells were treated with different concentrations of LCA and LCA-PIP1. After 2 weeks, the cells were stained with COMPOUND LINKS
Read more about this on ChemSpider
Download mol file of compound
Explore further on Open PHACTScrystal violet and colonies were counted. From the number of colonies, we first calculated the plating efficacy (PE) from untreated samples as:
The number of colonies after treatment of cells, called the survival fraction, is calculated using following equation:
Cell cycle and Annexin-FITC analysis
In a 6-well plate, colon cancer cells at a density of ∼2 × 10⁵ cells per well were seeded. After 24 h, the cells were treated with amphiphiles for 48 h. Cells were trypsinized and collected by centrifugation after treatment. For cell cycle analysis, the cells were washed twice with cold PBS and fixed in 70% ice-cold COMPOUND LINKS
Read more about this on ChemSpider
Download mol file of compound
Explore further on Open PHACTSethanol. COMPOUND LINKS
Read more about this on ChemSpider
Download mol file of compound
Explore further on Open PHACTSEthanol was removed by washing the cells again with PBS and cells were treated with RNase (10 μL of 20 mg mL−1) at 37 °C for 1 h. Cells were stained with COMPOUND LINKS
Read more about this on ChemSpider
Download mol file of compound
Explore further on Open PHACTSpropidium iodide (50 μg mL−1) at room temperature for 20 min and counted by FACS (Becton Dickinson, Mountain View, CA). Annexin-FITC studies were performed using a kit from Sigma-Aldrich according to manufacturer's instructions. Cells were stained simultaneously with COMPOUND LINKS
Read more about this on ChemSpider
Download mol file of compound
Explore further on Open PHACTSFITC-labeled Annexin V (50 μg mL−1) and COMPOUND LINKS
Read more about this on ChemSpider
Download mol file of compound
Explore further on Open PHACTSpropidium iodide (100 μg mL−1) after their re-suspension in binding buffer and analyzed using a flow cytometer (Becton Dickinson). In vivo experiments
6 week old female nude mice were received from the Institutional Animal Facility and were allowed to acclimatize to facility conditions before any experimental procedure. All the protocols for animal experiments were approved by the Institutional Animal Ethical Committee of the National Institute of Immunology. Mycoplasma testing was performed in the cells to make sure that the cells were free of any sort of contamination. We injected 1.5 × 10⁶ HCT-116 cells per mouse in the right flank of each mouse to generate tumor models. Tumors became palpable after 7 days and we started measuring tumor sizes after the 10th day. Digital calipers were used for measuring tumor sizes throughout the study. Tumor volume was calculated using the formula: volume = 0.5 L × W2, where W = width of tumor, L = length of tumor. Once the tumors attained an average volume of ∼750 mm3, we divided the mice into two groups of 5 mice each. On the 19th day, we started treatment of the mice with either the vehicle control or amphiphile LCA-PIP1 at a dose of 20 mg kg−1 near the tumor sites. Tumor measurements were performed regularly after giving the treatment and eventually the mice were sacrificed on the 25th day. Western blot studies in cell lysates and tumor samples
Tumors were harvested from control and treated nude mice. These tumors were then subjected to homogenization using RIPA lysis buffer. The tumor lysates were loaded in equal concentration and then electro-transferred onto polyvinylidene fluoride membranes. Blots were then blocked with 5% non-fat dry milk (NFDM) dissolved in Tris-buffered saline containing 0.1% Tween 20 (TBST) for 2 h at room temperature. The blots were washed three times with TBST and incubated overnight at 4 °C, with specific primary antibodies in TBST containing 2% NFDM. The next day, the membranes were washed three times with TBST and incubated for 2 h at room temperature with secondary horseradish peroxidase conjugated anti-mouse or anti-rabbit IgG in TBST containing 2% NFDM. Detection was performed using enhanced chemiluminescence (ECL) reagent and a bioluminescent image analyzer LAS-4000. Western blots were performed from lysates originating from at least two different tumors. Similarly, western blot studies were performed using cell lysates. Acknowledgements
We thank RCB for intramural funding, and the Department of Biotechnology for funding. AB thanks the Department of Science and Technology for Ramanujan Fellowship. SK and VS thank RCB; AS and SB thank DBT for research fellowships. SS would like to acknowledge the National Institute of Immunology core funds, Department of Biotechnology (DBT), India (BT/PR3148/AGR/36/706/2011); the Department of Science and Technology (DST), India (SR/SO/BB-08/2010); the Indo-French Centre for the Promotion of Advanced Research (IFCPAR) (IFC/4603 A/2011/1250); and the Council of Scientific and Industrial Research (CSIR), India [37(1541)/12/EMR-II], for financial assistance. We thank Dr Nirpender Singh for helping in recording mass spectra, and AIRF, JNU for recording NMR spectra. References
-
(a) J. Schneikert and J. Behrens, Gut, 2007, 56, 417 CrossRef CAS PubMed;
(b) S. D. Shnyder, Y. Fu, A. Habtemariam, S. H. van Rijt, P. A. Cooper, P. M. Loadman and P. J. Sadler, Med. Chem. Commun., 2011, 2, 666 RSC.
-
(a) Q. Wu, Z. Bai, Q. Ma, W. Fan, L. Guo, G. Zhang, L. Qiu, H. Yu, G. Shao and R. Cao, Med. Chem. Commun., 2014, 5, 953 RSC;
(b) D. Kumar, K. K. Raj, S. V. Malhotra and D. S. Rawat, Med. Chem. Commun., 2014, 5, 528 RSC;
(c) C. Hess, D. Ventez and D. Neri, Med. Chem. Commun., 2014, 5, 408 RSC;
(d) N. R. Penthala, V. N. Sonar, J. Horn, M. Laggas, J. S. K. B. Yadlapalli and P. A. Crooks, Med. Chem. Commun., 2013, 4, 1073 RSC.
-
(a) M. Baptissart, A. Vega, S. Maqdasy, F. Caira, S. Baron and J. A. Lobaccaro, Biochimie, 2013, 95, 504 CrossRef CAS PubMed;
(b) J. R. Pearson, C. I. Gill and I. R. Rowland, Nutr. Rev., 2009, 67, 509 CrossRef PubMed.
-
(a) S. Mukhopadhyay and U. Maitra, Curr. Sci., 2004, 87, 1666 CAS;
(b) A. Gioiello, F. Venturoni, S. Ramimi, C. Custodi, R. Pellicciari and A. Macciarulo, Med. Chem. Commun., 2014, 5, 750 RSC.
- J. Y. Chiang, J. Lipid Res., 2009, 1955 CrossRef CAS PubMed.
- A. M. Gallimore and A. Godkin, N. Engl. J. Med., 2013, 368, 282 CrossRef CAS PubMed.
- K. Schlottmann, F. Wachs, R. C. Krieg, F. Kullmann, J. Scholmerich and G. Rogler, Cancer Res., 2000, 60, 4270 CAS.
- H. Bernstein, C. Bernstein, C. M. Payne and K. Dvorak, World J. Gastroenterol., 2009, 15, 3329 CrossRef CAS.
- S. Akare and J. D. Martinez, Biochim. Biophys. Acta, 2005, 1735, 59 CrossRef CAS PubMed.
- A. A. Powell, J. M. Larue, A. K. Batta and J. D. Martinez, Biochem. J., 2001, 356, 481 CrossRef CAS.
- C. Degirolamo, S. Modica, G. Palasciano and A. Moschetta, Trends Mol. Med., 2011, 17, 564 CrossRef CAS PubMed.
- B. W. Katona, S. Anant, D. F. Covey and W. F. Stenson, J. Biol. Chem., 2009, 284, 3354 CrossRef CAS PubMed.
- D. Qiao, E. D. Stratagouleas and J. D. Martinez, Carcinogenesis, 2001, 22, 35 CrossRef CAS.
-
(a) S. O. Bajaj, P. Shu, P. J. Beuning and G. A. O'Doherty, Med. Chem. Commun., 2014, 5, 1138 RSC;
(b) A. W. Young, Z. Liu, C. Zhou, F. Totsingan, N. Jiwraka, Z. Shi and N. R. Kallenbach, Med. Chem. Commun., 2011, 2, 308 RSC;
(c) I. M. Herzog and M. Fridman, Med. Chem. Commun., 2014, 5, 1014 RSC;
(d) I. M. Herzog, M. Feldman, A. Eldar-Boock, R. Satchi-Fianaro and M. Fridman, Med. Chem. Commun., 2013, 4, 120 RSC.
- B. S. Chhikara, D. Mandal and K. Parang, J. Med. Chem., 2012, 55, 1500 CrossRef CAS PubMed.
- H. K. Agarwal, B. S. Chhikara, S. Bhavaraju, D. Mandal, G. F. Doncel and K. Parang, Mol. Pharmaceutics, 2013, 10, 467 CrossRef CAS PubMed.
- K. Pal, S. K. Pore, S. Sinha, R. Janardhanan, D. Mukhopadhyay and R. Banerjee, J. Med. Chem., 2011, 54, 2378 CrossRef CAS PubMed.
- S. Sinha, S. Roy, B. S. Reddy, K. Pal, G. Sudhakar and S. Iyer, Mol. Cancer Res., 2011, 9, 364 CrossRef CAS PubMed.
- V. Sreekanth, S. Bansal, R. K. Motiani, S. Kundu, S. K. Muppu, T. D. Majumdar, S. Sengupta and A. Bajaj, Bioconjugate Chem., 2013, 18, 1468 CrossRef PubMed.
-
(a) M. Singh, A. Singh, S. Kundu, S. Bansal and A. Bajaj, Biochim. Biophys. Acta, 2013, 1828, 1926 CrossRef CAS PubMed;
(b) S. Bansal, M. Singh, S. Kidwai, P. Bhargava, A. Singh, V. Sreekanth, R. Singh and A. Bajaj, Med. Chem. Commun., 2014, 5, 1761 RSC.
- A. Kamal, S. Ponnampalli, M. V. P. S. Vishnuvardhan, M. P. N. Rao, K. Mullagiri, V. L. Nayak and B. Chandrakant, Med. Chem. Commun., 2014, 5, 1644 RSC.
- S. Fulda and K. M. Debatin, Oncogene, 2006, 25, 4798 CrossRef CAS PubMed.
- C. Liu, L. Zhou, J. Liu, J. Xiao, H. Gao and K. Yang, New J. Chem., 2013, 37, 575 RSC.
- C. Li, A. Rehman, K. Dalley and P. B. Savage, Tetrahedron Lett., 1999, 40, 1861 CrossRef CAS.
- A. Sharma, S. Kundu, A. M. Reddy, A. Bajaj and A. Srivastava, Macromol. Biosci., 2013, 13, 927 CrossRef CAS PubMed.
- N. A. P. Franke, H. P. Rodermond, J. Stap, J. Haveman and C. Van Bree, Nat. Protoc., 2006, 1, 2315 CrossRef PubMed.
Footnotes |
| † Electronic supplementary information (ESI) available: Comparison of cytotoxicity of ester and amide derivatives of LCA-PIP1. Characterization of final compounds LCA-PPZ1, LCA-MOR1, and LCA-TMOR1. HPLC profiles of all the amphiphiles. See DOI: 10.1039/c4md00223g |
| ‡ These authors contributed equally. |
| § Current address: Institute of Genomics and Integrative Biology, New Delhi-110025. |
|
| This journal is © The Royal Society of Chemistry 2015 |
Click here to see how this site uses Cookies. View our privacy policy here.