
Optofluidic laser array based on stable high-Q Fabry–Pérot microcavities†
Wenjie
Wang
*a,
Chunhua
Zhou
a,
Tingting
Zhang
a,
Jingdong
Chen
a,
Shaoding
Liu
a and
Xudong
Fan
*ab
aKey Lab of Advanced Transducers and Intelligent Control System of Ministry of Education, Taiyuan University of Technology, 79 Yingze Street, Taiyuan 030024, PR China. E-mail: wangwenjie@tyut.edu.cn
bDepartment of Biomedical Engineering, University of Michigan, 1101 Beal Avenue, Ann Arbor, Michigan 48109, USA. E-mail: xsfan@umich.edu
First published on 11th August 2015
Abstract
We report the development of an optofluidic laser array fabricated on a chip using stable plano-concave Fabry–Pérot (FP) microcavities, which are far less susceptible to optical misalignment during device assembly than the commonly used plano-plano FP microcavities. The concave mirrors in our FP microcavities were created by first generating an array of microwells of a few micrometers in depth and a few tens of micrometers in diameter on a fused silica chip using a CO2 laser, followed by coating of distributed Bragg reflection (DBR) layers. The plano-concave FP microcavity had a Q-factor of 5.6 × 10⁵ and finesse of 4 × 10³, over 100 times higher than those for the FP microcavities in existing optofluidic lasers. 1 mM R6G dye in ethanol was used to test the plano-concave FP microcavities, showing an ultralow lasing threshold of only 90 nJ mm−2, over 10 times lower than that in the corresponding unstable plano-plano FP microcavities formed by the same DBR coatings on the same chip. Simultaneous laser emission from the optofluidic laser array on the chip and single-mode lasing operation were also demonstrated. Our work will lead to the development of optofluidic laser-based biochemical sensors and novel on-chip photonic devices with extremely low lasing thresholds (nJ mm−2) and mode volumes (fL).
Introduction
Optofluidic lasers are emerging as a new technology platform for novel on-chip photonic devices and sensitive biochemical sensors.1,2 To date, various optical microcavities have been explored for optofluidic lasers (see Table S1†), including Fabry–Pérot (FP) cavities,3–11 distributed feedback gratings,12–17optical ring resonators,18–24 photonic crystals,25 and random laser cavities.26–29 Among them, the FP cavity has advantages in ease of implementation and good compatibility with microfluidics. Moreover, the FP cavity provides bulk interaction between the electromagnetic field and the gain medium, i.e. a predominant portion of the field is within the body of the gain medium, in contrast to the evanescent field based interaction such as in ring resonators. Such whole body interaction offers a complementary approach to the evanescent interaction in various applications where the gain medium is away from the cavity surface (such as when the gain medium is inside a cell9). In addition, it makes full use of the gain medium and significantly reduces the background fluorescence from the fluorophores that do not participate in the laser emission as in the evanescent interaction cases. Furthermore, the FP cavity is able to accommodate a solution of any refractive index, making it more flexible than other types of cavities such as ring resonators that require the solution's refractive index to be either higher or lower than that of the surrounding medium.However, the current FP cavities in existing optofluidic lasers suffer from two major drawbacks. First, most of the FP microcavities utilize metal-coated mirrors as the reflector,3,5–8,11 which have a maximum reflectivity of approximately 95% (for gold and silver coating at the wavelength of 600 nm), corresponding to a maximum finesse of 61 (or Q = 104 for a 50 μm long cavity) theoretically, neglecting all other losses. Second, the FP cavities are usually constructed using a pair of parallel mirrors in a plano-plano format, which is highly susceptible to optical misalignment during cavity assembly and integration with microfluidics and results in further degradation of the Q-factor. Consequently, high pump intensities are usually needed to achieve lasing in the current FP cavity based optofluidic lasers (see Table S1†).
Recently, substantial efforts have been dedicated to micro-fabrication of stable FP microcavities with high Q-factors and small mode volumes for fundamental physics research and novel photonic devices using gas bubbles,30 wet etching,31–34 focused ion beam milling,35 and CO2 laser ablation.36–38 Those cavities exhibit excellent optical quality with a finesse as high as 1.5 × 10⁵ (corresponding to a Q-factor of 3.3 × 10⁶ in a 10 μm long cavity at 920 nm)36 and a mode volume of only a few fL to a few tens of fL.35,36 However, to date, applications of stable high Q-factor FP cavities in optofluidics have rarely been explored,33,34 in particular, in the visible spectral region on which optofluidic lasers are mainly focused.
Here we report an optofluidic laser array based on stable plano-concave (p-c) FP microcavities with sub-pL mode volumes fabricated on a fused silica chip using CO2 laser ablation, followed by coating with distributed Bragg reflection (DBR) dielectric layers. An unprecedented Q-factor of 5.6 × 10⁵ was achieved for a 31 μm long cavity around a wavelength of 600 nm, corresponding to a finesse of 4000, over 100 times higher than that of the FP microcavities in the existing optofluidic lasers (see Table S1† for comparison). A lasing threshold as low as 90 nJ mm−2 was also demonstrated using 1 mM R6G dye in ethanol as the gain medium. Such a high finesse and low lasing threshold make the performance of our FP cavity close to that of the optofluidic ring resonator laser that has a record high finesse (and Q-factor) and low lasing threshold.19 Due to the low lasing threshold, emission from multiple lasers can be obtained simultaneously by pumping an array of FP cavities using an expanded beam.
Fabrication, assembly and characterization of FP cavities
The p-c FP microcavities were made in three steps. First, an array of microwells of a few micrometers in depth and a few tens of micrometers in diameter were created on a fused silica chip using a CO2 laser. Then the chips with and without the microwells were both coated with DBR layers to form the concave and planar mirrors. Finally, an array of p-c FP microcavities were assembled using a thin layer of copper sheet as a spacer. The details of each step are given as follows.Creation of microwells on a fused silica chip
In recent years, several methods have been developed to create concave microwells on a chip as discussed previously. In our work, we adapted the CO2 laser ablation method38 due to its simplicity and the smooth surface that it can generate. We used an RF-pumped CO2 laser (Synrad Firestar vi30, pulse repetition rate = 20 kHz) to fabricate the concave structure on the optically polished surface of a fused silica substrate. The CO2 beam was first focused with a ZnSe lens of focal length f = 25.4 mm and then normally incident onto the surface of the substrate. By varying the average output power (duty cycle), pulse train duration time, and the distance between the substrate surface and the focal point, concave microwells of various depth (t), effective diameter (d), and minimum radius (R) of surface curvature could be fabricated, as illustrated in Fig. 1(A). Curves 1 and 2 represent the experimental profile of one of the concave structures measured with a step profilometer and the corresponding Gaussian fit. The surface radius of curvature (curve 4) is calculated based on the Gaussian fit. d represents the transverse length where the radius of the surface curvature is positive. Circular fit (curve 3) with a minimum radius of curve R = 94 μm is also presented, indicating that the concave structure has a nearly uniform curvature at the bottom. The SEM (scanning electron microscope) image in the inset of Fig. 1(A) presents the top view of one of the typical microwells, showing a symmetric and circular shape within the substrate plane. Fig. 1(B) shows the image of roughness distribution measured by atomic force microscopy, giving an average surface roughness rms (root mean square) of about 2.5 nm over an area of 4 μm2. For the experiment, we fabricated two types of concave structures, which are summarized in Table 1, each containing an array of 4 × 4 microwells with a period of 3 mm, as illustrated in Fig. 1(C).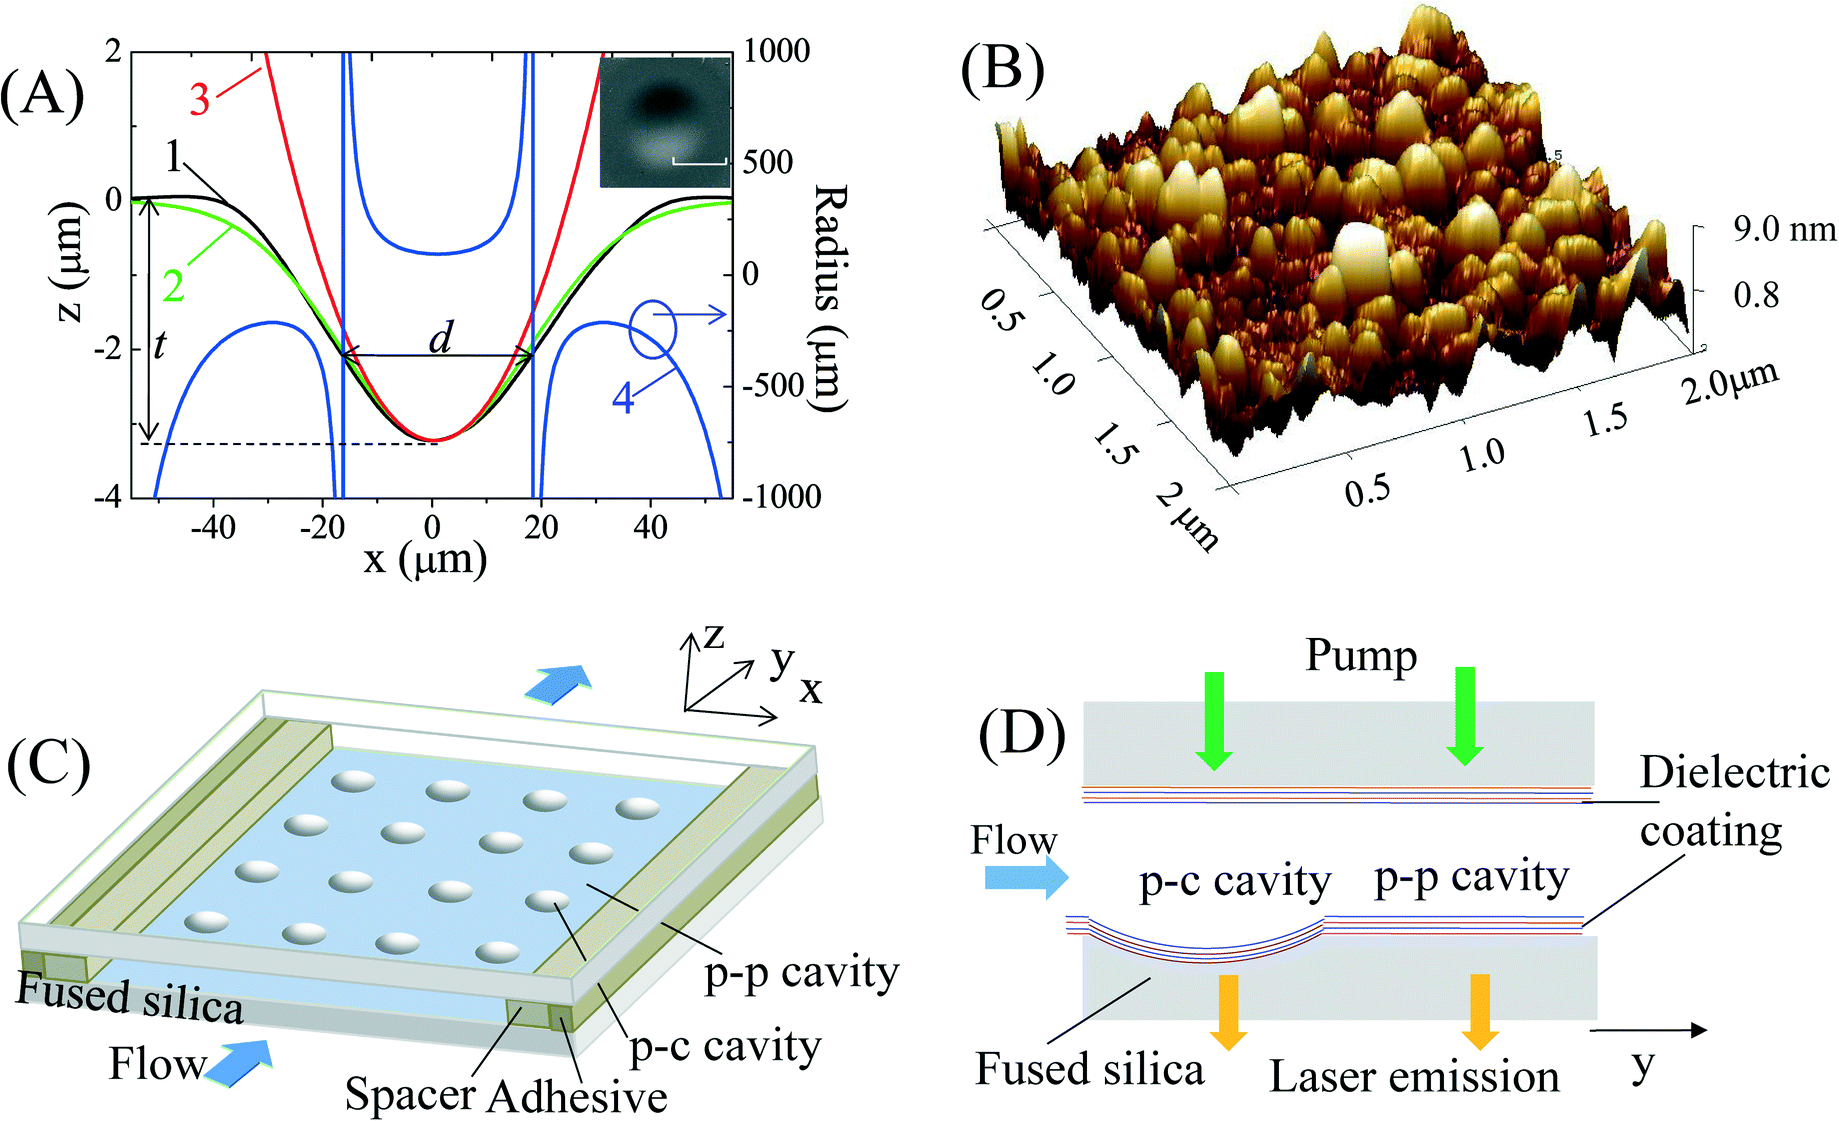 | ||
| Fig. 1 (A) Profile of a concave microwell measured experimentally (curve 1) and approximated with Gaussian fit (curve 2) and circular fit (curve 3). Curve 4 is the radius distribution of the concave surface based on the Gaussian fit. t: depth of the concave microwell; d: effective diameter where the radius of surface curvature is positive. The inset is the SEM image of the concave microwell after CO2 laser ablation. Scale bar = 50 μm. (B) Atomic force microscopy of the surface roughness distribution, showing an average surface roughness rms of about 2.5 nm over an area of 4 μm2. (C) Schematic of the optofluidic laser array based on plano-concave (p-c) and plano-plano (p-p) FP cavities. (D) Details of the experimental setup with p-c and p-p FP cavities co-existing on the same fused silica chip. | ||
| Concave microwell | Type 1 | Type 2 | |
|---|---|---|---|
| Fabrication condition | Laser power (W) | ~0.9 (duty cycle 3%) | ~4.8 (duty cycle 16%) |
| Pulse duration time (ms) | 30 | 30 | |
| Characterization | Depth t (μm) | 1–4 | 8–13 |
| Diameter d (μm) | 30–40 | 85–105 | |
| Minimum radius R (μm) | 80–200 | 250–400 | |
| Microwell array | 4 × 4 square arrays with a period of 3 mm | ||
| Dielectric coating | Central wavelength (nm) | 570 | 600 |
| Reflectivity | ≥99.5% | ≥99.9% | |
Coating
DBRs were formed by coating multiple dielectric layers commercially on the entire surface of the microwell chips and planar fused silica substrates without any microwells. For type 1 microwells and planar substrates, the DBR had 15 pairs of ZrO2 and SiO2 layers by vacuum evaporation technique, producing a mirror reflectivity of ≥99.5% centered at λ = 570 nm. For type 2 microwells and planar substrates, the DBR had 15 pairs of Ti2O5 and SiO2 layers using the ion beam sputtering method, providing a mirror reflectivity of ≥99.9% centered at λ = 600 nm.Assembly
The FP cavities were assembled by attaching a chip with a microwell array to a planar mirror of the same dielectric coating, as shown in Fig. 1(C). First, a thin layer of copper sheet with thickness Ls was placed between the two mirrors as a spacer. Then, to fix the PF cavity, adhesive was inserted into the gap of the two mirrors at the outer edges of the copper sheet with pressure applied to the two mirrors until the adhesive was dried naturally in air. In this way a p-c FP cavity was formed with one concave mirror and one planar mirror facing each other, thus creating a stable optical cavity in all three dimensions, provided that the cavity length L (= Ls + t) is less than the minimum radius R of the concave surface. Concurrently, plano-plano (p-p) FP microcavities could also be formed with a cavity length Ls at the locations on the same chip that did not have a microwell. The resulting p-c and p-p microcavities are illustrated in Fig. 1(C) and (D). In our experiment, we explored two sets of concave microwells and coatings. Consequently, there were two types of microcavity chips named type 1 and type 2, each having both p-c and p-p FP cavities on the same chip. The details of those cavities are given in Table 1.Characterization
First we used the cavity scanning method to characterize the p-c and p-p FP cavities on type 1 and type 2 chips by measuring the transmission spectrum with a single-mode cw laser at 561 nm (see section I in the ESI†). The experimental setup is shown in Fig. S1.† Since the orientations of one of the mirrors could be adjusted to align with another one, this method allows us to measure the finesse of the p-c and p-p FP cavities under the optimal conditions (limited by the precision of position and angular adjustment of stage 2 in Fig. S1†). During the test, the cavity length was scanned by one translation stage controlled by a piezo actuator and the medium filled in the cavity was air.Tens of p-c and p-p FP cavities on both type 1 and type 2 chips were tested. Fig. 3 shows some typical transmission spectra for p-c and p-p PF cavities on type 1 (Fig. 2(A) and (B)) and type 2 (Fig. 2(C) and (D)) chips. For type 1 chips, the measured finesses of p-c and p-p cavities were similar, in the range of 150–370, whereas for type 2 chips, the finesse of the p-c cavities was in the range of 1000–2000, far better than that of the p-p cavities, which was in the range of 100–400. If the two cavity mirrors (as shown in Fig. S1†) had been perfectly aligned, i.e. the cavity geometry loss could be neglected, the measured finesse of the p-c and p-p cavities on the same chip would have been the same. While this was the case for the p-c and p-p FP cavities with relatively low finesses (i.e. type 1 chip), 5–10 times difference was observed between the p-c and p-p cavities on type 2 chips. At a relatively low reflectivity as in type 1 chips, the cavity loss due to optical misalignment is small compared to the transmission loss through the mirrors. Therefore, both p-c and p-p cavities have similar finesses. However, at a relatively high reflectivity as in type 2 chips, the p-p cavities become more sensitive to optical misalignment (due to the limited precision of stage 2 in Fig. S1†) and the cavity geometry loss overtakes the mirror transmission loss. Consequently, the finesse does not improve despite the higher mirror reflectivity. In contrast, the p-c cavities are stable cavities, which are far more robust against optical misalignment. Consequently, the finesse is enhanced significantly with higher mirror reflectivity in type 2 chips.
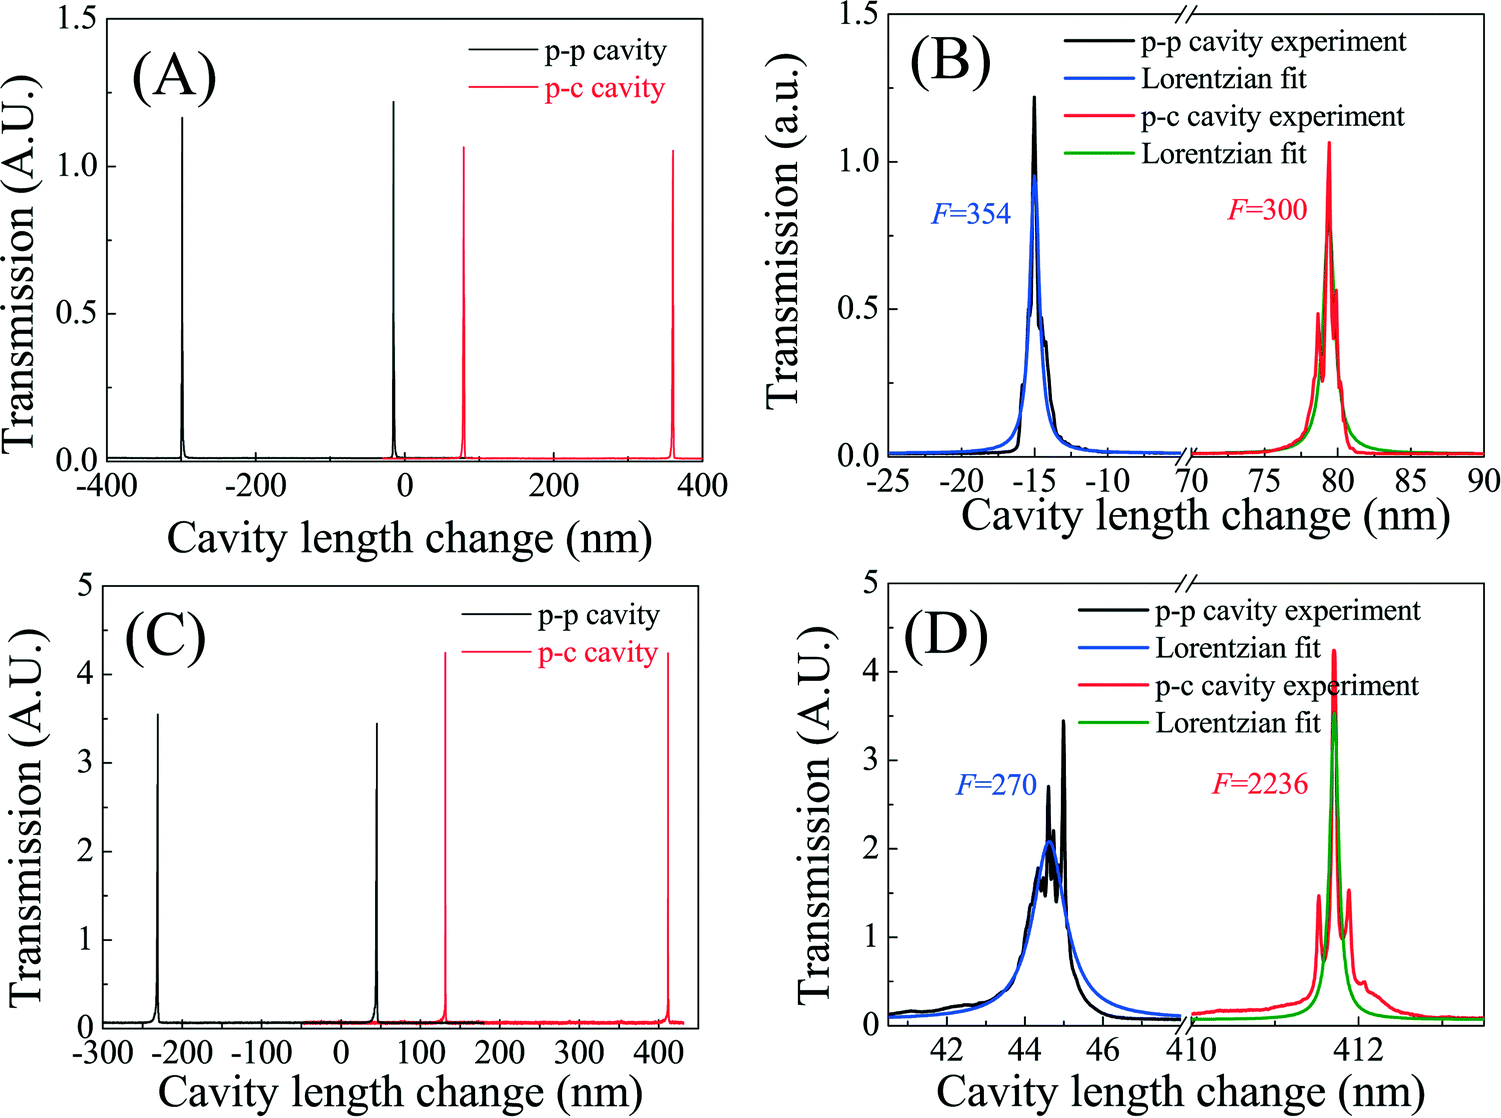 | ||
| Fig. 2 FP cavity finesse measurement using the cavity scanning method. The wavelength of the single-mode laser was fixed at 561 nm. The cavity length was initially set at 50 μm and then scanned with a piezo actuator. (A) Transmission spectra of the p-p and p-c FP cavities in a type 1 device. (B) Zoom-in spectra corresponding to (A). Lorentzian fits show a finesse of 354 and 300 for the p-p and p-c FP cavity, respectively. (C) Transmission spectra of the p-c and p-p FP cavities in a type 2 device. (D) Zoom-in spectra corresponding to (C). Lorentzian fits show a finesse of 270 and 2236 for the p-p and p-c FP cavity, respectively. The details of the experimental setup are given in Fig. S1 in the ESI.† | ||
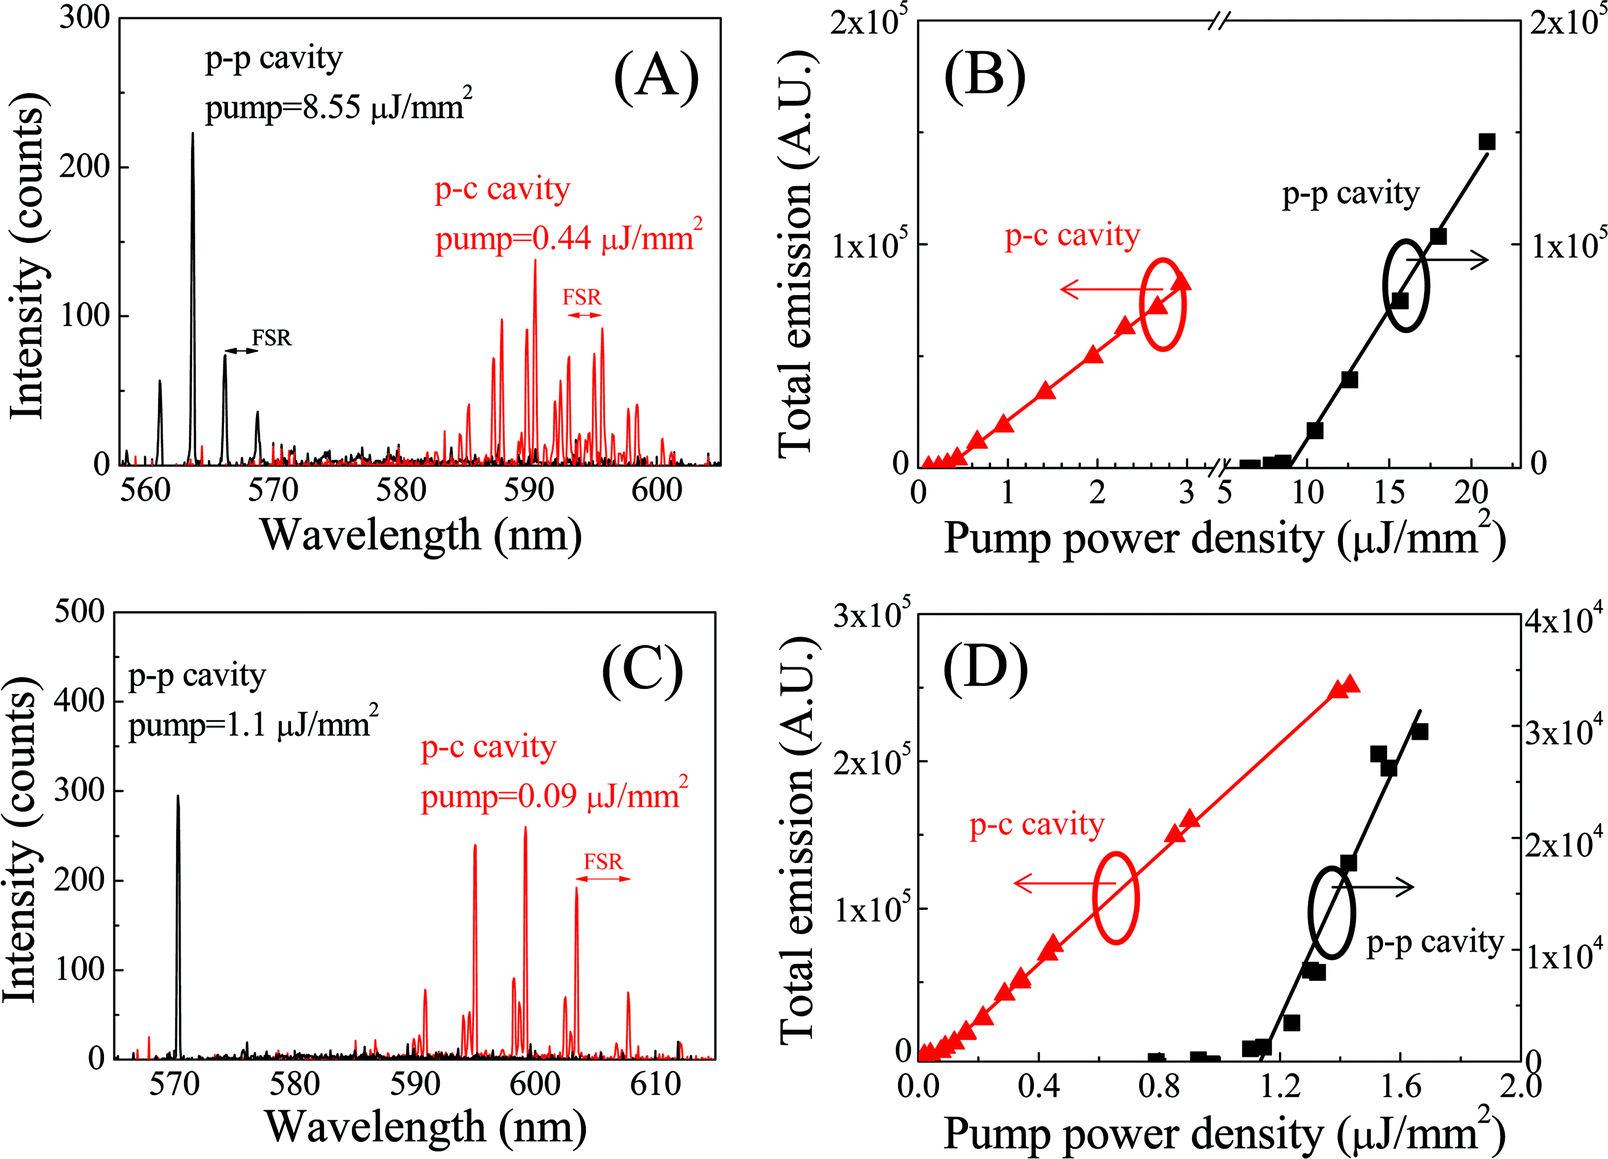 | ||
| Fig. 3 (A) Lasing spectra from 1 mM R6G in ethanol for the p-c and p-p FP cavities on the same type 1 chip. Free spectral range is 2.61 nm and 2.55 nm for the p-c and p-p FP cavities, respectively, corresponding to a cavity length of 49 μm and 46 μm. (B) Spectrally integrated laser emission from 550 nm to 610 nm as a function of pump power intensity corresponding to the p-c and p-p FP cavities in (A). Solid lines are the linear fits, showing a lasing threshold of 0.33 μJ mm−2 and 8.55 μJ mm−2 for the p-c and p-p FP cavities, respectively. (C) Lasing spectra from 1 mM R6G in ethanol for p-c and p-p FP cavities on the same type 2 device. Free spectral range was 4.2 nm and 5.3 nm (not shown in the figure) for the p-c and p-p FP cavities, respectively, corresponding to a cavity length of 31 μm and 22 μm. (D) Spectrally integrated laser emission from 550 nm to 624 nm as a function of pump power intensity corresponding to the p-c and p-p FP cavities in (C). Solid lines are the linear fits, showing a lasing threshold of 0.09 μJ mm−2 and 1.1 μJ mm−2 for the p-c and p-p FP cavities, respectively. | ||
Experimental
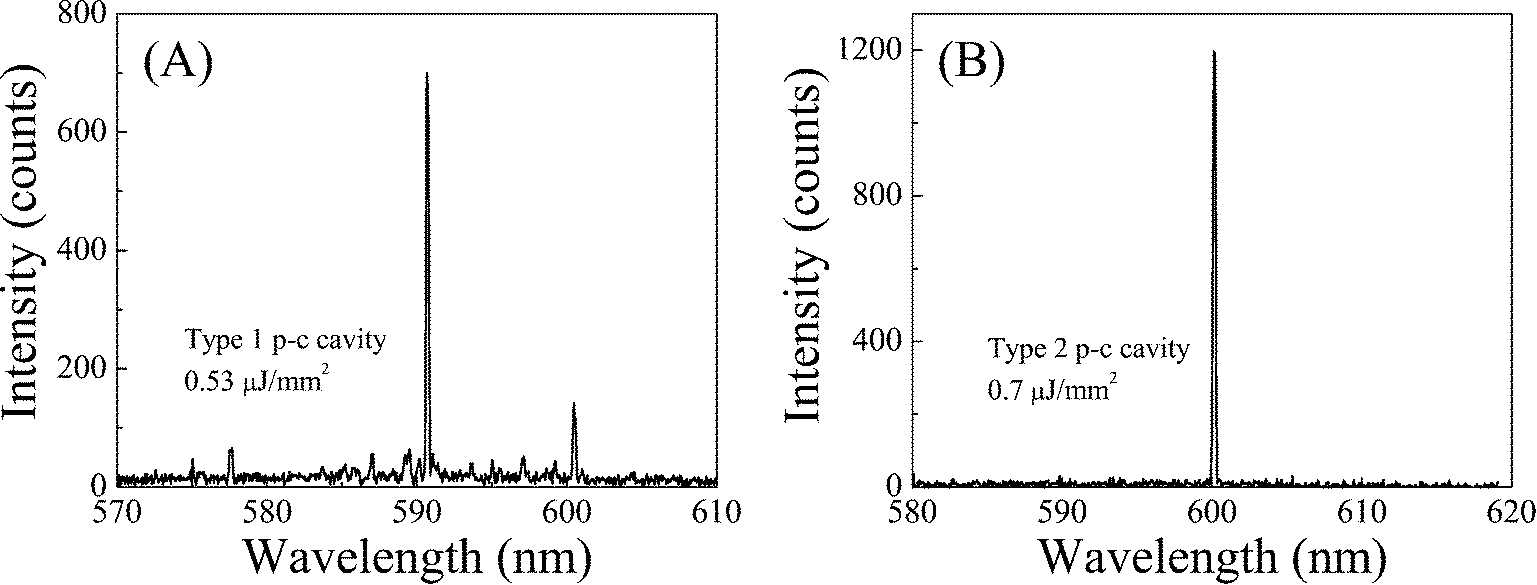
1 mM Rhodamine 6G (R6G) in ethanol was pumped into the fluidic channel by a syringe pump at a linear velocity of 3 mm s−1. A pulsed laser (532 nm wavelength, 5 ns pulse width, 20 Hz repetition rate) was normally incident onto the cavity through the planar mirror with a focal spot size of about 80 μm (FWHM). The pump power was controlled with a half-wave plate and a polarizer. The emission signal in the cavity was collected from the other mirror with an optical fiber and then sent to a spectrometer (Horiba 320), as illustrated in Fig. 1(D). A translation stage was used to move the sample transversely with respect to the incident beam in order to switch one cavity to another on the same chip.Fig. 3(A) shows the laser emission spectra from p-c and p-p FP cavities in a type 1 chip at a pump power density of 0.44 μJ mm−2 and 8.55 μJ mm−2, respectively. The free spectral range (FSR) is about 2.61 nm and 2.55 nm for the p-c and p-p cavities, corresponding to a cavity length of 49 μm and 46 μm, respectively, close to the nominal spacer's thickness (45 μm for this experiment) plus the microwell depth (~3 μm) used for those cavities. The center of the lasing wavelength shifts from 563 nm for the p-p cavity to 592 nm in the p-c cavity, suggesting a significant improvement in the Q-factor of the p-c cavity over the p-p cavity, although the DBR reflectivity for type 1 chips was higher at 563 nm than at 592 nm.
The spectrally integrated emission (550 nm to 610 nm) as a function of the pump power density is plotted in Fig. 3(B). The corresponding linear fit shows that the lasing threshold is approximately 0.33 μJ mm−2 for the p-c cavity, about 26 times lower than 8.55 μJ mm−2 for the p-p cavity. According to the theoretical analysis (see section II in the ESI†), the empty cavity Q-factors (i.e. the Q-factors for the cavity filled with ethanol without dye) are estimated as 1.3 × 10⁵ and 3.6 × 10³ for the p-c and p-p cavity, respectively, with a corresponding finesse of 575 and 16. If we neglect the difference of light losses in pure ethanol and air, we can see that the finesse for the p-p cavity decreases significantly while it remains nearly unchanged for the p-c cavity in comparison with the results in Fig. 2(B), which shows that the p-c cavity is much more stable than the p-p cavity during optofluidic laser cavity assembly. The optofluidic laser results for type 1 p-c and p-p cavities are summarized in Table 2.
| Chips | Type 1 | Type 2 | ||
|---|---|---|---|---|
| Microcavity | p-c cavity | p-p cavity | p-c cavity | p-p cavity |
| Laser wavelength (nm) | 592 | 563 | 599 | 570 |
| FSR (nm) | 2.61 | 2.55 | 4.2 | 5.3 |
| Cavity length (μm) | 49 | 46 | 31 | 22 |
| Laser threshold (μJ mm−2) | 0.33 | 8.55 | 0.09 | 1.1 |
| Estimated Q-factor | 1.3 × 10⁵ | 3.6 × 10³ | 5.6 × 10⁵ | 3.5 × 10⁴ |
| Estimated finesse | 575 | 16 | 4000 | 332 |
In order to achieve an even higher Q-factor and lower lasing threshold in the FP cavity based optofluidic lasers, we used DBRs with higher reflectivity (≥99.9%) in type 2 chips and moved the reflection center wavelength to 600 nm (see Table 1). Fig. 3(C) shows the laser emission spectra from p-c and p-p FP cavities at a pump power density of 0.09 μJ mm−2 and 1.1 μJ mm−2, respectively. The FSR is about 4.2 nm and 5.3 nm for the p-c and p-p cavities, corresponding to a respective cavity length of 31 μm and 22 μm, close to the nominal spacer's thickness (20 μm for this experiment) plus the microwell depth (~10 μm) used for those cavities. The center of the lasing wavelength shifts from 570 nm for the p-p cavity to 599 nm in the p-c cavity, suggesting significant improvement in the Q-factor of the p-c cavity over the p-p cavity.
The spectrally integrated emission (550 nm to 610 nm) as a function of the pump power density is plotted in Fig. 3(D). The corresponding linear fit shows that the lasing threshold is approximately 0.09 μJ mm−2 for the p-c cavity and 1.1 μJ mm−2 for the p-p cavity. The low threshold obtained with the p-c cavity is close to the record low threshold of 25 nJ mm−2 achieved with the ring resonator using the same gain medium of similar concentration, indicating the excellent quality of the current p-c FP cavity. In fact, according to the theoretical analysis (see section II in the ESI†), the empty cavity Q-factor for the p-c cavity is as high as 5.6 × 10⁵ with a corresponding finesse of 4000, which is consistent with the finesse of 1000–2000 measured at 561 nm using the scanning cavity. The slight increase in the finesse around 600 nm over that at 561 nm can be attributed to the higher reflectivity near the central wavelength for type 2 chips. In comparison, for the p-p cavity on the same chip the Q-factor and finesse are 3.5 × 10⁴ and 332, respectively, much lower than that for the p-c cavity, despite the similar mirror reflectivity. The high finesse of 4000 is close to that obtained with the aforementioned ring resonator (F ~ 7000 with the corresponding Q-factor of 4 × 10⁶ for a ring resonator with 300 μm circumference), making our p-c FP cavity a promising technology for optofluidic laser development. A detailed comparison of various optofluidic lasers is given in Table S1.†
Laser emission from an array of micro/nanocavities on a chip is important in many applications such as sensing and multi-color light sources, etc.11,39,40 Due to the extremely low lasing threshold achieved with the p-c FP, we were able to simultaneously obtain an array of laser emission by expanding the size of the pump beam, as displayed in Fig. 4, with a pump power density of only 0.4 μJ mm−2.
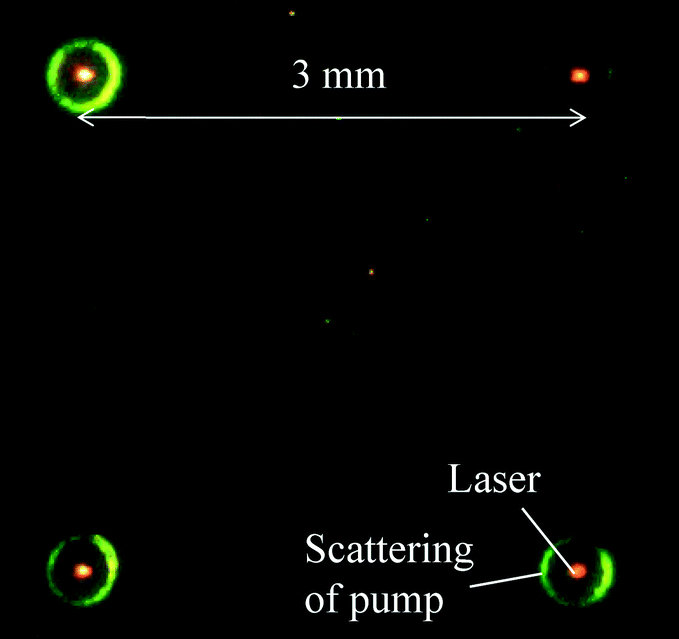 | ||
| Fig. 4 Simultaneous laser emission from an array of type 2 p-c FP cavities. The pump laser was expanded to illuminate the 4 cavities 3 mm apart with a pump power density of about 0.4 μJ mm−2. | ||
By placing the top and bottom mirrors together without any spacer, a single lasing mode operation can be obtained for both type 1 and type 2 p-c cavities, as exemplified in Fig. 5. The cavity length was approximately 4 μm and 8 μm with an effective diameter d of the concave mirror of about 34 μm and 100 μm for type 1 and type 2 p-c cavities, respectively. The corresponding dome volume was estimated to be about 7 pL and 123 pL. Furthermore, using the lasing wavelength of 590.6 nm and 600 nm, the cavity mode (TE00) volume is estimated to be 11 fL and 60 fL for the above type 1 and type 2 p-c cavities, respectively. The detailed calculation for the fluidic dome volume and the optical cavity mode volume can be found in section III in the ESI.†
 | ||
| Fig. 5 Single-mode laser emission spectra from type 1 (A) and type 2 (B) p-c FP cavities. The top and bottom mirrors were placed together without any spacer. The cavity length was approximately 4 μm and 8 μm for the type 1 and type 2 p-c cavities, respectively. The fluidic dome volume was 7 pL and 123 pL and the cavity mode volume was 11 fL and 60 fL, respectively. | ||
Summary and future work
We have developed a high-quality optofluidic laser cavity based on stable p-c FP structures that has pL fluidic volumes and fL optical mode volumes. An ultralow lasing threshold of 90 nJ mm−2 has been achieved. Simultaneous laser emission from the optofluidic laser array on a chip and single-mode lasing operation have also been demonstrated.In future work, we will further improve the finesse and the Q-factor. Earlier work has shown that a finesse of over 105 is achievable.36,37 With 50–100-fold improvement in finesse, a lasing threshold below nJ mm−2 may be realized, which is important for biosensing and photonic devices due to lower photo-toxicity to biomolecules, lower photo-bleaching for fluorophores, lower power consumption, and the possibility of using a small portable pump laser rather than a table-top pulsed laser. In addition, we will also pursue smaller cavity mode volumes down to a single-digit fL or even sub-fL, which is on the order of λ3. With such a small mode volume, along with the high Q-factor, it is possible to achieve lasing emission from far fewer gain molecules than typically used in an optofluidic laser.41,42 Furthermore, cavity quantum electrodynamics and single photon sources can also be explored in the liquid environment. Finally, we will explore the possibilities of using the FP laser array for various biosensing applications,2 such as DNA melting analysis,43 protein conformation analysis,44 cell detection,9,45etc.
Acknowledgements
This work was supported by the National Science Foundation of China (Grant No. 61471254, 11204206, and 11304219), the U.S. National Institutes of Health (Grant No. 1R21EB016783) and the U.S. National Science Foundation (Grant No. DBI-1451127).References
- X. Fan and I. M. White, Optofluidic microsystems for chemical and biological analysis, Nat. Photonics, 2011, 5, 591–597 CrossRef CAS PubMed.
- X. Fan and S. H. Yun, The potential of optofluidic biolasers, Nat. Methods, 2014, 11, 141–147 CrossRef CAS PubMed.
- B. Helbo, A. Kristensen and A. Menon, A micro-cavity fluidic dye laser, J. Micromech. Microeng., 2003, 13, 307–311 CrossRef CAS.
- J. C. Galas, J. Torres, M. Belotti, Q. Kou and Y. Chen, Microfluidic tunable dye laser with integrated mixer and ring resonator, Appl. Phys. Lett., 2005, 86, 264101 CrossRef.
- J. C. Galas, C. Peroz, Q. Kou and Y. Chen, Microfluidic dye laser intracavity absorption, Appl. Phys. Lett., 2006, 89, 224101 CrossRef.
- Q. Kou, I. Yesilyurt and Y. Chen, Collinear dual-color laser emission from a microfluidic dye laser, Appl. Phys. Lett., 2006, 88, 091101 CrossRef.
- G. Aubry, S. Méance, A.-M. Haghiri-Gosnet and Q. Kou, Flow rate based control of wavelength emission in a multicolor microfluidic dye laser, Microelectron. Eng., 2010, 87, 765–768 CrossRef CAS.
- G. Aubry, Q. Kou, J. Soto-Velasco, C. Wang, S. Meance, J. J. He and A. M. Haghiri-Gosnet, A multicolor microfluidic droplet dye laser with single mode emission, Appl. Phys. Lett., 2011, 98, 111111 CrossRef.
- M. C. Gather and S. H. Yun, Single-cell biological lasers, Nat. Photonics, 2011, 5, 406–410 CrossRef CAS.
- M. C. Gather and S. H. Yun, Lasing from Escherichia coli bacteria genetically programmed to express green fluorescent protein, Opt. Lett., 2011, 36, 3299–3301 CrossRef CAS PubMed.
- A. J. C. Kuehne, M. C. Gather, I. A. Eydelnant, S.-H. Yun, D. A. Weitzad and A. R. Wheeler, A switchable digital microfluidic droplet dye-laser, Lab Chip, 2011, 11, 3716–3719 RSC.
- S. Balslev and A. Kristensen, Microfluidic single-mode laser using high-order bragg grating and antiguiding segments, Opt. Express, 2005, 13, 344–351 CrossRef CAS PubMed.
- Z. Li, Z. Zhang, T. Emery, A. Scherer and D. Psaltis, Single mode optofluidic distributed feedback dye laser, Opt. Express, 2006, 14, 696–701 CrossRef CAS PubMed.
- Z. Li, Z. Zhang, A. Scherer and D. Psaltis, Mechanically tunable optofluidic distributed feedback dye laser, Opt. Express, 2006, 14, 10494–10499 CrossRef CAS PubMed.
- M. Gersborg-Hansen and A. Kristensen, Optofluidic third order distributed feedback dye laser, Appl. Phys. Lett., 2006, 89, 103518 CrossRef.
- W. Song, A. E. Vasdekis, Z. Li and D. Psaltis, Low-order distributed feedback optofluidic dye laser with reduced threshold, Appl. Phys. Lett., 2009, 94, 051117 CrossRef.
- W. Song, A. E. Vasdekis, Z. Li and D. Psaltis, Optofluidic evanescent dye laser based on a distributed feedback circular grating, Appl. Phys. Lett., 2009, 94, 161110 CrossRef.
- H. Azzouz, L. Alkhafadiji, S. Balslev, J. Johansson, N. A. Mortensen, S. Nilsson and A. Kristensen, Levitated droplet dye laser, Opt. Express, 2006, 14, 4374–4379 CrossRef CAS PubMed.
- S. Lacey, I. M. White, Y. Sun, S. I. Shopova, J. M. Cupps, P. Zhang and X. Fan, Versatile opto-fluidic ring resonator lasers with ultra-low threshold, Opt. Express, 2007, 15, 15523–15530 CrossRef CAS PubMed.
- S. K. Tang, Z. Li, A. R. Abate, J. J. Agresti, D. A. Weitz, D. Psaltis and G. M. Whitesides, A multi-color fast-switching microfluidic droplet dye laser, Lab Chip, 2009, 9, 2767–2771 RSC.
- X. Wu, Y. Sun, J. D. Suter and X. Fan, Single mode coupled optofluidic ring resonator dye lasers, Appl. Phys. Lett., 2009, 94, 241109 CrossRef.
- W. Lee, H. Li, J. D. Suter, K. Reddy, Y. Sun and X. Fan, Tunable single mode lasing from an on-chip optofluidic ring resonator laser, Appl. Phys. Lett., 2011, 98, 061103 CrossRef.
- H. Chandrahalim, Q. Chen, A. A. Said, M. Dugan and X. Fan, Monolithic optofluidic ring resonator lasers created by femtosecond laser nanofabrication, Lab Chip, 2015, 15, 2335–2340 RSC.
- A. Kiraz, Q. Chen and X. Fan, Optofluidic Lasers with Aqueous Quantum Dots, ACS Photonics, 2015, 2, 707–713 CrossRef CAS.
- B. Zhen, S.-L. Chua, J. Lee, A. W. Rodriguez, X. Liang, S. G. Johnson, J. D. Joannopoulos, M. Soljačić and O. Shapira, Enabling enhanced emission and low-threshold lasing of organic molecules using special Fano resonances of macroscopic photonic crystals, Proc. Natl. Acad. Sci. U. S. A., 2013, 110, 13711–13716 CrossRef CAS PubMed.
- R. C. Polson and Z. V. Vardeny, Random lasing in human tissues, Appl. Phys. Lett., 2004, 85, 1289–1291 CrossRef CAS.
- Q. Song, S. Xiao, Z. Xu, J. Liu, X. Sun, V. Drachev, V. M. Shalaev, O. Akkus and Y. L. Kim, Random lasing in bone tissue, Opt. Lett., 2010, 35, 1425–1427 CrossRef PubMed.
- B. N. S. Bhaktha, N. Bachelard, X. Noblin and P. Sebbah, Optofluidic random laser, Appl. Phys. Lett., 2012, 101, 151101 CrossRef.
- N. Bachelard, S. Gigan, X. Noblin and P. Sebbah, Adaptive pumping for spectral control of random lasers, Nat. Phys., 2014, 10, 426–431 CrossRef CAS.
- G. Cui, J. M. Hannigan, R. Loeckenhoff, F. M. Matinaga, M. G. Raymer, S. Bhongale, M. Holland, S. Mosor, S. Chatterjee, H. M. Gibbs and G. Khitrova, A hemispherical, high-solid-angle optical micro-cavity for cavity-QED studies, Opt. Express, 2006, 14, 2289–2299 CrossRef PubMed.
- M. Trupke, E. A. Hinds, S. Eriksson, E. A. Curtis, Z. Moktadir, E. Kukharenka and M. Kraft, Microfabricated high-finesse optical cavity with open access and small volume, Appl. Phys. Lett., 2005, 87, 211106 CrossRef.
- Y. S. Ow, M. B. H. Breese and S. Azimi, Fabrication of concave silicon micro-mirrors, Opt. Express, 2010, 18, 14511–14518 CrossRef CAS PubMed.
- M. Malak, N. Pavy, F. Marty, Y. A. Peter, A. Q. Liu and T. Bourouina, Micromachined Fabry–Perot resonator combining submillimeter cavity length and high quality factor, Appl. Phys. Lett., 2011, 98, 211113 CrossRef.
- M. Malak, N. Gaber, F. Marty, N. Pavy, E. Richalot and T. Bourouina, Analysis of Fabry-Perot optical micro-cavities based on coating-free all-Silicon cylindrical Bragg reflectors, Opt. Express, 2013, 21, 2378–2392 CrossRef CAS PubMed.
- P. R. Dolan, G. M. Hughes, F. Grazioso, B. R. Patton and J. M. Smith, Femtoliter tunable optical cavity arrays, Opt. Lett., 2010, 35, 3556–3558 CrossRef CAS PubMed.
- A. Muller, E. B. Flagg, J. R. Lawall and G. S. Solomon, Ultrahigh-finesse, low-mode-volume Fabry–Perot cavity, Opt. Lett., 2010, 35, 2293–2295 CrossRef CAS PubMed.
- D. Hunger, T. Steinmetz, Y. Colombe, C. Deutsch, T. W. Hänsch and J. Reichel, A fiber Fabry–Perot cavity with high finesse, New J. Phys., 2010, 12, 065038 CrossRef.
- D. Hunger, C. Deutsch, R. J. Barbour, R. J. Warburton and J. Reichel, Laser micro-fabrication of concave, low-roughness features in silica, AIP Adv., 2012, 2, 012119 CrossRef.
- G. Tsiminis, Y. Wang, A. L. Kanibolotsky, A. R. Inigo, P. J. Skabara, I. D. Samuel and G. A. Turnbull, Nanoimprinted organic semiconductor laser pumped by a light-emitting diode, Adv. Mater., 2013, 25, 2826–2830 CrossRef CAS PubMed.
- T. Watanabe, H. Abe, Y. Nishijima and T. Baba, Array integration of thousands of photonic crystal nanolasers, Appl. Phys. Lett., 2014, 104, 121108 CrossRef.
- Z. S. Wang, H. A. Rabitz and M. O. Scully, The Single-Molecule Dye Laser, Laser Phys., 2005, 15, 118–123 CAS.
- Q. Chen, M. Ritt, S. Sivaramakrishnan, Y. Sun and X. Fan, Optofluidic lasers with a single molecular layer of gain, Lab Chip, 2014, 14, 4590–4595 RSC.
- W. Lee and X. Fan, Intracavity DNA Melting Analysis with Optofluidic Lasers, Anal. Chem., 2012, 84, 9558–9563 CAS.
- Q. Chen, X. Zhang, Y. Sun, M. Ritt, S. Sivaramakrishnana and X. Fan, Highly sensitive fluorescent protein FRET detection using optofluidic lasers, Lab Chip, 2013, 13, 2679–2681 RSC.
- A. Jonáš, M. Aas, Y. Karadag, S. Manioğlu, S. Anand, D. McGloin, H. Bayraktar and A. Kirazb, In vitro and in vivo biolasing of fluorescent proteins suspended in liquid microdroplet cavities, Lab Chip, 2014, 14, 3093–3100 RSC.
Footnote |
| † Electronic supplementary information (ESI) available. See DOI: 10.1039/c5lc00847f |
| This journal is © The Royal Society of Chemistry 2015 |