
Real-time dual-loop electric current measurement for label-free nanofluidic preconcentration chip
Pei-Shan
Chung
a,
Yu-Jui
Fan
d,
Horn-Jiunn
Sheen
d and
Wei-Cheng
Tian
*abc
aGraduate Institute of Electronics Engineering, National Taiwan University, Taipei, 10617 Taiwan. E-mail: wctian@ntu.edu.tw
bDepartment of Electrical Engineering, National Taiwan University, Taipei, 10617 Taiwan
cGraduate Institute of Biomedical Electronics and Bioinformatics, National Taiwan University, Taipei, 10617 Taiwan
dInstitute of Applied Mechanics, National Taiwan University, Taipei, 10617 Taiwan
First published on 23rd October 2014
Abstract
An electrokinetic trapping (EKT)-based nanofluidic preconcentration device with the capability of label-free monitoring trapped biomolecules through real-time dual-loop electric current measurement was demonstrated. Universal current–voltage (I–V) curves of EKT-based preconcentration devices, consisting of two microchannels connected by ion-selective channels, are presented for functional validation and optimal operation; universal onset current curves indicating the appearance of the EKT mechanism serve as a confirmation of the concentrating action. The EKT mechanism and the dissimilarity in the current curves related to the volume flow rate (Q), diffusion coefficient (D), and diffusion layer (DL) thickness were explained by a control volume model with a five-stage preconcentration process. Different behaviors of the trapped molecular plug were categorized based on four modes associated with different degrees of electroosmotic instability (EOI). A label-free approach to preconcentrating (bio)molecules and monitoring the multibehavior molecular plug was demonstrated through real-time electric current monitoring, rather than through the use of microscope images.
Introduction
Microfluidic devices have been extensively used for molecular detection because of well-documented advantages: rapid analyses, decrease in the number of samples and amount of reagents required, and potential for automation and massive parallelization.1–3 Efficient sample collection/preconcentration methods, therefore, are necessary for world-to-chip interfacing to achieve the full potential of the sensing schemes used.4 In response to the need for low-abundance analyte sensing, several sample preconcentration approaches have been developed, including capillary electrophoresis, electrokinetic trapping (EKT),5,6 field amplification stacking,7 isoelectric focusing,8 affinity-based extraction,9 isotachophoresis,10 and membrane filtration.11 Among these approaches, EKT, which traps molecules in a microsized volume through ion concentration polarization (ICP)12 and fluid control, is the most widely used approach for low-abundance biomolecule preconcentration because it achieves a high level of sample preconcentration (approximately several million fold)13 and is suitable for any molecule and cell that has a charge opposite to the surface charge of the ion-selective channels. EKT-based devices have attracted considerable attention not only because of their potential applications in biomolecule sensing5,13–23 but also because of their rich scientific content related to ICP phenomena and electroosmotic instability (EOI).24–35The EKT approach has been used in many fabrication methods and biosensing applications. For efficient ICP upon the passage of electric current through different ion-selective channels, e.g., 1D nanoslots and porous membranes, it is necessary to select an appropriate biomolecule-compatible buffer solution with a suitable Debye length in an electrolyte. Many suitable nanofluidic structures, including the nanogap generated by the junction gap breakdown of glass/polydimethylsiloxane (PDMS),19 vertical nanoslots in silicon,36 parallel nanoslots on glass,13,20 and self-sealed vertical18 and surface-patterned37,38 Nafion® membranes, have been shown to work efficiently in phosphate buffer solution (PBS). By using these nanofluidic structures in EKT devices, many studies have shown that the sensitivity of and the molecular binding kinetics in immunoassays16,21,22 and enzyme activity assays37 can be enhanced. For seamless integration with downstream biosensors, an EKT-based continuous-flow sample preconcentration method that can achieve 100-fold concentration has been developed.14,23
There have been difficulties in using EKT-based devices for molecule detection during the preconcentration process. First, to visualize the trapped molecules, also referred to as the preconcentrated plug, and to observe the behaviors of the preconcentrated plug for subsequent detection purposes, fluorescence-labeled molecules are always necessary for the entire process.4 Nevertheless, when the initial concentration of diluted fluorescence-labeled analytes is as low as 33 fM,13 invisible or indistinguishable fluorescence-labeled preconcentrated plugs render the full control of the EKT mechanism less desirable because of the detection limit of the charge-coupled device (CCD) camera. Moreover, the need for fluorescence-labeled molecules constrains the choice of molecule detection methods in the downstream steps. Second, the appearance of EOI may influence the motion of preconcentrated plugs to different degrees, and the motion is typically described by fluorescence microscope images.15 In addition, the electric conductivities39,40 and fluidic flows15 are changing over time. To date, there is no quantitative explanation describing the behaviors of the preconcentrated plugs and the corresponding electric currents. Furthermore, the EKT mechanism has not been clearly described with flow models.
In this study, we demonstrated a label-free EKT-based nanofluidic preconcentration device by using a real-time dual-loop current monitoring system (Fig. 1). The “typical layout” of the EKT-based preconcentration device involves two microchannels connected by ion-selective nanoslots/membranes. During the label-free preconcentration process, the initial happening site of a preconcentrated plug and the subsequent EOI-influenced behaviors of the plug can be quantitatively and accurately described by two real-time current curves (Fig. 1(D) and (E)). To validate the functionality of “typical” EKT-based devices and to control the preconcentration process, we propose not only the universal characteristic current–voltage (I–V) curves of the functional devices but also the pattern of the current curves generated when the EKT mechanism kicks off during the preconcentration process, also referred to as the onset curves of the EKT mechanism in this paper. To elucidate the unclear EKT mechanism, a fixed control volume (CV) model, based on the assumption that the fluid used in this study is an incompressible Newtonian fluid, was developed to explain the different characteristics of the two circuits during the five-stage preconcentration process (Fig. 1(C)), including the volume flow rate, diffusion layer (DL) thickness, and electric current. To categorize the EOI-influenced behaviors of the preconcentrated plug, four basic modes are presented based on the analyses of the two current curves with the corresponding microscopic images (some of the images are shown in this paper).
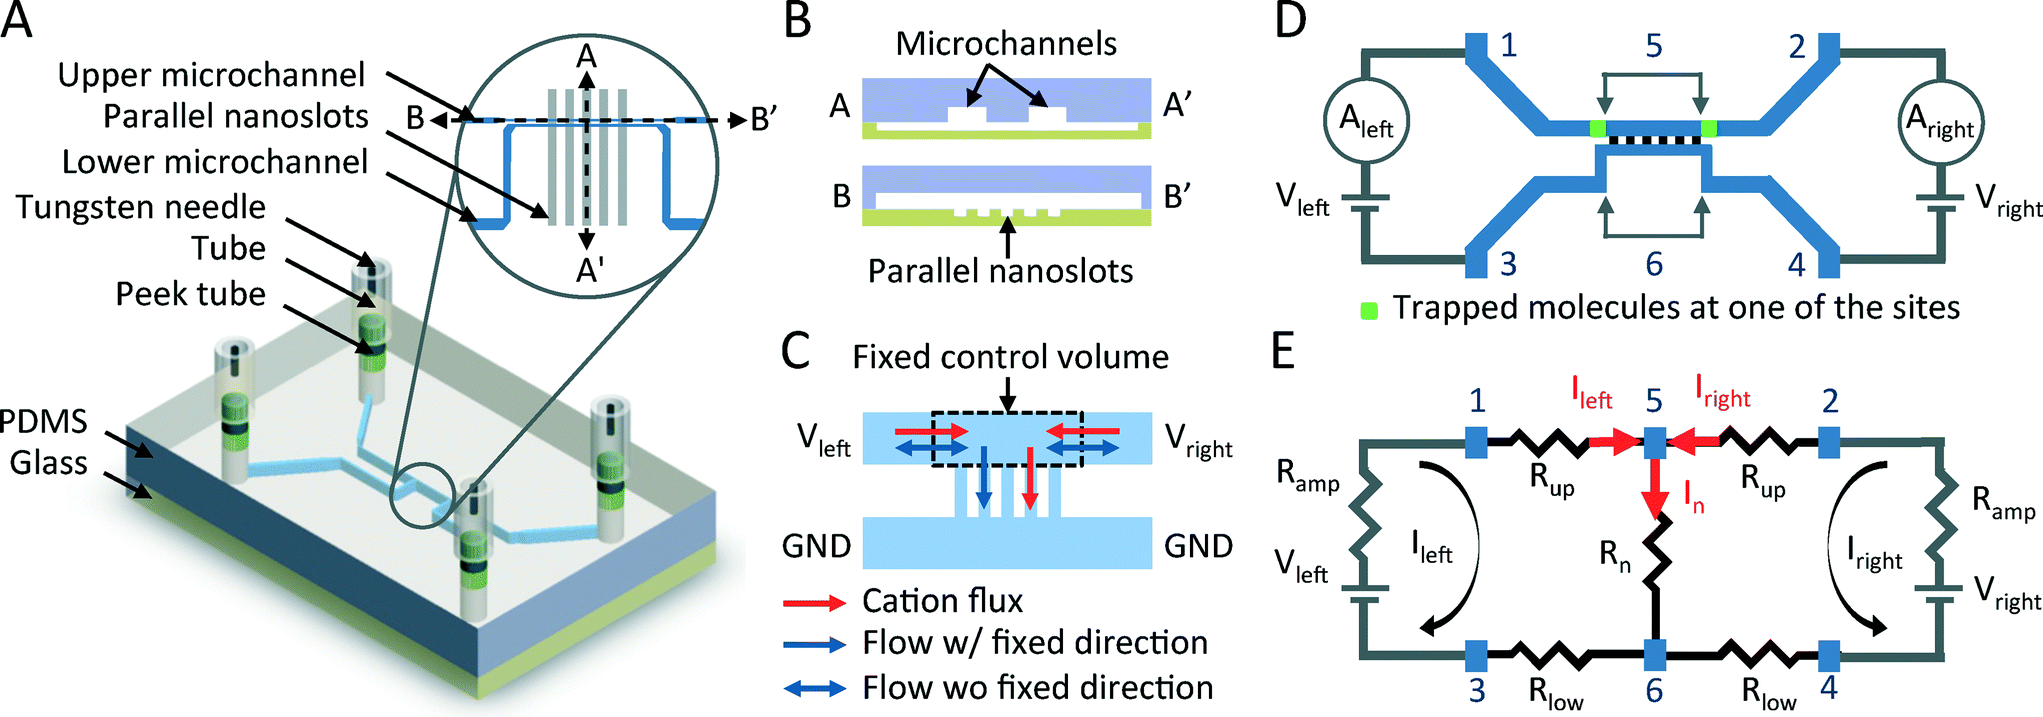 | ||
| Fig. 1 A. Schematic of the proposed device. B. The cross sections of the device. C. The fixed control volume model and flow directions. D. An ideally symmetric schematic of the nanofluidic preconcentration chip with a dual-loop current measurement system. E. The resistive model of the nanofluidic preconcentrator and picoammeters/voltage sources. | ||
Theory
ICP is an electrochemical transport phenomenon occurring near ion-selective channels upon the passage of an electric current. Because of the electrokinetic effects in micro/nanochannels17,31 and because of the presence of negative/positive ions,13 a depleted diffusion layer (DLde) and an enriched diffusion layer (DLen) appear at locations that have the highest and lowest electric potential in the ion-selective channels, respectively. This phenomenon is also called an ion depletion/enrichment process.12A typical I–V curve of ion-selective channels includes ohmic, limiting, and overlimiting regimes in series (Fig. 2(A)). In the beginning, the I–V curve shows a linear ohmic relationship (Fig. 2(A) and (B), (a)). The linear ion concentration gradient in DLde gradually increases and enhances the ion fluxes throughout the ion-selective channels by causing diffusion. In the classical diffusion-limited current transport theory,41 at a critical voltage, the diffusive-flux-enhanced current density saturates when the cation and anion concentrations approach zero, adjacent to the ion-selective channels. Therefore, the limiting current Ilim is attained and a plateau regime is observed in the I–V curve (Fig. 2(A) and (B), (b)). However, at another critical voltage Vss, the breakdown of the electroneutrality condition adjacent to the ion-selective channels leads to the emergence of an extended space charge (ESC) layer between the DLde and the equilibrium electrical double layer (EDL) of the ion-selective channels31 (Fig. 2(A) and (B), (c)). The appearance of a nonequilibrium EDL, the combination of an equilibrium EDL and an ESC layer, is accompanied by the EOI28,32 and hydrodynamic chaos,24 which destroy the DLde and increase the ionic conductivity of the ion-selective channels. Finally, an overlimiting current phenomenon can be observed (Fig. 2 is elaborated in the Results and Discussion section).
 | ||
| Fig. 2 A. Typical dimensionless current–voltage curve of cation-selective channels. B. A schematic of salt concentration profiles near cation-selective channels in one dimension. (a) Ohmic, (b) limiting, and (c) overlimiting current stages. The overlimiting current stage can be divided into cI (steady-state regime), cII (regular oscillation regime), and cIII (irregular oscillation regime); the corresponding threshold voltages are Vss, Vosc, and Vnoise, respectively. | ||
The appearance of the overlimiting current may be caused by convective mixing, including gravitational convection, bulk electroconvection, and electroosmosis-induced electroconvection, i.e., EOI. Gravitational convection results from the action of gravity on the density gradient of the concentration polarization. For a 0.1 M NaCl aqueous solution and a DL less than 200 μm thick, the Rayleigh number (Ra) is 116, an order of magnitude below the gravitational instability threshold (Ra > 1000).42,43 Bulk electroconvection results from the action of macroscopic scale coulombic forces on the residual space charge of a locally quasi-electroneutral bulk. When a gel is immobilized on the ion-selective channels to suppress the appearance of the EOI, the overlimiting current phenomenon disappears. Therefore, bulk electroconvection does not contribute to the overlimiting current.44 Thus, neither gravitational convection nor bulk electroconvection is the real cause of the overlimiting current; rather, the cause is the EOI,28 which is based on the action of coulombic forces on the Debye-length-scale nonequilibrium EDL.28,42 A suitable model of the nonequilibrium EDL has been constructed,35 confirmed, and elaborated by several numerical and analytic studies.25,32,45–47 Zaltzman and Rubinstein clarified the structure of the concentration polarization layer (CPL), which can be divided into three layers in series:28 a quasi-equilibrium EDL, a nonequilibrium ESC layer, and a quasi-electroneutral DLde, which is a transition layer adjacent to the quasi-electroneutral bulk. The combination of the first and second layer and the combination of the second and third layer are termed nonequilibrium EDL and depletion layer, respectively. In experiments, the occurrence of the nonequilibrium electrokinetic phenomena48 has been observed when the macroscopic vortical EOI occurs in quasi-steady-state equilibria27 and unsteady transient equilibria.26,49 The nonequilibrium electroosmotic slip contributes to the vortices and destroys the DLde. Therefore, it renders the quiescent conductance unstable.
In this paper, we propose the CV model (Fig. 1(C) and 5) for incompressible flows to describe the phenomenon of transient changes of two loop currents resulting from transient changes in the fluid flow directions, effective diffusion coefficient, and thicknesses of the DLde during the preconcentration process. As fluids pass through the CV, whose location is defined to be in the upper microchannel and close to the parallel nanoslots, the volume entering the CV per unit time is equal to the volume leaving the CV per unit time. Here, we suppose that the fluid used in this work is incompressible, and to simplify the flow directions in the CV, we define the CV as a region that encompasses the sites of the electroosmotic slip-induced EOI and the nanoslot-induced backflow.15,50 Thus, we considered only the net flows and fluxes at the boundaries of the CV.
When the flow is electrically driven, the total ionic mass flux (Ji) of a species i, given by the extended Nernst–Planck equation, consists of three terms:51 Fick's law for diffusion driven by concentration gradients (c), Ohm's law for migration driven by electric potential gradients (Φ), and Bernoulli's principle for convection generated by differences in pressure (P), e.g., such as by nonequilibrium electroosmotic slips:17,52
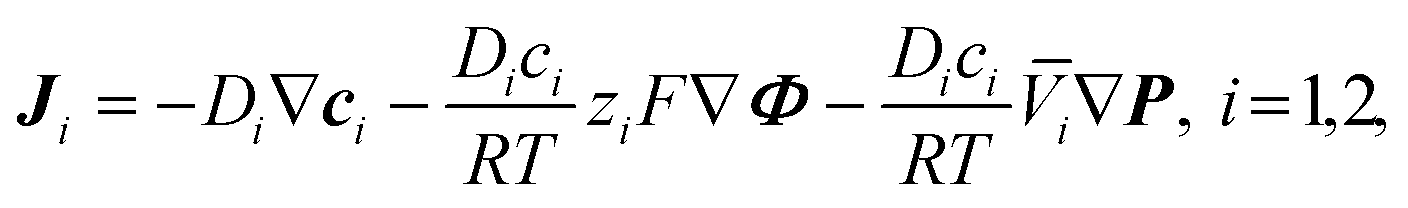 | (1) |
![[V with combining overline]](https://www.rsc.org/images/entities/i_char_0056_0305.gif) i are the diffusion coefficient, concentration, valence, and partial molar volume of species i, respectively. Subscript 1 refers to the cation and 2 to the anion. F is Faraday's constant, R is the gas constant, and T is the absolute temperature. The second term, representing the diffusion flux and considered in one direction, is proportional to the electric field (E), which influences the electroosmotic velocity (veo) and the volume flow rate (Q):
i are the diffusion coefficient, concentration, valence, and partial molar volume of species i, respectively. Subscript 1 refers to the cation and 2 to the anion. F is Faraday's constant, R is the gas constant, and T is the absolute temperature. The second term, representing the diffusion flux and considered in one direction, is proportional to the electric field (E), which influences the electroosmotic velocity (veo) and the volume flow rate (Q):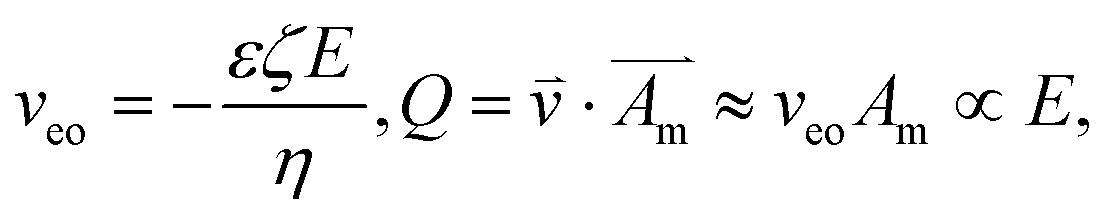 | (2) |
 | (3) |
Consider a binary electrolyte (z1 = 1, z2 = −1) satisfying the electroneutrality condition (c1 = c2 = c). The concentration gradient attained at the limiting current density (jlim) (Fig. 2(B)) can be written as54
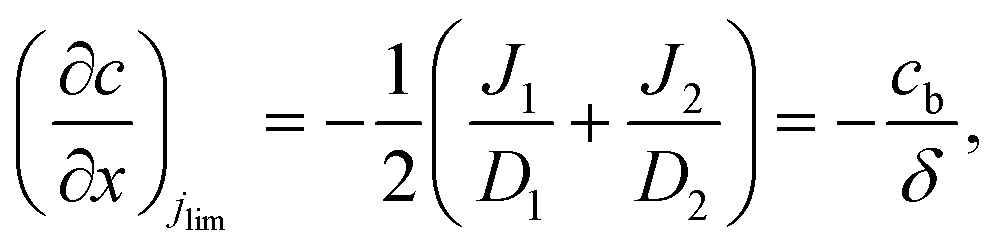 | (4) |
 | (5) |
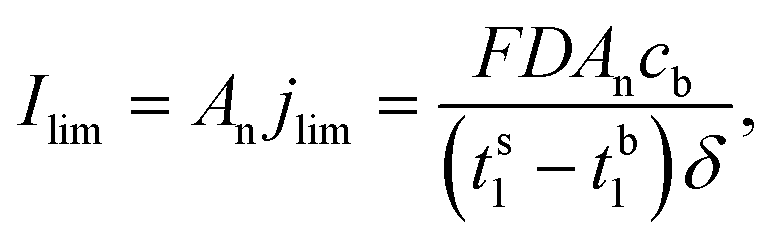
![[triple bond, length as m-dash]](https://www.rsc.org/images/entities/char_e002.gif) 2D1D2/D1 + D2 is the salt diffusion coefficient, ts1 J1/(J1 − J2) is the transport number of the cation in the membrane system, tb1 D1/(D1 + D2) is the transport number of the cation in the bulk solution, and An is the total area of the nanochannel openings; the limiting current is inversely proportional to the length of the DL. The electroosmotic slip in the convection term of the ionic mass flux (J) expression appears in the presence of an electric field normal (En) to the nanoslot openings. This electric field, contributing to a field-induced ESC layer, in combination with a tangential electric field (Et) acting on the field-induced space charges, leads to a nonlinear electroosmotic velocity of the second kind (veo2):17
2D1D2/D1 + D2 is the salt diffusion coefficient, ts1 J1/(J1 − J2) is the transport number of the cation in the membrane system, tb1 D1/(D1 + D2) is the transport number of the cation in the bulk solution, and An is the total area of the nanochannel openings; the limiting current is inversely proportional to the length of the DL. The electroosmotic slip in the convection term of the ionic mass flux (J) expression appears in the presence of an electric field normal (En) to the nanoslot openings. This electric field, contributing to a field-induced ESC layer, in combination with a tangential electric field (Et) acting on the field-induced space charges, leads to a nonlinear electroosmotic velocity of the second kind (veo2):17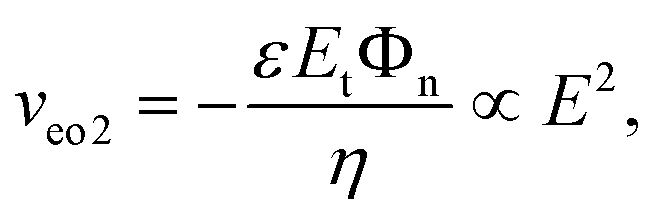 | (6) |
In summary, as mentioned above, studies on ICP, the I–V curve, the nonequilibrium EDL, the ionic mass flux, and the diffusion flux have been conducted for ion-selective channels. To the best of the authors' knowledge, this is the first time that all these electrochemical and electrokinetic phenomena have been integrated to explain the electrokinetic trapping mechanism; the CV model and the dual-loop current monitoring system have been used, and they explain the evolution and behavior of electric currents during the preconcentration process, without requiring fluorescence-labeled molecules.
Experimental methods
Device fabrication
The preconcentration devices used in the study consisted of two microchannels cast in PDMS and 80 parallel glass-based nanoslots, which were perpendicularly bonded by an oxygen plasma treatment (Fig. 1(A) and (B)). The two microchannels were 50 μm wide and 16 μm deep, and they were spaced 50 μm apart at microchannel–nanoslot interfaces; the parallel nanoslots were 25 μm wide and 40 nm deep, and they were spaced 25 μm apart. The PDMS mold for microchannels was fabricated on a silicon wafer by using the inductively coupled plasma-reactive ion etching (ICP-RIE) process, and the nanochannels were fabricated by a standard wet etching process involving glass slides. For high cation selectivity in the nanoslots, 30 to 60 nm deep nanoslots were used in 1 mM phosphate buffered saline (0.1× PBS); the EDLs in the nanoslots overlapped with each other. For the effective formation of a depletion layer to span over the entire width of the upper microchannel, it is crucial to consider the number of nanoslots as well as the width and depth of the upper microchannel adjacent to the nanoslots.56Materials
To visualize the EKT mechanism and demonstrate label-free nanofluidic preconcentration through the dual-loop current monitoring approach, 5.8 nM fluorescence-labeled goat anti-mouse IgG (31569, Thermo Fisher Scientific, Rockford, IL, USA) with negative charges was added to 0.1× PBS at pH 7.8. The solution was injected into the microchannels in advance using a syringe pump (Fusion 200, Chemyx, Houston, TX, USA).Method development and experimental setup
The EKT mechanism of typical preconcentration devices, in which two microchannels are connected by cation-selective nanoslots/membranes, is yet to be clarified. To investigate the phenomena occurring in different stages of the mechanism,13 the dual-loop current monitoring system was developed, and it was used to describe the characteristics on the left and right sides of the ESC layer during the preconcentration process. By Kirchhoff's current law, the total electric current through the nanoslots (Inano) is the sum of the left loop current (Ileft) and the right loop current (Iright) (Fig. 1(E)). Therefore, the total current through the nanoslots determined by measuring the two loop currents individually provides an opportunity to acquire more information about the two circuits. It is worth noting that some capacitive elements, such as EDLs adjacent to the electrode/electrolyte interface and inside the nanoslots,17,57 are neglected in our simplified resistive model when supplying a DC voltage to the preconcentration chip.In the dual-loop current monitoring system, the NI-VISA interface (NI LabVIEW, National Instruments Corp., Austin, TX, USA) was used along with general purpose interface bus (GPIB) controllers (GPIB-USB-HS, National Instruments Corp., Austin, TX, USA) to control the GPIB instruments. Two picoammeters/voltage sources (Model 6487, Keithley Instruments Inc., Cleveland, OH, USA) were used as the GPIB instruments (Fig. 1(D)). In this study, all the phenomena were observed using an inverted epifluorescence microscope (IX71, Olympus Co., Tokyo, Japan) and captured by a CCD camera (QImaging Micropublisher 3.3 RTV, Surrey, BC, Canada) with image capture software (Image-Pro Express version 5.1, Media Cybernetics, Silver Spring, MD, USA). All images were analyzed using image analysis software (ImageJ version 1.47, NIH, Bethesda, MD, USA).
Demonstration of functionality of cation-selective nanoslots
The appearance of ion-selective characteristics of channels depends on whether the EDLs of the solid surfaces overlap. To observe ion selectivity and the related ICP phenomenon, the I–V curves of the channels were used to detect their ion-selective function. Our devices (30–60 nm deep nanoslots) filled with different concentrations of PBS (1 mM, 100 μM, and 10 μM) were demonstrated to show cation selectivity, as shown in Fig. 3. Three curves were obtained by sweeping a DC voltage across reservoirs 1 and 4 from 0 to 200 V (reservoirs 2 and 3 were kept floating), and they could be separated based on three distinguishable regimes: an ohmic regime with slope m, a limiting regime, and an overlimiting regime.33 When the ICP layer in the overlimiting regime sustains a thinner DLde and has a higher ionic conductivity compared to the ohmic regime, the slope of the curve may be higher than that in the ohmic regime.58 Moreover, the pH value of the solution (the concentration of PBS) decides the thickness of the EDL, and therefore, the depths of the 1D nanoslots should be of concern.20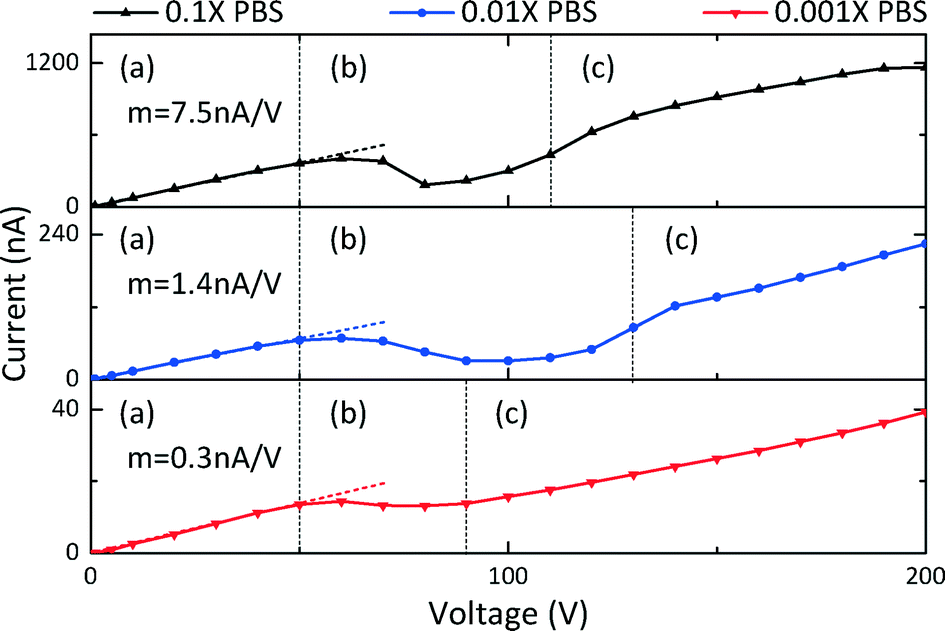 | ||
| Fig. 3 Current–voltage curves of parallel cation-selective nanoslots for different PBS concentrations. (a) The ohmic regime with slope m, (b) limiting current regime, and (c) overlimiting current regime. | ||
Demonstration of functionality of preconcentration devices
Two-step methods for checking the functionality of the preconcentration devices and the optimized value of the operational voltage were developed. The first step in the functionality check was to acquire the I–V curves. DC voltages were applied across reservoirs 1 and 3 and across reservoirs 2 and 4 using four tungsten needles; the voltages were swept from 0 to 120 V (Fig. 1(D)). Typical I–V curves of a functional preconcentration device are shown in Fig. 4, and it is described below in detail. The second step, selecting the optimal operational voltage, involves analyzing the I–V curves obtained in the first step. The lowest operational voltage must be set above the onset voltage of the EOI (overlimiting regime) and must be sufficient to initiate the EKT mechanism within a short time, as discussed below (Fig. 6). However, the I–V curves and optimized operational voltages may vary, and their variation is relevant to the equivalent resistive model of the chip (Fig. 1(E)). In other words, at least three uncertain factors influence the ionic mass flux and the current densities of the nanoslots: the mismatched bonding of PDMS-based microchannels and glass-based nanoslots after the oxygen plasma treatment, the salt concentration gradients in the channels after the syringe pumping process, and the inhomogeneity of the nanoslots resulting from the imperfect wet etching process. Therefore, fixed operational voltages cannot be applied to every chip every time.13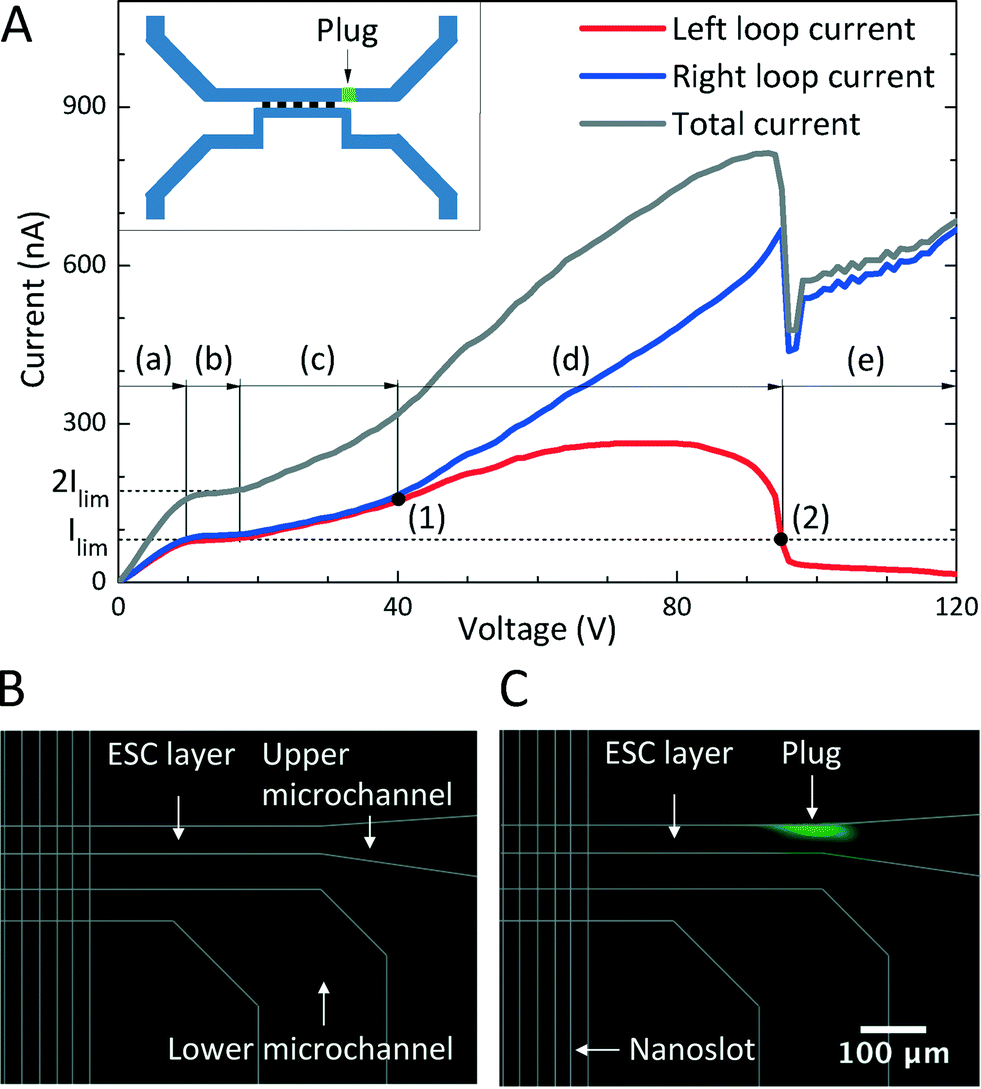 | ||
| Fig. 4 A. Real-time monitoring of dual-loop current by sweeping the voltage from 0 to 120 V in 1-V steps. (a) The ohmic regime, (b) limiting current regime, (c) overlimiting current regime, (d) current separation regime between (1) the current separation point and (2) the plug-appearing point, and (e) plug-appearing regime. B and C show images corresponding to the points before and after the plug appearing point, respectively. | ||
To develop a method for the manipulation of the EKT mechanism based on these uncontrollable factors, we propose that the voltage obtained in the two-step method be applied to the two circuits in comparison with the different voltages applied to the two circuits.13 When the same voltage is maintained in the left and right circuits, the EKT mechanism is initiated once the tangential electric potential gradients in the ESC layer contribute to the EOI and the nanoslot-induced backflow. The instabilities change the two-direction flows, both toward the nanoslots, of the upper microchannel into the unidirectional flow (Fig. 1(C) and 5). Negatively charged molecules follow the upper-stream flow until they are plugged outside the boundary of the ESC layer, i.e., they become the preconcentrated plug.
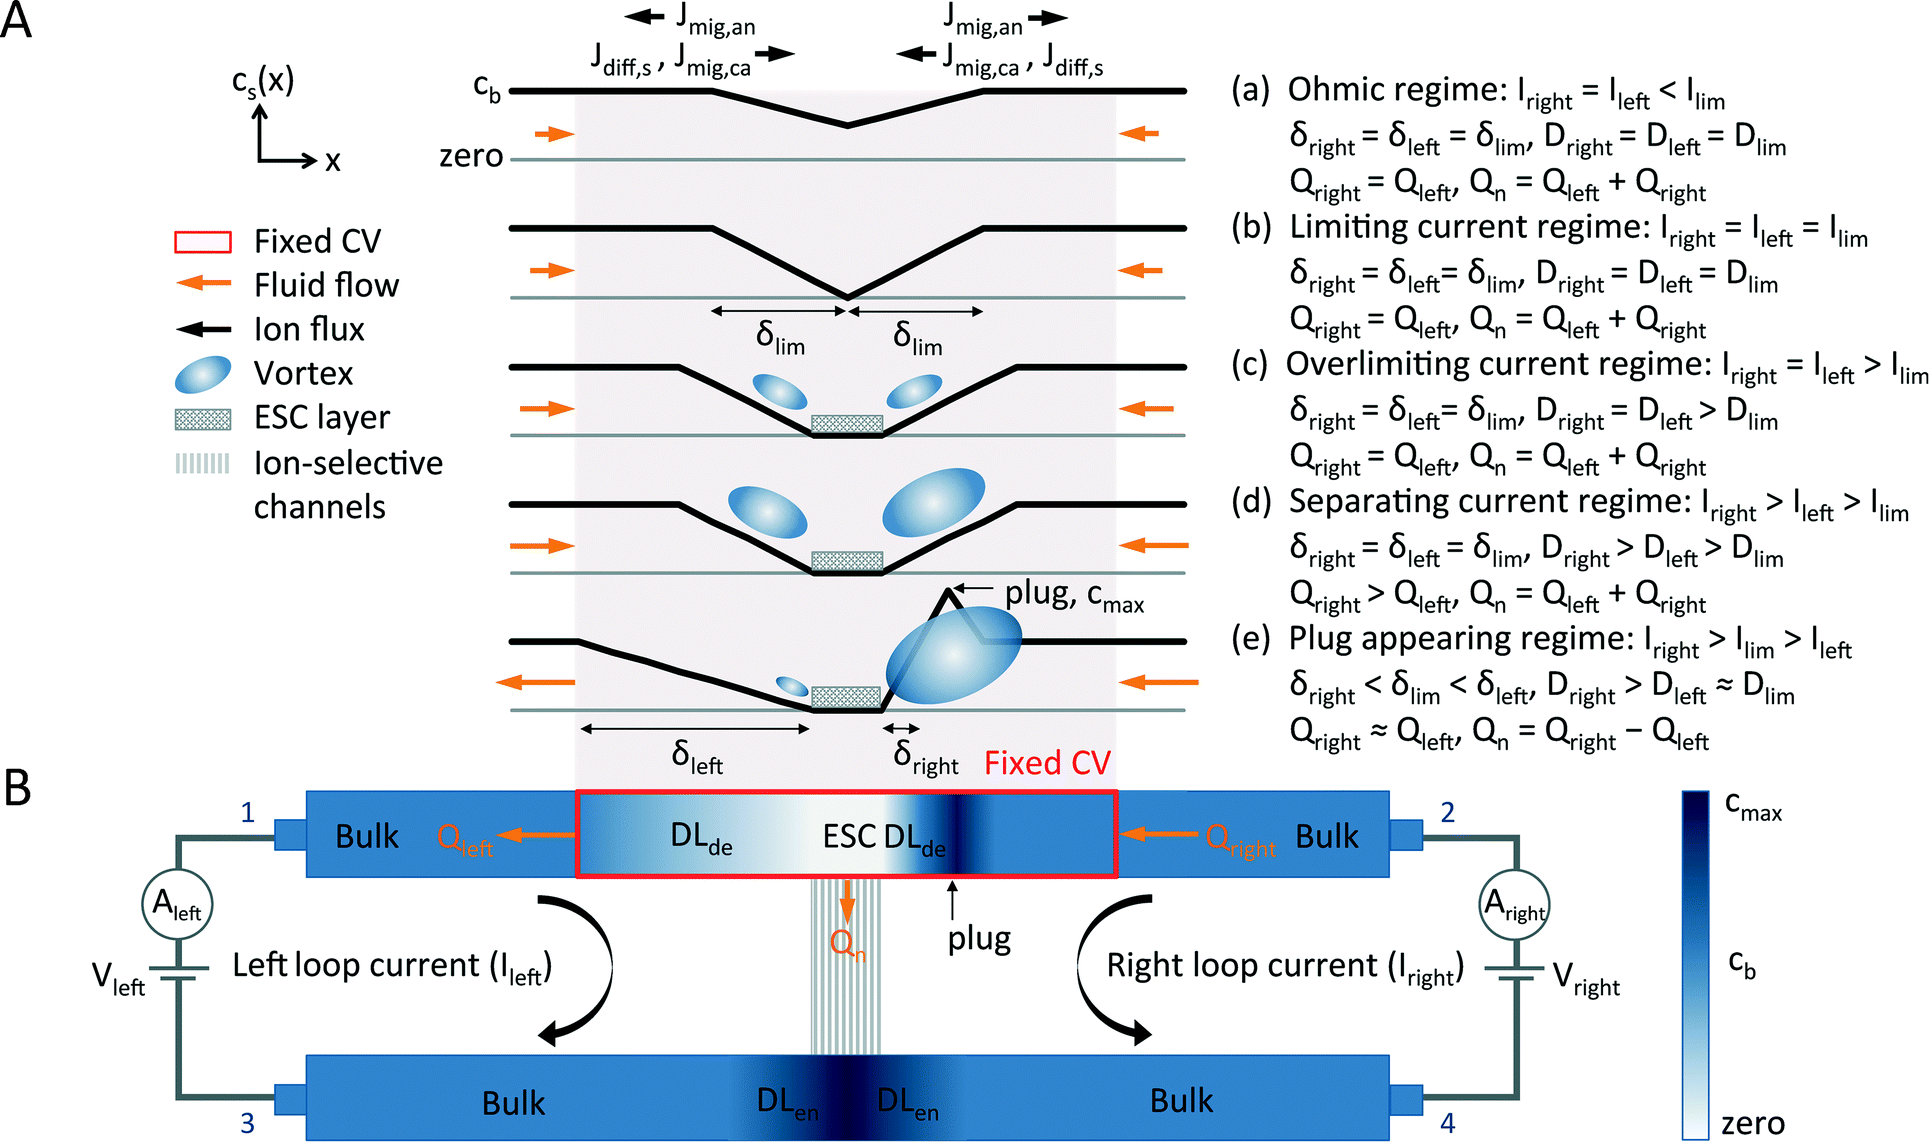 | ||
| Fig. 5 Characteristics of the five stages during the preconcentration process, determined by using control volume analysis for fluid flows. A. A schematic of ion concentration profiles and field-induced vortices in the upper microchannel at different stages of the preconcentration process. B. A simplified schematic illustrating in/outflows for a fixed CV and ion concentration polarization in the plug-appearing regime. | ||
However, the optimal operational voltage is not high for three reasons. First, strong EOI has been observed under higher electric potential gradients,33 which were at least 30 times greater than that in the buffer zone,15 and the EOI renders the current densities regularly or irregularly unstable.32 Second, in high electric potential gradients (25 V μm−1),19 junction gap breakdowns of PDMS/glass near the ESC layer can easily occur, thereby destroying the structure and changing the characteristics of the chip. Third, high electric potential gradients may influence the conformations and the related properties of the biomolecules and generate more heat and gas bubbles near the operational electrodes.1 Thus, we modified our chip design by using optimized resistive models59 and set the onset of the EKT mechanism below 120 V, i.e., the potential gradients were below 0.5 V μm−1 in the nanoslots and 5 mV μm−1 in the microchannels. Accordingly, a potential gradient that is at least 50 times less than the potential gradient of the junction gap breakdowns is achieved.
Results and discussion
Real-time dual-loop current monitoring of preconcentration devices with characteristic current–voltage curves
In the two-step method described above, a functional preconcentration device has characteristic I–V curves, which can be described by two simple phenomena (Fig. 4). Because of the ICP phenomenon near the cation-selective nanoslots upon the passage of electric currents, a typical S-curve can be observed in Fig. 4(A) (a)–(c), with ohmic, limiting, and overlimiting current regimes. Because of the onset of the EKT mechanism, the direction-changing fluid flows in the upper microchannel influence the ionic mass flux and current densities in the nanoslots within the two circuits. Consequently, current separation and plug-appearing regimes can be observed in Fig. 4(A) (d) and (e). The five stages of the preconcentration process can be successfully observed in time order by sweeping the voltage applied across reservoirs 1 and 3 (left circuit) and across reservoirs 2 and 4 (right circuit) from 0 to 120 V in 1-V steps. Each value in the I–V curves is the average of 10 data with a sampling rate of approximately 1.4 Hz.Initially, when the applied voltage was below the limiting current threshold voltage (Vlim), the electric current was below the limiting current (Ilim) and the chip was operated in the ohmic regime (Fig. 4(A) (a)). The two loop currents increased in proportion to and with the applied voltage because of the diffusion-dominated ionic mass flux, as in eqn (3).53 The aforementioned factors that are uncontrollable during the fabrication process and the sample preparation process caused the two circuits to have slightly different properties, and therefore, the two circuits have different equilibrium resistive models and different electrical conductances. Therefore, minor differences (approximately 10 nA) between the two loop currents could be consistently observed; the right loop current was slightly higher than the left loop current, which implied that the current density (j), ionic mass flux (J), electric field (E), electroosmotic velocity (veo), and volume flow rate (Q) in the right circuit were slightly higher than those in the left circuit, as in eqn (1)–(3). Besides, the two flow directions in the upper microchannel were directed from the reservoirs to the nanoslots (from reservoir 1 to opening 5 and from reservoir 2 to opening 5) (Fig. 1(D)).
When the applied voltage becomes high, the electric currents saturate at the limiting current value (Ilim) according to the diffusion-limited transportation theory;41 the chip is then operated in the limiting current regime (Fig. 4(A) (b)). As the applied voltage is above the overlimiting threshold voltage (Vss), the normal component of the electric field (En) induces the appearance of an ESC layer and the tangential component of the electric field (Et) in the ESC layer triggers nonequilibrium electroosmotic slips at the openings of the nanoslots; the slips destroy the depleted DLs, contribute to the overlimiting current phenomenon, and cause the chip to operate in the overlimiting current regime (Fig. 4(A) (c)).
The destruction of the depleted DLs in both the left and right circuits, which differed in extent in the two circuits, originated from the uncontrollable factors as the applied voltage increased. It can therefore be inferred that different electroosmotic velocities of the second kind (veo2) dominated the destruction, and these velocities were proportional to the electric fields (E) adjacent to the nanoslots, as in eqn (6). In other words, the effective diffusion coefficients in the left and right circuits were different and proportional to the electric currents, as in eqn (5), and if it is supposed that the thicknesses of the depleted DLs are constant,55 then the concentration difference between the bulk and the ESC layer is also constant. Hence, the two similar I–V curves of the two circuits began to separate at approximately 45 V, which was referred to as the current separation point (Fig. 4(A) (1)).
As the applied voltage increases considerably in the current separation regime (Fig. 4(A) (d)), the difference between the two loop currents gradually increases (from 10 to approximately 500 nA). Because a higher electric current value implies a higher volume flow rate, the right circuit shows a considerably higher volume flow rate (Qright) (directed from reservoir 2 to opening 5) compared to the left circuit (Qleft) (directed from reservoir 1 to opening 5) at the end of the current separation regime. In this situation, the fluid flow in the right circuit is overwhelmingly greater than that in the left circuit, and consequently, the fluid flow direction in the left circuit is reversed (directed from opening 5 to reservoir 1). The inverse fluid flow (Qleft) renders the passage of the ionic mass in the upper-left microchannel passing through the nanoslots more difficult. Therefore, the left loop current decreases rapidly and considerably, and it decreases below the limiting current (Ilim ≈ 100 nA in this case). Because of the fluid flowing from the right to the left in this stage and because of the ESC layer preventing the charged molecules from passing through, many ions in the upper-right microchannel rapidly accumulate at the right side boundary of the ESC layer and the preconcentrated plug is formed; the plug formation instant is referred to as the plug-appearing point (approximately 95 V) (Fig. 4(A) (2)). In the plug-appearing regime (Fig. 4(A) (e)), both the right and left loop currents decrease in the beginning because of the onset of the EKT mechanism, which leads to the appearance of the nanoslot-induced backflow. Eventually, the right loop current continuously increases because of more ions being transported per unit time from reservoir 2 passing through the nanoslots, and the left loop current continuously decreases because of fewer ions passing through the nanoslots per unit time in the direction opposite to the upper-stream direction.
In general, the trend at the beginning of the I–V curves can predict the preconcentrated plug formation site. Fig. 4(A) shows that the right circuit has a slightly higher electric current in the beginning; the circuit possesses a higher electric field, flow velocity, and higher volume flow rate. Consequently, it can be forecast that stronger nonequilibrium electroosmosis flow (EOF)-induced EOI may occur and destroy the DLde more severely in the right circuit, which would contribute to a considerably higher loop current. Therefore, we can predict that the preconcentrated plug is likely to form at the right boundary of the ESC layer in the beginning of the preconcentration process. In the experiments performed in the present study, the nanoslot-induced backflow and the EOI in the upper microchannel lead to bidirectional fluid flows, directed from the reservoirs toward the nanoslots, being reduced to unidirectional fluid flow, directed from one reservoir to the other. The preconcentrated plug is formed on the side of the dominant current (right loop current in this case). To visualize and validate the dual-loop current monitoring system for the EKT mechanism, 5.8 fM fluorescence-labeled IgG was added to PBS. Fluorescence microscope images acquired before and after the formation of the preconcentrated plug are shown in Fig. 4(B) and (C). To simplify the preconcentration process, the transient changes in the I–V curves of the two circuits were explained as the effects of the changes in the diffusivity or thickness of the depleted DLs involved in the control volume model.
Control volume model for five-stage preconcentration process
The CV model clarifies the EKT mechanism of working preconcentration devices consisting of two microchannels bridged by ion-selective solids during the preconcentration process. The salt concentration profiles and EOI-induced vortical motions in the five stages—the ohmic, limiting current, overlimiting current, current separation, and plug-appearing regimes—of the preconcentration process have elucidated the characteristic I–V curves of the dual-loop current monitoring system (Fig. 5). Our CV model considers two primary parameters, the diffusion coefficient (D) and the depleted DL thickness (δ). During the five-stage pre-concentration process, the diffusivities in depleted DLs may vary because of different nonlinear electroosmotic velocities; the EOI is responsible for the different velocities. In addition, once the EKT mechanism is initiated, one of the flows in the upper microchannel is reversed. Subsequently, this flow reversal forces the depleted DL redistribution and increases the thickness of the downstream DLde. The symbols used in Fig. 5 are as follows. The salt concentrations, including cation and anion concentrations, in the upper microchannel are denoted by cb in the bulk, cmax in the preconcentrated plug, and zero in the ESC layer. The subscripts “ca”, “an,” and “s” refer to the cation, anion, and salt, respectively; “diff” and “mig” refer to diffusion and migration, “de” and “en” refer to depleted and enriched, and “left”, “right,” and “n” refer to the left circuit, the right circuit, and the nanoslots.To simplify our model, first, we suggest that the fixed CV enclose any ESC layer, depleted DL, and vortex motion. Second, we ignore any minor changes in the thickness of the electric field-induced depleted DL,26 but consider the major changes in the thickness of the depleted DL affected by fluid flow, which are observed in our experiment. Third, a more rapid vortex provides a higher effective diffusivity.60,61 The velocity of nonequilibrium EOF, proportional to the magnitudes of the local tangential and normal electric fields, dominates the size and velocity field of the vortex pairs, while the size of a vortex pair can be restricted by the finite space of the microchannel.26 In addition, the cation flux (Jleft, Jright) is equal to the sum of the migration flux (Jmig) and diffusion flux (Jdiff).
In the first three stages (Fig. 5(A) (a)–(c)), the volume flow rates (Qleft and Qright) and electric currents (Ileft and Iright) in the upper left and upper right microchannels are nearly identical and all currents flow into the fixed CV. Initially, in the ohmic regime, the concentration at the center of the CV decreases as the applied voltage becomes high; the concentration eventually becomes zero. The electrochemical analog of the diffusion-dominated ionic mass flux shows a linear relationship between the electric current and the applied voltage (Fig. 5(A) (a)). In the limiting current regime, the currents in the two loops (Ileft, Iright) are restricted to the limiting current value (Ilim) because the thicknesses of the DLs, the diffusion coefficients in the DLs, and the concentration differences across the DLs are constant, as in eqn (6). However, when the applied voltage exceeds the instability threshold voltage Vss, a nonequilibrium ESC layer is formed adjacent to the nanoslots and vortices are induced in the two depleted DLs. Therefore, the current values in the two circuits exceed the limiting current value and the diffusion coefficients in the depleted DLs (Dleft, Dright) exceed those in the limiting current regime (Dlim). Hence, the process goes into the overlimiting current regime.
In the remaining two stages (Fig. 5(A) (d) and (e)), the ionic mass flux and the volume flow rates in the upper left and upper right microchannels are distinct, leading to an extremely large difference between the two loop currents. First, in the current separation regime, different vortical motions arise in the two depleted DLs, and they result in different diffusivities in the DLs, which forces current values in two circuits to differ considerably, shown in eqn (3) and Fig. 4. The fluid flow directions in this stage are the same as in those before the plug-appearing regime until the onset of the EKT mechanism. Second, when the applied voltage increases over time, the volume flow rate in the upper-right microchannel is considerably higher than that in the left because of dissimilar electric field profiles. It is believed that when the dynamic volume flow rate in the nanoslots is less than the sum of those in the upper left and upper right microchannels, a high volume flow rate in the upper-right microchannel is capable of reversing the upper-left flow and contributes to an overall right-to-left fluid flow that maintains fluid continuity during the nanoslot-induced backflow;15 the process eventually enters the plug-appearing regime. In the final stage, positively charged molecules pass through the ESC layer and are likely to penetrate the nanoslots because of the electric field distribution; negatively charged molecules transported by the right-to-left fluid flow are accumulated and trapped outside the ESC layer since (i.e., the assumption has been made that) none of the anions can pass through the cation-selective nanoslots. Hence, a million-fold preconcentrated molecular plug is produced at the upper-steam boundary of the ESC layer. To understand the distinct properties of the two circuits in this stage (Fig. 4(A)), it is important to consider the fluid conditions in the upper microchannel. The right-to-left flow is deionized as it passes through the CV with 99% salt rejection and become desalted15,23 (i.e., fresh water14). The desalted upper-left flow, directed from opening 5 to reservoir 1, is opposite to the cation flux (Jdiff,s, Jmig,ca), which is directed from reservoir 1 to opening 5. This difference in flow directions results in the DLde (δleft) in the upper-left microchannel being considerably thicker than that for the limiting current (δlim), and a decreased cation mass flux through the nanoslots in the left circuit. Consequently, the right-to-left flow compels the left loop current to decrease below the limiting current value (Ilim) and to gradually reach 10 nA. In this study, this phenomenon is used to check whether the EKT mechanism is initiated. It is worth noting that although the upper-left ionic mass flux (Jleft) is opposite to the right-to-left fluid flow (Qleft), it contributes to an overall clockwise electric current in the left circuit, albeit with a much lower value than that in the right circuit. By using the CV model along with the expressions for changing diffusivities and depleted DL thicknesses, clear explanations for the dissimilar loop current values during the five-stage preconcentration process have been provided.
Real-time monitoring for onset time of the electrokinetic trapping mechanism
It is difficult to select suitable applied voltages for operating the EKT-based preconcentration devices, especially when the initial concentration of fluorescence-labeled samples is low; for a low concentration, the time required to detect the onset of the EKT mechanism is long since the slight glitter in the preconcentrated plug should be perceived, not to mention the possibility of the mechanism being absent. Hence, we studied the typical onset curves of the EKT mechanism for label-free preconcentration purposes by applying fixed voltages to the two circuits (Fig. 6). To simplify the voltage adjustment, the same voltage is applied to both circuits mentioned above and should meet the following requirements. To form an ESC layer that can trap molecules, the lowest applied voltage in the overlimiting current regime is approximately 18 V (Fig. 4(A)). To initiate the EKT mechanism while the fluid flow in the upper microchannel is directed from one reservoir to the other (Fig. 5), the electric fields in the upper left and the upper right microchannels adjacent to the ESC layer should differ by a sufficient amount. Fig. 6 shows applied voltages above 30 V in the chip for which the above two requirements are satisfied. The inset in Fig. 6 shows two real-time current curves. Following the onset of the EKT mechanism, the nanoslot-induced backflow results in the two loop currents decreasing simultaneously, and the subsequent overall unidirectional fluid flow forces the down-stream loop current to decrease considerably and below the limiting current. In this study, we defined the onset time of the EKT mechanism as the time at which one of the two loop currents decreases below the limiting current (Ilim ≈ 100 nA). A plot of the applied voltage (from 30 to 100 V) versus the onset time of the EKT mechanism is shown in Fig. 6. At 30 V, the voltage (approximately 18 V) required to generate the ESC layer is the minimum, but a long time (approximately 210 s) is required to increase the difference between the electric fields on the two sides of the ESC layer. For applied voltages greater than 30 V, the onset time of the EKT mechanism is approximately 10 s. However, over time, the evolutions of the two loop currents, whether they become regular or irregular and unstable, completely depend on the behavior of the molecular plug. | ||
| Fig. 6 Onset time of the preconcentrated plug at different applied voltages. The inset shows the time evolutions of two loop currents at an applied voltage of 50 V. | ||
Real-time monitoring for multiple operational modes of electric currents and preconcentrated molecular plug
Previously, Rubinstein et al. used numerical calculations33 to derive the nonequilibrium electroosmotic slip condition for an ideal cation-selective membrane. It was shown that the slip leads to the instability of the quiescent electrodiffusion by generating electroconvective motions and results in the destruction of the depleted diffusion layer (DLde) and an increase in the ionic mass flux. According to the overlimiting current curve in Fig. 2(A), the behaviors of electric currents and corresponding flow streamlines can be divided into three types, depending on the fixed applied voltage: (i) steady-state current and vortices (Vss < V < Vosc), (ii) regular oscillations of the current and vortices (Vosc < V < Vnoise), and (iii) irregular oscillations of the current and vortices (V > Vnoise). However, in practice, although the applied voltage is fixed, the local electric field in the ESC layer adjacent to the inhomogeneous parallel nanoslots varies and typically increases over time. This high local electric field results in the electroconvective vortices gradually changing from a steady state to regular oscillations or irregular oscillations. These phenomena not only influence the motion, shape, and formation site of the preconcentrated plug but also change the electric currents in the parallel nanoslots. Furthermore, in this study, apart from the instability of concentration polarization in the depletion layer, the fluid flow directions in the upper microchannel, described in Fig. 5 and 6, influenced the time evolutions of the loop currents.When the electric field (E) in the ESC layer exceeds the instability threshold electric field (Eosc), which corresponds to Vosc, the stable streamlines transit to a new steady state through nonmonotonic re-adjustment of the shape and size of the viscous vortices;33 this transition manifests as periodic oscillations in the right loop current and preconcentrated plug.
However, the left loop current is stable, i.e., in the regular oscillation mode (Fig. 7(A) (a)), with a frequency of 99 ± 9 mHz and a peak-to-peak value of 4.5 ± 1.4 nA. When the electric field in the ESC layer increases (E > Enoise), the streamlines of the steady-state nonmonotonic vortices cease to exist. The nonequilibrium EOF competing with the unstable nanoslot-induced backflow results in the growth of the oscillation magnitude of the preconcentrated plug. The evolving right loop current shows a quasi-triangular waveform and its amplitude increases with time; by contrast, the left loop current is stable, i.e., in the growing oscillation mode (Fig. 7(A) (b)), with a frequency of 87 ± 9 mHz and a peak-to-peak value 12–293 nA. The high-amplitude vortices in the depleted diffusion layer drag the preconcentrated plug back and forth; the plug is increasingly fluctuated in a periodic manner. When the depletion layer cannot span the entire width of the upper microchannel, asymmetric nonequilibrium nanofluid-induced backflow15,40 occurs. As a result, part of the preconcentrated plug leaks through the junction of the nanoslots and transports a high concentration of both cations and anions to the downstream. The leakage supports the flow of high ion fluxes through the downstream nanoslots and results in a peak current in the left circuit. The regenerated preconcentrated plug bursts with a frequency of 73 ± 9 mHz and generates a peak value in each period (the burst mode) (Fig. 7(A) (c) and (B)); the peak-to-peak amplitude of the right loop current is 167–451 nA. In the burst mode, the preconcentrated plug continues to oscillate and leak. Because of the leakages, the concentration of the preconcentrated plug gradually decreases. This decrease leads to a decrease in the concentration gradient, and the local electric field (E) in the ESC layer adjacent to the preconcentrated plug is in the range Ess < E < Eosc. Consequently, the vortices become stable and the amplitudes of currents in both circuits are damped when the plug is in the quasi-steady state mode (Fig. 7(A) (d)), similar to the trend in the quasi-steady state shown in the inset in Fig. 6.
 | ||
| Fig. 7 A. Time evolutions of dual-loop current depicting four behaviors of the preconcentrated plug. (a) Regular oscillation, (b) growing oscillation, (c) burst, and (d) quasi-steady-state modes, observed at an applied voltage of 100 V. B. Series of images of a regenerated preconcentrated plug traced in a 14 s period in the burst mode. | ||
The curves in Fig. 7(A) can be explained as a result of transient changes in the diffusivities of the depleted diffusion layers, as in eqn (3) and as illustrated in Fig. 5(A). When the molecular plug oscillates because of the EOF of the second kind, the mixing movement enhances the nearby diffusivity in nanoslots and influences the electric currents. When the plug is pushed forward and pulled backward relative to the ESC layer repeatedly because of the motions of vortices, the electric current increases and decreases; that is, as the high-concentration molecular plug proceeds from a reservoir to openings, it increases the diffusivity and electric current. In contrast, as the plug proceeds from openings to a reservoir, the relocated ESC layer with nearly zero concentration adjacent to openings decreases the diffusivity and electric current. In each period of the burst mode (Fig. 7(B)), a plug with increasing concentration is formed in the upper stream and numerous ions passing through the ESC layer are transported from the upper stream to the lower stream; thus, the burst mode influences both electric currents similarly. The evolution cycle in Fig. 7 may repeat due to the dynamic instability of the EOI.
Conclusion
A label-free EKT-based nanofluidic preconcentration device has been developed by using a real-time dual-loop current monitoring system. In summary, we propose universal I–V characteristic curves of two circuits for functionality testing and feature the validation of typical EKT-based nanofluidic preconcentration devices consisting of two microchannels connected by ion-selective channels. The CV model that considers two primary parameters—the diffusion coefficient and the depleted diffusion layer thickness—successfully describes the electric currents in the two circuits and explains the EKT mechanism. By analyzing the I–V curves and real-time current curves, many features of the devices were ascertained. First, the basic S-shaped I–V curve of parallel ion-selective nanoslots—showing the ohmic, limiting current, and overlimiting current regimes—shows the cation selectivity. Second, the five-stage preconcentration process, consisting of the aforementioned three regimes along with the current separation and plug-appearing regimes, validates the preconcentration function and indicates the lowest operational voltage that guarantees the appearance of the ESC layer, which traps molecules. Third, the universal real-time onset curves indicate the appearance of the EKT mechanism, and the use of fluorescence-labeled molecules for observing the preconcentrated plug is not required. Once the currents of the two circuits decrease simultaneously and one of the two loop currents decreases below the limiting current value, the EKT mechanism is initiated. Fourth, the curve of the onset time of the EKT mechanism versus the operational voltage indicates the lowest optimal applied voltage. Finally, based on different degrees of oscillation in both electric currents and the plug, four basic modes that explain the steady state, regular oscillations, and irregular oscillations of the two loop currents and the corresponding behaviors of the preconcentrated plug have been presented. To the best of the authors' knowledge, this is the first time that the capability of the dual-loop current monitoring system to control the preconcentration process and to elucidate the behaviors of the trapped molecular plug, without the requirement of fluorescence labeling, has been demonstrated.Acknowledgements
We thank our co-workers, who participated in this study, and acknowledge the grants from the College of Electrical Engineering and Computer Science of the National Taiwan University (103R7624-2; Academic Excellent Program, Ministry of Education, Taiwan), the National Science Council of Taiwan (102-2627-E-002-002), and the Kaohsiung Medical University (103E31011; Academia Sinica, Taiwan), which supported this work.References
- D. Mark, S. Haeberle, G. Roth, F. von Stetten and R. Zengerle, Chem. Soc. Rev., 2010, 39, 1153–1182 RSC.
- G. M. Whitesides, Nature, 2006, 442, 368–373 CrossRef CAS PubMed.
- D. R. Reyes, D. Iossifidis, P. A. Auroux and A. Manz, Anal. Chem., 2002, 74, 2623–2636 CrossRef CAS.
- S. J. Kim, Y. A. Song and J. Han, Chem. Soc. Rev., 2010, 39, 912–922 RSC.
- M. Shen, H. Yang, V. Sivagnanam and M. A. Gijs, Anal. Chem., 2010, 82, 9989–9997 CrossRef CAS PubMed.
- A. N. Chatterjee, D. M. Cannon, E. N. Gatimu, J. V. Sweedler, N. R. Aluru and P. W. Bohn, J. Nanopart. Res., 2005, 7, 507–516 CrossRef CAS.
- J. Lichtenberg, N. F. de Rooij and E. Verpoorte, Electrophoresis, 2002, 23, 3769–3780 CrossRef CAS.
- H. Cui, K. Horiuchi, P. Dutta and C. F. Ivory, Anal. Chem., 2005, 77, 7878–7886 CrossRef CAS PubMed.
- R. D. Oleschuk, L. L. Shultz-Lockyear, Y. B. Ning and D. J. Harrison, Anal. Chem., 2000, 72, 585–590 CrossRef CAS.
- B. Jung, R. Bharadwaj and J. G. Santiago, Anal. Chem., 2006, 78, 2319–2327 CrossRef CAS PubMed.
- S. Song, A. K. Singh and B. J. Kirby, Anal. Chem., 2004, 76, 4589–4592 CrossRef CAS PubMed.
- Q. S. Pu, J. S. Yun, H. Temkin and S. R. Liu, Nano Lett., 2004, 4, 1099–1103 CrossRef CAS.
- Y. C. Wang, A. L. Stevens and J. Han, Anal. Chem., 2005, 77, 4293–4299 CrossRef CAS PubMed.
- S. J. Kim, S. H. Ko, K. H. Kang and J. Han, Nat. Nanotechnol., 2010, 5, 297–301 CrossRef CAS PubMed.
- S. J. Kim, L. D. Li and J. Han, Langmuir, 2009, 25, 7759–7765 CrossRef CAS PubMed.
- Y. C. Wang and J. Han, Lab Chip, 2008, 8, 392–394 RSC.
- R. B. Schoch, J. Y. Han and P. Renaud, Rev. Mod. Phys., 2008, 80, 839–883 CrossRef CAS.
- S. J. Kim and J. Han, Anal. Chem., 2008, 80, 3507–3511 CrossRef CAS PubMed.
- J. H. Lee, S. Chung, S. J. Kim and J. Han, Anal. Chem., 2007, 79, 6868–6873 CrossRef CAS PubMed.
- S. J. Kim, Y. C. Wang, J. H. Lee, H. Jang and J. Han, Phys. Rev. Lett., 2007, 99, 044501 CrossRef.
- V. Liu, Y. A. Song and J. Y. Han, Lab Chip, 2010, 10, 1485–1490 RSC.
- J. H. Lee and J. Han, Microfluid. Nanofluid., 2010, 9, 973–979 CrossRef CAS PubMed.
- R. Kwak, S. J. Kim and J. Han, Anal. Chem., 2011, 83, 7348–7355 CrossRef CAS PubMed.
- C. L. Druzgalski, M. B. Andersen and A. Mani, Phys. Fluids, 2013, 25, 110804 Search PubMed.
- E. A. Demekhin, N. V. Nikitin and V. S. Shelistov, Phys. Fluids, 2013, 25, 122001 CrossRef PubMed.
- H. C. Chang, G. Yossifon and E. A. Demekhin, Annu. Rev. Fluid Mech., 2012, 44, 401–426 CrossRef.
- S. M. Rubinstein, G. Manukyan, A. Staicu, I. Rubinstein, B. Zaltzman, R. G. Lammertink, F. Mugele and M. Wessling, Phys. Rev. Lett., 2008, 101, 236101 CrossRef CAS.
- B. Zaltzman and I. Rubinstein, J. Fluid Mech., 2007, 579, 173–226 CrossRef.
- X. Jin, S. Joseph, E. N. Gatimu, P. W. Bohn and N. R. Aluru, Langmuir, 2007, 23, 13209–13222 CrossRef CAS PubMed.
- I. Rubinstein, B. Zaltzman and I. Lerman, Phys. Rev. E: Stat., Nonlinear, Soft Matter Phys., 2005, 72, 011505 CrossRef.
- F. C. Leinweber and U. Tallarek, Langmuir, 2004, 20, 11637–11648 CrossRef CAS PubMed.
- I. Rubinstein and B. Zaltzman, Math. Models Methods Appl. Sci., 2001, 11, 263–300 CrossRef CAS.
- I. Rubinstein and B. Zaltzman, Phys. Rev. E: Stat. Phys., Plasmas, Fluids, Relat. Interdiscip. Top., 2000, 62, 2238–2251 CrossRef CAS.
- I. Rubinstein and F. Maletzki, J. Chem. Soc., Faraday Trans., 1991, 87, 2079 RSC.
- I. Rubinstein and L. Shtilman, J. Chem. Soc., Faraday Trans. 2, 1979, 75, 231–246 RSC.
- P. Mao and J. Han, Lab Chip, 2009, 9, 586–591 RSC.
- J. H. Lee, Y. A. Song, S. R. Tannenbaum and J. Han, Anal. Chem., 2008, 80, 3198–3204 CrossRef CAS PubMed.
- J. H. Lee, Y. A. Song and J. Han, Lab Chip, 2008, 8, 596–601 RSC.
- K.-B. Sung, K.-P. Liao, Y.-L. Liu and W.-C. Tian, Microfluid. Nanofluid., 2013, 14, 645–655 CrossRef CAS.
- P. S. Chung, Y. L. Liu, K. P. Liao, Y. J. Fan, K. B. Sung, H. J. Sheen and W. C. Tian, in MicroTAS 2013, Freiburg, Germany, 2013, pp. 1403–1405 Search PubMed.
- V. G. Levich, Physicochemical hydrodynamics, Prentice-Hall, 1962 Search PubMed.
- V. V. Nikonenko, N. D. Pismenskaya, E. I. Belova, P. Sistat, P. Huguet, G. Pourcelly and C. Larchet, Adv. Colloid Interface Sci., 2010, 160, 101–123 CrossRef CAS PubMed.
- C. Larchet, S. Nouri, B. Auclair, L. Dammak and V. Nikonenko, Adv. Colloid Interface Sci., 2008, 139, 45–61 CrossRef CAS PubMed.
- I. Rubinshtein, B. Zaltzman, J. Pretz and C. Linder, Russ. J. Electrochem., 2002, 38, 853–863 CrossRef CAS.
- J. A. Manzanares, W. D. Murphy, S. Mafe and H. Reiss, J. Phys. Chem., 1993, 97, 8524–8530 CrossRef CAS.
- V. V. Nikonenko, V. I. Zabolotsky and N. P. Gnusin, Sov. Electrochem., 1989, 25, 301 CAS.
- A. Listovnichy, Elektrokhimiya, 1989, 25, 1651–1658 Search PubMed.
- S. S. Dukhin, Adv. Colloid Interface Sci., 1991, 35, 173–196 CrossRef CAS.
- G. Yossifon and H. C. Chang, Phys. Rev. Lett., 2008, 101, 254501 CrossRef.
- K. D. Huang and R. J. Yang, Electrophoresis, 2008, 29, 4862–4870 CrossRef CAS PubMed.
- G. Karniadakis, A. Beskok and N. Aluru, Microflows and Nanoflows: Fundamentals and Simulation, Springer, 2005 Search PubMed.
- H. H. Girault, Analytical and Physical Electrochemistry, EPFL Press, 2004 Search PubMed.
- I. Rubinstein, Physical Electrochemistry: Science and Technology, Marcel Dekker, New York, 1995 Search PubMed.
- K. Kontturi, S. Mafe, J. A. Manzanares, L. Murtomaki and P. Viinikka, Electrochim. Acta, 1994, 39, 883–888 CrossRef.
- S. C. Wang, Y. W. Lai, Y. X. Ben and H. C. Chang, Ind. Eng. Chem. Res., 2004, 43, 2902–2911 CrossRef CAS.
- S. H. Ko, Y. A. Song, S. J. Kim, M. Kim, J. Han and K. H. Kang, Lab Chip, 2012, 12, 4472–4482 RSC.
- A. J. Bard and L. R. Faulkner, Electrochemical Methods: Fundamentals and Applications, Wiley, 2000 Search PubMed.
- G. Yossifon, P. Mushenheim, Y. C. Chang and H. C. Chang, Phys. Rev. E: Stat., Nonlinear, Soft Matter Phys., 2009, 79, 046305 CrossRef.
- K.-B. Sung, K.-P. Liao, Y.-L. Liu and W.-C. Tian, Microfluid. Nanofluid., 2012, 1613–4990 Search PubMed.
- D. Griffani, P. Rognon, B. Metzger and I. Einav, Phys. Fluids, 2013, 25, 093301 CrossRef PubMed.
- S. C. Wang, H. P. Chen, Y. W. Lai, L. K. Chau, Y. C. Chuang and Y. J. Chen, Biomicrofluidics, 2007, 1, 34104 CrossRef PubMed.
| This journal is © The Royal Society of Chemistry 2015 |