Sustainable allylation of organosolv lignin with diallyl carbonate and detailed structural characterization of modified lignin†
Lena C.
Over
and
Michael A. R.
Meier
*
Karlsruhe Institute of Technology (KIT), Institute of Organic Chemistry (IOC), Laboratory of Applied Chemistry, Fritz-Haber-Weg 6, Building 30.42, D-76131 Karlsruhe, Germany. E-mail: m.a.r.meier@kit.edu
First published on 25th August 2015
Abstract
The allylation of European beech wood organosolv lignin (OL) with diallyl carbonate (DAC) in the presence of base catalysts is shown to be an efficient, non-toxic, and sustainable modification technique. Comparative studies of different bases and temperatures were performed to optimize the solvent-free allylation of OL. Up to 90% of the aromatic and aliphatic hydroxyl groups in OL were converted to the respective allyl ethers or allyl carbonates using tetrabutylammonium bromide (TBAB) as recyclable base. The demonstrated strategy allows the introduction of functional groups into the structure of lignin, which will enable further modification. Detailed structural analytics by 31P, 1H, and 13C NMR, as well as IR spectroscopy and detailed mass analysis using SEC–ESI–MS verified the functionalization and delivered insights into the structure of lignin.
Introduction
Besides cellulose and chitin, lignin is one of the most abundant biopolymers on earth.1 With a content of 15–30 wt%, lignin is a main component of biomass such as wood and annual plants. The total lignin resources on earth are estimated to be 300 billion tons, with a natural production of 20 billion tons per year.2 Thus, it is a very attractive renewable resource and—especially with regard to the production of aromatic compounds—probably the most promising alternative to petroleum-based materials.3 Most of the available lignin is isolated through chemical pulping of wood during the production of fibrous chemical pulps, e.g., for paper production. However, there are only few commercial applications of lignin-derived products. Most of the isolated lignin, mainly kraft lignin, is burned for energy recovery. Thus, the energy demand of the pulp mill can be covered, but lignin is not used as a valuable raw material. Organosolv pulping represents an eco-friendly alternative to the kraft process4 and is mainly used in lignocellulose biorefineries.Lignin has a complex cross-linked structure with variably linked phenylpropanoid units, wherein the three main building blocks are: sinapyl alcohol 1, coniferyl alcohol 2, and coumaryl alcohol 3 (Fig. 1). The content of the three phenylpropanoid units and also the type of linkage between the units depends on the nature of the biomass (e.g., hard wood, soft wood, annual plants). However, the most frequently observed linkage between two units is the β-O-4 linkage (Fig. 1).5
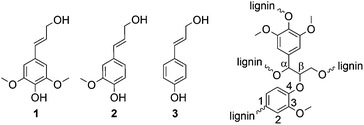 | ||
| Fig. 1 Main building blocks of lignin: sinapyl alcohol (1), coniferyl alcohol (2), and coumaryl alcohol (3) as well as the β-O-4 linkage between two building blocks as typical binding motif. | ||
The unique chemical structure qualifies lignin for many possible applications. On the one hand, the complex structure of lignin could be fragmented to prepare diverse aromatic platform chemicals such as benzene, toluene, xylene (BTX chemicals) or vanillin derivatives, which could replace identical products from petrochemistry.3,6,7 On the other hand, the macromolecular structure of lignin can be used for the preparation of polymeric materials. Herein, many possible applications are proposed in the literature; for instance, the use of lignin as polyol for polyurethanes8–10 or as phenol substitute in phenolic resins.11,12 Furthermore, lignin can be used in blends to increase mechanical stability or biodegradability.13 Although the potential of lignin as renewable raw material is often discussed, economically competitive processes are required for industrial substitution of petroleum oil. As unmodified lignin forms instable, unreactive, and insoluble materials at high temperatures and extremely acidic or basic conditions,14 lignin is often modified prior to polymerization. One well-known modification is the oxyalkylation of lignin with propylene oxide to reduce the brittleness and to improve the viscoelastic properties.15 A more sustainable oxyalkylation was recently presented by Lehnen et al.16 using propylene carbonate. Conventional alkylations of phenols are performed using methyl halides and dimethyl sulfates (Williamson ether synthesis).17 The Williamson ether synthesis is also described for the O-methylation of the phenolic hydroxyl groups in lignin to increase its thermal stability.18 Using allyl bromide, Zoia et al. obtained an allylated lignin that could undergo Claisen rearrangements.19 However, the used reagents are toxic and not environmentally benign. Moreover, stoichiometric amounts of a base are required. In contrast, the use of dialkyl carbonates would allow a sustainable, non-toxic, and environmentally friendly modification of the phenolic building blocks of lignin – an already well-established method for low molecular weight phenolic substances (e.g., phenol, naphtol, o-/p-cresol, eugenol).20–24
Recently, Argyropoulos et al.25 applied this methylation method to acetone-soluble softwood kraft lignin thereby increasing the thermal stability of lignin. For lignin25 as well as for diverse model compounds,26 it is described that aliphatic hydroxyl groups are converted to carboxymethylated structures at lower temperatures (∼90 °C) by a nucleophilic attack at the carbonyl C atom of the carbonate, whereas aromatic hydroxyl groups are etherified to yield methoxy groups above reaction temperatures of 120 °C due to a nucleophilic attack at the methyl group. Moreover, the ethylation,24,27 and benzylation28 of phenols with diethyl carbonate (DEC) and dibenzyl carbonate (DBC) is described. We recently reported the highly efficient etherification and esterification of different phenols and acids using DBC and diallyl carbonate (DAC) in the presence of sub-stoichiometric amounts of 1,8-diazabicyclo[5.4.0]undec-7-ene (DBU).29
Herein, we present the sustainable, solvent-free and non-toxic allylation of beech wood organosolv lignin (OL) with diallyl carbonate to obtain an allylated lignin, which was thoroughly characterized via1H, 13C, 31P NMR, and IR spectroscopy, as well as detailed mass analysis, and can serve as monomer for further polymerization.
Experimental section
Materials
The following chemicals were obtained from commercial sources and used without further purification: allyl alcohol (>99%, Aldrich), benzoquinone (98%, Aldrich), cesium carbonate (99%, Aldrich), 1,8-diazabicyclo[5.4.0]undec-7-ene (98%, Aldrich), dimethylacetamide (DMAc, 99.8%, Aldrich), dimethyl carbonate (99%, Acros Organics), dimethylformamide (DMF, 99.9%, VWR), dimethyl sulfoxide (DMSO, >99.5%, Carl Roth), dimethylsulfoxide-d6 (DMSO-d6, 99.8 atom-% D, Euriso-top), diphosphorous pentoxide (VWR), ethanol (>99.7, VWR), ethyl vinyl ether (99%, contains 0.1% KOH as stabilizer, Aldrich), Hoveyda-Grubbs 1st Generation (HG1, 97%, Aldrich), Hoveyda-Grubbs 2nd Generation (HG2, 97%, Aldrich), hydrochloric acid (37%, Fluka), potassium carbonate (99%, Aldrich), pyridine (water-free, for analysis, Acros Organics), sodium hydroxide (>99%, Carl Roth), tetrabutylammoniumbromide (>99%, Aldrich), tetrahydrofuran (for GPC, GC-MS, dry, contains 250 ppm BHT as inhibitor, >99.9%, Aldrich), 1,5,7-triazabicyclo[4.4.0]-dec-5-ene (98%, Aldrich).Diallyl carbonate (DAC) was synthesized from dimethyl carbonate and allyl alcohol as described recently.30 Solvents were of technical grade and used without any purification.
Organosolv pulping
The organosolv pulping was performed at the Thünen Institute of Wood Research (Hamburg, Germany). European beech wood (F. sylvatica L.) chips (10.8 kg) were treated with ethanol/water (50 vol%) at 170 °C for 90 min with a catalytic amount sulfuric acid (0.5 wt% based on dry wood). The solid to liquid ratio was 1![[thin space (1/6-em)]](https://www.rsc.org/images/entities/char_2009.gif) :
:![[thin space (1/6-em)]](https://www.rsc.org/images/entities/char_2009.gif) 4. The lignin fraction in solution was separated from the solid fraction by filtration. OL was precipitated in water at a pH value of around 2. The suspension was centrifuged and OL separated. OL was dried at 40 °C in a vacuum drying oven and isolated as a brown solid (785 g, 7.8 wt%).
4. The lignin fraction in solution was separated from the solid fraction by filtration. OL was precipitated in water at a pH value of around 2. The suspension was centrifuged and OL separated. OL was dried at 40 °C in a vacuum drying oven and isolated as a brown solid (785 g, 7.8 wt%).
Allylation of OL
OL (150 mg, 0.915 mmol OH) was placed in a 15 mL pressure tube, suspended in DAC (1.30 g, 9.15 mmol, 10 eq. per hydroxyl group) and heated to 120 °C. Tetrabutylammonium bromide (295 mg, 0.915 mmol, 1 eq. per hydroxyl group) was added and the solution was stirred at 120 °C for 5 hours.Decarboxylation of allylated OL
Allylated OL (99.7 mg) was dissolved in THF (1 mL) and water (1 mL). Lithium hydroxide (43 mg, 1.8 mmol) was added and the mixture was stirred at room temperature for 5 days. 1 M hydrochloric acid (100 mL) was added to precipitate the product. The product was filtered, washed with 1 M hydrochloric acid (50 mL) and water (2 × 50 mL) and dried at 5 × 10⁻³ mbar over diphosphorous pentoxide for 24 h. The modified OL (65 mg, 67 wt%) was obtained as a brown solid.Self-metathesis of allylated OL
Allylated OL (100 mg, 80% allylated, 0.401 mmol C![[double bond, length as m-dash]](https://www.rsc.org/images/entities/char_e001.gif) C) was dissolved in dry dichloromethane (DCM) (1000 μL), benzoquinone (2.6 mg, 6 mol%) and Hoveyda-Grubbs 1st Generation catalyst (4.9 mg, 2 mol%) were added. After 15 h, ethyl vinyl ether (500 μL) was added. The solid was precipitated in methanol (30 mL), filtered and washed with methanol (2 × 5 mL).
C) was dissolved in dry dichloromethane (DCM) (1000 μL), benzoquinone (2.6 mg, 6 mol%) and Hoveyda-Grubbs 1st Generation catalyst (4.9 mg, 2 mol%) were added. After 15 h, ethyl vinyl ether (500 μL) was added. The solid was precipitated in methanol (30 mL), filtered and washed with methanol (2 × 5 mL).
1H NMR spectroscopy
1H NMR spectra were measured in DMSO-d6 with a Bruker AC 300 with 256 scans and a time delay d1 of 10 seconds at 25 °C. The sample concentration was 20 mg mL−1. All 1H NMR data are reported in ppm relative to the solvent signal for DMSO-d6 at 2.50 ppm.13C NMR spectroscopy
For the quantitative 13C analysis, a lignin sample (95.0 mg) was dissolved in 450 μL DMSO-d6. 100 μL of a solution of 1,3,5-trioxane (62.4 mg mL−1) and chromium(III) acetylacetonate (24.9 mg mL−1) in DMSO-d6 were added. 13C NMR spectra were measured with a Bruker Avance DRX 500 with delay time d1 of 4 seconds and 60![[thin space (1/6-em)]](https://www.rsc.org/images/entities/char_2009.gif) 416 scans. Data are reported in ppm relative to DMSO-d6 at 39.5 ppm.
416 scans. Data are reported in ppm relative to DMSO-d6 at 39.5 ppm.
Infrared spectroscopy (IR)
Infrared spectra (IR) were recorded on a Bruker alpha-p instrument applying ATR technology.SEC measurements
Molecular weight distributions were determined using a SEC system LC-20A from Shimadzu equipped with a SIL-20A autosampler, a PSS SDV analytical main-column (5 μm, 300 mm × 8.0 mm, 10![[thin space (1/6-em)]](https://www.rsc.org/images/entities/char_2009.gif) 000 Å), a PSS SDV analytical pre-column (5 μm, 50 mm × 8.0 mm), and a RID-10A refractive index detector in THF (flow rate 1 mL min−1) at 50 °C. All determinations of molar mass were performed relative to PMMA standards (PSS, Mp 1100–981.000 Da).
000 Å), a PSS SDV analytical pre-column (5 μm, 50 mm × 8.0 mm), and a RID-10A refractive index detector in THF (flow rate 1 mL min−1) at 50 °C. All determinations of molar mass were performed relative to PMMA standards (PSS, Mp 1100–981.000 Da).
Differential scanning calorimetry (DSC)
DSC experiments were carried out under nitrogen atmosphere with a DSC821e (Mettler Toledo) calorimeter using 40 μL aluminum crucibles and a sample mass of 6–8 mg. The glass transition temperature (Tg) was defined as the midpoint of the change in heat capacity occurring over the transition. The baseline was measured with an empty 40 μL aluminum crucible.Differential thermal analysis (DTA)/thermal gravimetric analysis (TGA)
DTA/TGA measurements were performed with a Netzsch STA 409C instrument applying α-Al2O3 as a crucible material and reference sample. The samples were heated under synthetic air flow to 500 °C with a heating rate of 5 K min−1, employing a sample mass of approximately 15 mg.Size exclusion chromatography–electrospray ionization–mass spectrometry (SEC–ESI–MS)
Spectra were recorded on a Q Exactive (Orbitrap) mass spectrometer (Thermo Fisher Scientific, San Jose, CA, USA) equipped with an HESI II probe. The instrument was calibrated in the m/z range 74–1822 using premixed calibration solutions (Thermo Scientific). A constant spray voltage of 4.6 kV, a dimensionless sheath gas of 8, and a dimensionless auxiliary gas flow rate of 2 were applied. The capillary temperature and the S-lens RF level were set to 320 °C and 62.0, respectively. The Q Exactive was coupled to a UltiMate 3000 UHPLC System (Dionex, Sunnyvale, CA, USA) consisting of a pump (LPG 3400SD), autosampler (WPS 3000TSL), and a thermostated column department (TCC 3000SD). Separation was performed on two mixed bed size exclusion chromatography columns (Polymer Laboratories, Mesopore 250 × 4.6 mm, particle diameter 3 μm) with precolumn (Mesopore 50 × 4.6 mm) operating at 30 °C. THF at a flow rate of 0.30 mL min−1 was used as eluent. The mass spectrometer was coupled to the column in parallel to a RI-detector (RefractoMax520, ERC, Japan) in a setup described earlier.31 0.27 mL min−1 of the eluent were directed through the RI-detector and 30 μL min−1 infused into the electrospray source after postcolumn addition of a 100 μM solution of sodium iodide in methanol at 20 μL min−1 by a micro-flow HPLC syringe pump (Teledyne ISCO, Model 100DM). A 20 μL aliquot of a polymer solution with a concentration of 2 mg mL−1 was injected onto the HPLC system.31P NMR studies
For 31P NMR studies, an exact amount of 28–32 mg of the lignin sample was diluted in 400 μL CDCl3/pyridine (1![[thin space (1/6-em)]](https://www.rsc.org/images/entities/char_2009.gif) :
:![[thin space (1/6-em)]](https://www.rsc.org/images/entities/char_2009.gif) 1.6). 150 μL of a solution of chromium(III) acetylacetonate (3.6 mg mL−1) as relaxation agent and cyclohexanol (4.0 mg mL−1) as internal standard in CDCl3/pyridine (1
1.6). 150 μL of a solution of chromium(III) acetylacetonate (3.6 mg mL−1) as relaxation agent and cyclohexanol (4.0 mg mL−1) as internal standard in CDCl3/pyridine (1![[thin space (1/6-em)]](https://www.rsc.org/images/entities/char_2009.gif) :
:![[thin space (1/6-em)]](https://www.rsc.org/images/entities/char_2009.gif) 1.6) were added and the solution was stirred for 5 minutes. 2-Chloro-4,4,5,5-tetramethyl-1,2,3-dioxaphospholane (70 μL) was added and the solution was transferred into a NMR tube for subsequent measurement in a Bruker Ascend™ 400 MHz spectrometer with 512 scans, a delay time d1 of 3 seconds and a spectral width of 50 ppm (165–115 ppm). The chemical shifts are reported relative to the reaction product of 2-chloro-4,4,5,5-tetramethyl-1,2,3-dioxaphospholane with water at 132.2 ppm. Integrals are assigned to the functional groups as followed: δ = 150.0–145.5 (aliphatic hydroxyl groups), 145.5–144.7 (cyclohexanol), 144.7–136.6 (phenolic hydroxyl groups), 136.6–133.6 (carboxylic acids) ppm.32 In the region of the phenolic hydroxyl groups, syringyl (144.7–141.0 ppm) and guiacyl units (141.0–136.6 ppm) can be distinguished.
1.6) were added and the solution was stirred for 5 minutes. 2-Chloro-4,4,5,5-tetramethyl-1,2,3-dioxaphospholane (70 μL) was added and the solution was transferred into a NMR tube for subsequent measurement in a Bruker Ascend™ 400 MHz spectrometer with 512 scans, a delay time d1 of 3 seconds and a spectral width of 50 ppm (165–115 ppm). The chemical shifts are reported relative to the reaction product of 2-chloro-4,4,5,5-tetramethyl-1,2,3-dioxaphospholane with water at 132.2 ppm. Integrals are assigned to the functional groups as followed: δ = 150.0–145.5 (aliphatic hydroxyl groups), 145.5–144.7 (cyclohexanol), 144.7–136.6 (phenolic hydroxyl groups), 136.6–133.6 (carboxylic acids) ppm.32 In the region of the phenolic hydroxyl groups, syringyl (144.7–141.0 ppm) and guiacyl units (141.0–136.6 ppm) can be distinguished.
Results and discussion
The utilized OL was isolated via an ethanol–water pulping at the Thünen Institute of Wood Research and used without any further fractionation (for details, see Experimental part). The SEC analysis of OL in THF revealed a number average molecular weight Mn of 1200 g mol−1 with a dispersity Đ of 3.1 (Table 1). 31P NMR studies were performed with 2-chloro-4,4,5,5-tetramethyl-1,2,3-dioxaphospholan as phosphorylating agent and cyclohexanol as internal standard to obtain the absolute amount of hydroxyl groups. The ratio of the syringyl to guiacyl units is 1.65 (determined by 13P NMR studies), implying that in average every C9 unit should contain 1.33 methoxy groups. From these results and the elemental analysis, a C9 formula can be proposed, C9H7.1O1.2(OH)1.2(OMe)1.3, which is comparable to similarly isolated lignin.16Optimization of the allylation of OL using different bases
The optimization of the allylation reaction of OL 4 was performed using DAC 5 as reagent and solvent, elevated temperatures and different bases in varying amounts. The resulting product 6 contains etherified aromatic hydroxyl groups and carboxyallylated aliphatic hydroxyl groups (Scheme 1). In first experiments, we studied the influence of different bases for the solvent-free allylation of OL under neat conditions in a pressure tube with an excess of DAC (Table 2).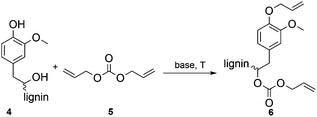 | ||
| Scheme 1 Allylation of OL with DAC resulting in the etherification of aromatic hydroxyl groups and the carboxyallylation of the aliphatic hydroxyl groups. | ||
| Entry | Eq. of base | M n [g mol−1] | Đ | X aliph (OH) [%] | X arom (OH) [%] | X total (OH) [%] |
|---|---|---|---|---|---|---|
| Conditions: OL (0.915 mmol OH) was suspended in DAC (9.15 mmol) and the specified amount of the base was added at the reaction temperature. The solution was stirred for 5 h at 120 °C in a 15 mL-pressure tube.a Product not completely soluble in THF.b Product not completely soluble in CDCl3/pyridine for NMR analysis; x: no allylation observed in 1H NMR. | ||||||
| K 2 CO 3 | ||||||
| 1 | 2 | 1500 | 2.6 | x | x | x |
| 2 | 1 | 1700 | 3.0 | x | x | x |
| 3 | 0.5 | 2000 | 3.3 | x | x | x |
| 4 | 0.2 | 1900 | 2.9 | x | x | x |
| Cs 2 CO 3 | ||||||
| 5 | 2 | 1600 | 3.0 | x | x | x |
| 6 | 1 | 1500 | 2.6 | x | x | x |
| 7 | 0.5 | 1700 | 3.1 | x | x | x |
| 8 | 0.2 | 1500a | 3.1 | |||
| NaOH | ||||||
| 9 | 2 | 1600 | 2.9 | x | x | x |
| 10 | 1 | 1700 | 2.9 | x | x | x |
| 11 | 0.5 | 1700 | 2.9 | x | x | x |
| 12 | 0.2 | 1600 | 3.1 | x | x | x |
| DBU | ||||||
| 13 | 2 | 1100 | 2.7 | |||
| 14 | 1 | 1200a | 2.5 | |||
| 15 | 0.5 | 900a | 2.2 | |||
| 16 | 0.2 | 900a | 2.1 | |||
| TBAB | ||||||
| 17 | 2 | 2700 | 3.5 | 84 | 100 | 90 |
| 18 | 1 | 2400 | 3.7 | 79 | 100 | 87 |
| 19 | 0.5 | 2100 | 3.8 | 55 | 99 | 71 |
| 20 | 0.2 | 1900 | 3.8 | 18 | 29 | 23 |
Herein, potassium carbonate (K2CO3),20,26,33,34 cesium carbonate (Cs2CO3),22 DBU,35 and TBAB23 were used as bases, since they have been shown to promote the efficient alkylation of diverse phenols with dialkyl carbonates. Sodium hydroxide was already described for the O-methylation of acetone soluble kraft lignin.25 The allylation of OL was followed by 1H NMR (as discussed later) and in case of successful allylation the conversion of the hydroxyl groups (X(OH)) was determined by 31P NMR studies according to a procedure described by Argyropoulos et al.36 Additionally, the allylated products were analyzed by SEC measurements to determine the number average molecular weight Mn and the dispersity Đ in order to investigate degradation or cross-linking of the substrate. In the solvent-free allylation of OL using potassium carbonate, cesium carbonate and sodium hydroxide, no functionalization was observed (Table 2, entries 1–12). For these three bases, regardless of the amount used, new signals did not appear in the allyl region of the respective 1H NMR spectra. The obtained Mn values of these products varied between 1500 and 2000 g mol−1 and were thus slightly higher than for the unmodified OL (Mn = 1200 g mol−1). However, the SEC curves hardly differed from the curve of the unmodified OL (Fig. 2). Only with NaOH as a base, a shift towards lower molecular weights was observed, a possible sign of degradation. The use of DMF, DMSO or DMAc as solvents showed no improvements for these three bases.
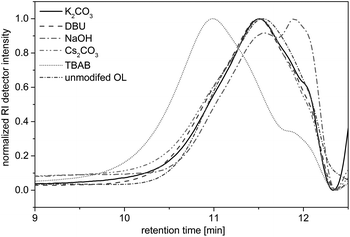 | ||
| Fig. 2 SEC traces for OL and the reaction products of the allylation with different bases. Reaction conditions: 10 eq. DAC, 2 eq. base, 5 h, 120 °C. | ||
Allylations using DBU as a base usually resulted in insoluble products (Table 2, entries 13–16). A key problem is that OL itself is not soluble in DAC but in DBU, thus, agglomeration takes place during the reaction, which hinders a good stirring of the reaction mixture. However, using 2 equivalents of DBU, the product was soluble in THF and could be analyzed via SEC. Results (Fig. 2) were similar to that of the starting material, but the proton NMR showed new signals in the allyl region between 4 and 6 ppm. However, the allylation could not be quantified using 31P NMR, since the product was not completely soluble in CDCl3/pyridine or in DMSO-d6. Anyway, due to the similar SEC curve, the amount of allylation must have been rather low. Interestingly, if the allylation reactions were performed with DMSO as solvent, the reaction with DBU was more successful. The proton NMR showed the allylation of OL and 31P NMR analysis revealed that 85% of all hydroxyl groups in OL were converted (not shown in table). Nevertheless, DBU was shown to be a suitable base only for the reaction in a solvent – such as DMSO – but not under the desired solvent-free conditions.
With TBAB as a base, an efficient allylation under solvent-free conditions could be obtained (Table 2, entries 17–20). The Mn values ranged between 1900 and 2700 g mol−1. Thus, a significant shift towards higher molecular weights was observed (Fig. 2). The 31P NMR studies revealed the quantitative conversion of phenolic hydroxyl groups after 5 hours using only 0.5 equivalents of the base, though the conversion of the aliphatic hydroxyl groups was significantly lower (Table 2, entry 19). With 0.2 equivalents of TBAB, a very low conversion was observed (Table 2, entry 20). However, increasing the amount of TBAB (1–2 equivalents) enabled high conversion of both aliphatic and aromatic hydroxyl groups of OL (Table 2, entries 17 and 18). The efficient functionalization of OL using TBAB could be attributed to the high phase transfer activity of the tetrabutylammonium salt. In contrast to the other bases, OL was instantly dissolved after the addition of TBAB, which resulted in a homogenous reaction mixture and enabled an efficient allylation reaction. Besides its phase transfer activity in this reaction, TBAB shows catalytic activity towards the alkylation of phenols with dialkyl carbonates. Thiébaud et al.23 published a plausible mechanism for the methylation with dimethyl carbonate, where TBAB deprotonates the phenol forming a complexed phenolate that attacks the methyl group of DMC. A similar reactivity is conceivable for the reaction with DAC.
Optimization of the allylation of OL with TBAB
TBAB was shown to be the most efficient base among the tested bases for the allylation of OL. Thus, additional studies were carried out to find optimized reaction conditions. Herein, the conversion of the hydroxyl groups was monitored for different reaction times and different reaction temperatures (Table 3). An extension of the reaction time at 120 °C from 3 to 5 or 15 hours did not lead to any further increase of the conversion (Table 3, entries 2, 6 and 10). Already after 3 hours, 88% of all hydroxyl groups of OL were converted, regardless whether 1 or 2 equivalents of TBAB per hydroxyl group were used. With 0.5 equivalents of TBAB, the reaction was significantly slower and a reaction time of 15 hours was required to obtain a conversion of 86% (Table 3, entry 4). Contrary to the results obtained with DBU, the addition of DMSO as solvent did not lead to any further increase of the conversion. After 24 hours, the conversion of the aliphatic hydroxyl groups was even 10% lower compared to the reaction without a solvent after 15 hours (Table 3, entries 1 and 2). The same observation was made for the reactions performed with and without solvent in a time frame of 5 hours, which indicated that the use of a solvent is disadvantageous (Table 3, entries 5 and 6).| Entry | t [h] | TBAB [eq. per OH] | M n [g mol−1] | Đ | X aliph(OH) [%] | X arom(OH) [%] | X total(OH) [%] |
|---|---|---|---|---|---|---|---|
| Conditions: In a 15 mL-pressure tube OL (0.915 mmol OH) was suspended in DAC (9.15 mmol) and the specified amount of TBAB was added at the reaction temperature.a DMSO was added as solvent. | |||||||
| 120 °C | |||||||
| 1 | 24a | 2 | 2100 | 3.4 | 72 | 99 | 82 |
| 2 | 15 | 2 | 2100 | 3.1 | 81 | 100 | 88 |
| 3 | 15 | 1 | 2100 | 3.4 | 79 | 99 | 87 |
| 4 | 15 | 0.5 | 2300 | 4.2 | 78 | 99 | 86 |
| 5 | 5a | 2 | 2300 | 3.5 | 76 | 99 | 85 |
| 6 | 5 | 2 | 2700 | 3.7 | 84 | 100 | 90 |
| 7 | 5 | 1 | 2400 | 3.8 | 79 | 100 | 87 |
| 8 | 5 | 0.5 | 2100 | 3.8 | 55 | 99 | 71 |
| 9 | 5 | 0.2 | 1900 | 3.8 | 18 | 29 | 22 |
| 10 | 3 | 2 | 1700 | 3.4 | 82 | 100 | 88 |
| 11 | 3 | 1 | 1800 | 3.6 | 79 | 100 | 87 |
| 12 | 3 | 0.5 | 1800 | 4.3 | 68 | 100 | 80 |
| 100 °C | |||||||
| 13 | 15 | 2 | 1600 | 3.6 | 76 | 99 | 84 |
| 14 | 15 | 1 | 2100 | 4.1 | 67 | 100 | 79 |
| 15 | 5 | 2 | 1900 | 3.8 | 65 | 100 | 78 |
| 16 | 5 | 1 | 1700 | 3.4 | 13 | 66 | 33 |
| 17 | 5 | 0.5 | 1700 | 2.7 | 11 | 31 | 19 |
| 18 | 3 | 2 | 2400 | 2.9 | 25 | 88 | 49 |
| 19 | 3 | 1 | 1700 | 2.9 | 14 | 35 | 22 |
| 20 | 3 | 0.5 | 1700 | 2.8 | 16 | 22 | 19 |
| 90 °C | |||||||
| 21 | 15 | 2 | 1800 | 4.1 | 65 | 100 | 78 |
| 22 | 15 | 1 | 2000 | 3.5 | 50 | 99 | 68 |
| 23 | 5 | 2 | 2500 | 2.7 | 14 | 65 | 33 |
| 24 | 5 | 1 | 2100 | 2.8 | 17 | 39 | 25 |
| 25 | 5 | 0.5 | 1800 | 2.3 | 23 | 24 | 24 |
A reduction of the reaction temperature from 120 °C to 100 °C or 90 °C led to lower conversions for both aliphatic and aromatic hydroxyl groups, and longer reaction times (Table 3, entries 13–18).
It is well established for DMC that the aliphatic hydroxyl groups react preferentially at 90 °C compared to phenolic hydroxyl groups.26 This selectivity between the different kinds of hydroxyl groups was not observed using DAC and lignin. The aromatic hydroxyl groups still reacted preferentially at a reaction temperature of 90 °C. Higher temperatures were not applied, on the one hand, to avoid temperatures close to the decomposition of TBAB at 133 °C,23 and on the other hand, to prevent cross-linking or Claisen rearrangement of the formed product. Shorter reaction times did not lead to progressive allylation; after one hour at 120 °C with 0.5 equivalents TBAB only 23% of all hydroxyl groups were converted.
Sustainability of the allylation procedure for lignin
Lower equivalents (0.2 eq.) of TBAB poorly catalyzed the functionalization and the solubility of OL in DAC was decreased, which further indicates the phase transfer catalyst activity of TBAB. Nevertheless, the relatively high amount of at least 0.5 equivalents of TBAB per hydroxyl group was almost completely recovered (97%) from the aqueous phase after precipitation of the product and separation by filtration. The recovered TBAB was used for other allylation reactions of OL without any further purification. After 5 hours at 120 °C, a conversion of all hydroxyl groups on OL of 85% was obtained (with 0.5 equivalents of the recycled TBAB), which is comparable to the reaction using commercial TBAB (Table 3, entry 8).Furthermore, the amount of DAC could be decreased. In a reaction with 5 or 3 equivalents of DAC per hydroxyl group (instead of 10), similar conversions were obtained. DAC itself can be considered as green reagent, since it is non-toxic and can be synthesized from DMC in a sustainable pathway. The recovery of DAC from the reaction mixture was possible via extraction or destillation. Although only 60% of the DAC could be recovered in this way, this increases the overall sustainability of the procedure. In larger scale reactions, the recovered yield of DAC may be increased in the future.
Analysis of the allylated OL
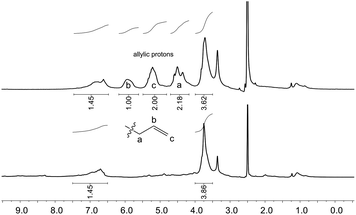 | ||
| Fig. 3 1H NMR spectra of unmodified OL (bottom) and allylated OL (top) in DMSO-d6 (δ = 2.50 ppm). Conditions for the allylation of OL: 3 h at 120 °C with 2 equivalents of TBAB per OH (Table 3, entry 10). The signal at δ = 3.33 ppm results from the water present in the deuterated solvent. | ||
Whether the hydroxyl groups were etherified or carboxyallylated cannot be distinguished by 31P or 1H NMR studies. Therefore, further analytical experiments were carried out.
![[double bond, length as m-dash]](https://www.rsc.org/images/entities/char_e001.gif) O bond stretching vibration contained in carbonates. This carbonate must have been formed via carboxyallylation of the aliphatic hydroxyl groups. The bands of the internal aromatic C
O bond stretching vibration contained in carbonates. This carbonate must have been formed via carboxyallylation of the aliphatic hydroxyl groups. The bands of the internal aromatic C![[double bond, length as m-dash]](https://www.rsc.org/images/entities/char_e001.gif) C double bond stretching vibrations are observed in both spectra at ν = 1592 and 1510 cm−1 as well as the deformation vibration of the methoxy groups at ν = 1460 and 1410 cm−1. The out of plane deformation vibration of the newly formed CH
C double bond stretching vibrations are observed in both spectra at ν = 1592 and 1510 cm−1 as well as the deformation vibration of the methoxy groups at ν = 1460 and 1410 cm−1. The out of plane deformation vibration of the newly formed CH![[double bond, length as m-dash]](https://www.rsc.org/images/entities/char_e001.gif) CH2 is observed at ν = 990 and 910 cm−1.
CH2 is observed at ν = 990 and 910 cm−1.
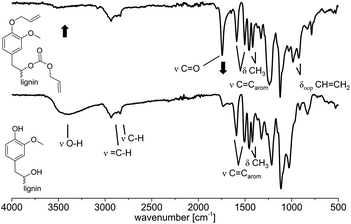 | ||
| Fig. 4 IR spectra (ATR) before (bottom) and after (top) the allylation of lignin with DAC. Conditions for the allylation of OL: 3 h at 120 °C with 2 equivalents of TBAB per OH (Table 3, entry 10). | ||
![[thin space (1/6-em)]](https://www.rsc.org/images/entities/char_2009.gif) :
:![[thin space (1/6-em)]](https://www.rsc.org/images/entities/char_2009.gif) 1
1![[thin space (1/6-em)]](https://www.rsc.org/images/entities/char_2009.gif) :
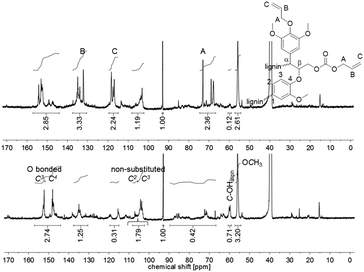
:![[thin space (1/6-em)]](https://www.rsc.org/images/entities/char_2009.gif) 1 perfectly fit to the introduced allyl function in the product. The 13C NMR spectrum of the unmodified lignin shows a signal at δ = 60 ppm, which is typical for aliphatic alcohols (1.5 mmol g−1). This signal almost completely disappeared in the spectrum of the allylated lignin (0.1 mmol g−1). Furthermore, the integrals of the signals related to the carbon content of the O-bonded aromatic 13C atoms C3 and C4 between 140 and 155 ppm stayed constant during the reaction (6.0–6.2 mmol g−1). For the non-substituted C2 and C3, with a signal between 108.2 and 102.2 ppm, a decrease from 3.9 to 2.6 mmol g−1 was observed. This decreased amount of aromatic carbons per gram may be explained by the increase of the total amount of carbons after modification. The same observation is found for the methoxy groups, which show a signal between 57.3 and 54.2 ppm (decrease from 7.0 to 5.7 mmol g−1). Relatively to the methoxy carbons, it is observed that the integral between 140 and 155 ppm increases (Fig. 5). Fig. 5 also shows that besides the O-bonded aromatic 13C atoms C3 and C4, additional carbon signals appear. An explanation could be the formation of carboxyallylated products, which include carbonyl C atoms that could be referred to the signal around 155 ppm.
1 perfectly fit to the introduced allyl function in the product. The 13C NMR spectrum of the unmodified lignin shows a signal at δ = 60 ppm, which is typical for aliphatic alcohols (1.5 mmol g−1). This signal almost completely disappeared in the spectrum of the allylated lignin (0.1 mmol g−1). Furthermore, the integrals of the signals related to the carbon content of the O-bonded aromatic 13C atoms C3 and C4 between 140 and 155 ppm stayed constant during the reaction (6.0–6.2 mmol g−1). For the non-substituted C2 and C3, with a signal between 108.2 and 102.2 ppm, a decrease from 3.9 to 2.6 mmol g−1 was observed. This decreased amount of aromatic carbons per gram may be explained by the increase of the total amount of carbons after modification. The same observation is found for the methoxy groups, which show a signal between 57.3 and 54.2 ppm (decrease from 7.0 to 5.7 mmol g−1). Relatively to the methoxy carbons, it is observed that the integral between 140 and 155 ppm increases (Fig. 5). Fig. 5 also shows that besides the O-bonded aromatic 13C atoms C3 and C4, additional carbon signals appear. An explanation could be the formation of carboxyallylated products, which include carbonyl C atoms that could be referred to the signal around 155 ppm.
Decarboxylation reaction as a proof of carbonate formation
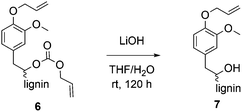
For methylations using DMC, it is well established that aliphatic hydroxyl groups are converted to methyl carbonates whereas aromatic hydroxyl groups are etherified.25,26 Previously, it was shown that phenol model substances can selectively be converted to allyl ethers using DAC.29 To verify whether the aliphatic hydroxyl groups in lignin were converted into ether groups or if they were carboxyallylated with DAC, product 6 was treated with LiOH to cleave the potentially formed carbonates (Scheme 2). The obtained defunctionalized lignin 7 was analyzed by 31P NMR, 1H NMR and IR spectroscopy. 31P-NMR analysis revealed that after the treatment with LiOH only 24% of the aliphatic hydroxyl groups were still allylated, whereas 71% were allylated before. The content of aromatic hydroxyl groups remained unchanged; thus, the conversion of the aromatic hydroxyl groups before and after the treatment with LiOH was determined equally to 99% (Table 4).| X aliph(OH) [%] | X arom(OH) [%] | X total(OH) [%] | |
|---|---|---|---|
| Conditions for the decarboxylation: allylated OL and LiOH (2 eq. per original OH) were stirred in THF/H2O, at room temperature for 120 h. | |||
| After allylation of OL | 71 | 99 | 82 |
| After treatment with LiOH | 24 | 99 | 54 |
Moreover, the 1H NMR revealed that the integral of the allyl protons decreased after the treatment with LiOH relatively to the unchanged aromatic protons (for spectra, see ESI†). Thus, this data show that the aliphatic hydroxyl groups at least partially underwent a carboxyallylation, whereas the aromatic hydroxyl groups were completely etherified. For further verification, the modified lignin was studied by IR analysis before and after treatment with LiOH (for spectra, see ESI†). Here, the signal of the O–H bond stretching vibration between ν = 3100 and 3700 cm−1 increases after the treatment with LiOH (for IR spectrum, see ESI†) if compared to the allylated OL. Furthermore, the signal related to the C![[double bond, length as m-dash]](https://www.rsc.org/images/entities/char_e001.gif) O bond stretching vibration of the carbonate at ν = 1740 cm−1 almost completely disappears after the treatment with LiOH, indicating that this signal was induced by the formed carbonates. All in all, conclusive NMR and IR analysis clearly revealed that besides the etherification of the aromatic hydroxyl groups, the aliphatic hydroxyl groups of lignin were mainly converted into allyl carbonates.
O bond stretching vibration of the carbonate at ν = 1740 cm−1 almost completely disappears after the treatment with LiOH, indicating that this signal was induced by the formed carbonates. All in all, conclusive NMR and IR analysis clearly revealed that besides the etherification of the aromatic hydroxyl groups, the aliphatic hydroxyl groups of lignin were mainly converted into allyl carbonates.
Thermal properties of allylated OL
DSC and TGA studies were carried out to investigate the thermal properties of the allylated OL compared to the unmodified OL. It was shown that the glass transition temperature is decreased with an increased allylation grade (Fig. 6, left). The unmodified OL shows a glass transition temperature at 120 °C. After allylation of around 90% of the hydroxyl groups, the glass transition decreases to 70 °C, whereas with a conversion of 33% the glass transition temperature decreased to 95 °C. Applying several heating cycles to 170 °C to the allylated and unmodified OL, it turned out, that the molecular weight distribution of the allylated sample increased its molecular weight upon this heat treatment. In contrast, the unmodified OL remained almost unchanged under these conditions (for SEC traces, see ESI†). Thus, the allylated OL shows less thermal stability than the OL prior to modification. This decreased stability may be due to the high reactivity of the allyl function that can be used for further modification or polymerization. DSC analysis showed a novel exothermic transition in the sample of the allylated product, which occurs between 180 and 250 °C, depending on the allylation grade, that is not present in the unmodified OL (Fig. 6, right). This exothermic peak could result from a cross-linking induced by the new allyl functional groups as no degradation is observed in the TGA at this temperature. An insoluble product was formed after one heating cycle to 260 °C and no SEC analysis was possible anymore. For both samples, the allylated and the unmodified OL, an exothermic transition is observed in the DSC studies starting above 220 °C. Due to TGA analysis, it corresponds to the degradation of lignin (for TGA traces, see ESI†), with the degradation temperatures at Td 5% = 218 °C and 235 °C for allylated and unmodified OL, respectively.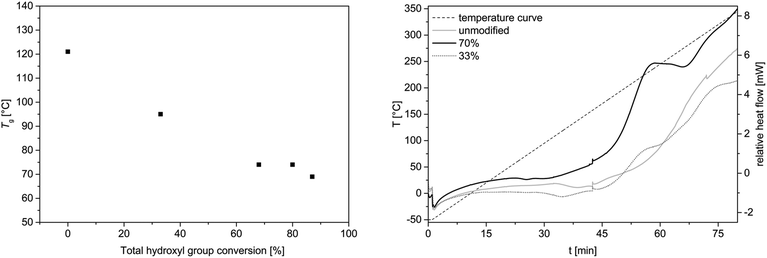 | ||
| Fig. 6 Left: Glass transition temperature as a function of conversion of all hydroxyl groups obtained from DSC studies. Oven temperature program: 25 °C to 170 °C (5 K min−1)—170 °C (1 min)—170 °C to −50 °C (5 K min−1)—−50 °C (1 min)—−50 °C to 170 °C (5 K min−1)—170 °C (1 min)—170 °C to 25 °C (5 K min−1); (for DSC curves, see ESI†). Right: DSC curve of allylated OL and unmodified OL from −50 °C to 350 °C (5 K min−1). | ||
Structural information before and after allylation
Assuming that all aromatic hydroxyl groups were converted into allyl ethers and aliphatic hydroxyl groups were carboxyallylated, the resulting empirical formula should be C9H7.1O1.2(OH)0.08(OMe)1.3(Oallyl)0.44(OCOOallyl)0.68, which is equal to C14.3H16.7O5.1 and in agreement with the results of the elemental analysis. If during the allylation only ethers would be formed, the empirical formula can be estimated to C13.7H16.7O3.7, which would lead to the following composition of C: 68%; H: 6.9% and O: 25%. Therefore, the results of the elemental analysis are in agreement with the NMR and IR study of the allylated OL treated with LiOH and give further evidence that the aliphatic hydroxyl groups were carboxyallylated, whereas the aromatic hydroxyl groups were etherified.
SEC–ESI–MS studies
The unmodified and allylated lignin were analyzed with a SEC–ESI–MS system having a RI and a mass detector connected in parallel in order to enable the determination of absolute molecular weights of the oligomers.31 For the allylated OL, the molecular weight distribution is shifted towards lower retention times (higher molecular weights; for chromatogram, see ESI†). However, for low retention times (<16.5 min) no mass fragments were detected (see ESI† for details).At 16.5 minutes, small signals appear in the region of m/z = 1600 for the allylated OL and around m/z = 1400 for the unmodified OL. Going to higher retention times and simultaneously lower m/z values, the intensity of the novel signals increases. Below m/z = 1000, the lignin fragments seem to be better ionizable and monoisotopic masses can be observed. Nevertheless, not until a retention time of 17.5 min, the intensity of the mass signals was high enough for an appropriate analysis. Here, the unmodified lignin shows a maximum m/z peak at 691.3080 (resolution (r) = 85![[thin space (1/6-em)]](https://www.rsc.org/images/entities/char_2009.gif) 000), whereas the allylated OL has a maximum peak at m/z = 811.4011 (r = 81
000), whereas the allylated OL has a maximum peak at m/z = 811.4011 (r = 81![[thin space (1/6-em)]](https://www.rsc.org/images/entities/char_2009.gif) 000). The difference in the exact mass of these two peaks is Δm = 120.0931. Considering the resolution (r = m/z/Δm/z), the maximal deviation of the exact masses between 691 and 811 can be Δm/z = 0.008 and 0.010, respectively. Thus, the mass difference is in the correct range to assign it to the addition of exactly three allyl groups (+3× C3H4, Δmcalc = 120.0939 g mol−1). In addition, the mass difference of Δm = 120.0931 between OL and the allylated OL is found for several mass fragments at a retention time of 17.5 min, which could also be assigned to three added allyl functions (for detailed mass difference correlations, see ESI†).
000). The difference in the exact mass of these two peaks is Δm = 120.0931. Considering the resolution (r = m/z/Δm/z), the maximal deviation of the exact masses between 691 and 811 can be Δm/z = 0.008 and 0.010, respectively. Thus, the mass difference is in the correct range to assign it to the addition of exactly three allyl groups (+3× C3H4, Δmcalc = 120.0939 g mol−1). In addition, the mass difference of Δm = 120.0931 between OL and the allylated OL is found for several mass fragments at a retention time of 17.5 min, which could also be assigned to three added allyl functions (for detailed mass difference correlations, see ESI†).
At a retention time of 18.0 minutes, an exact mass difference of Δm = 80.0626 ± 0.0001 (Δm/z = 0.006) is found for at least two different mass fragments of the OL and modified OL, which is in agreement with the addition of two allyl groups (Δmcalc = 80.0626) (Fig. 7). Mass differences for the addition of four allyl groups are observed at higher retention times (for exact masses, see ESI†). Most likely, the mass fragments that showed the formation of three or two allyl ethers only contained three or two phenol groups, respectively, and no further hydroxyl groups as the 31P studies showed a conversion of 90%.
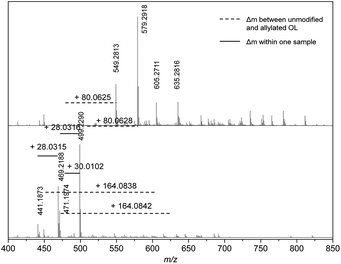 | ||
| Fig. 7 Mass spectra of unmodified (bottom) and allylated lignin (top) at a retention time of 18.0 minutes. | ||
Although the detected strong peaks can only be correlated to ether formation, some mass differences that could be correlated to carboxyallylation of aliphatic hydroxyl groups were also detected. At a retention time of 17.0 minutes, some mass fragments could be correlated to the carboxyallylation of the aliphatic hydroxyl groups of OL due to the observed mass differences of Δm = 124.0680 (1× ether + 1× carbonate), 164.0850 (2× ether + 1× carbonate), 248.1060 (2× ether + 2× carbonate) and 252.0642 (3× carbonate), which are in good agreement with the calculated mass differences (for detailed mass correlations, see ESI†). However, the peaks of those mass differences are rather weak, which could result from worse ionization of these products. At a retention time of 18.0 minutes, two new weak peaks appear in the mass spectrum of the allylated OL that can be likewise assigned to two peaks in the spectrum of OL with a corresponding mass difference of 164.0838 (2× ether + 1× carbonate).
Besides the observed mass differences in the unmodified and the allylated OL, a Δm of 28.0313 and 30.0104 is repeatedly observed for the different mass fragments within the same sample at all retention times. The exact mass difference of the mass fragments could be assigned to additional C2H4 and CH2O groups, respectively. The additional C2H4 unit most probably is a result of the pulping process, since the presence of ethanol and water can lead to the formation of an ethyl ether or an alcohol, respectively.38 Interestingly, the m/z values at a retention time of 18.0 minutes for the unmodified OL of 499.2290 and 471.1974 show this difference of 28.0351 (Fig. 7). The mass analysis of the allylated OL revealed that in the first case the corresponding twofold allyl etherified product (Δm = 80.0629) and for the second case a twofold allyl etherified and one fold carboxyallylated product (Δm = 164.0842) is found. The observation is in good agreement with the hypothesis of the introduced ethyl group that would prevent the carboxyallylation (proposed structures can be found in the ESI†). However, the intensity of the proposed ethyl ether product is higher. For all other discussed retention times, either no carboxyallylation was observed or the intensity of the carboxyallylated products was low, which also indicates that fewer aliphatic hydroxyl groups were present. Apparently either the amount of the ethyl functionalized products or non-aliphatic hydroxyl group-carrying molecules are higher or their ionization efficiency is increased compared to those containing aliphatic hydroxyl groups.
The frequently observed difference in CH2O (Δm = 30.0104) for different peaks at all retention times could result from a methoxy group. This indicates that the molecules inducing the m/z values of 499.2290 and 469.2188 at a retention time of 18 minutes would only differ in an additional methoxy group at the aromatic ring (Fig. 7, for proposed structures, see ESI†).
The exact masses obtained from the SEC–ESI–MS measurement allow the calculation of molecular formulas for the structure of the lignin fragments. Due to the fragmentation pattern and the mass defect, the range of C and H content is limited. Assuming that only oxygen is included as third element, that every formed allyl ether implies a phenolic unit (4 ring double bond (RDB) equivalents) and that the molecule is ionized with Na+, only one reasonable elemental formula is possible for each mass peak (for a list of elemental formulas, see ESI†). The obtained formulas reveal that cyclic structures, i.e. cyclic ethers, are necessary to propose defined structures. These structures may be rare in the overall lignin structure. Nevertheless, the cleavage of the α- and β-ether – that are the most frequently repeated linkages in the non-isolated lignin – is a key step in organosolv pulping.38 Thus, these ethers may be cleaved first, leaving the cyclic ethers in the molecules with low amount of C9 repeating units unmodified.
Self-metathesis of allylated OL
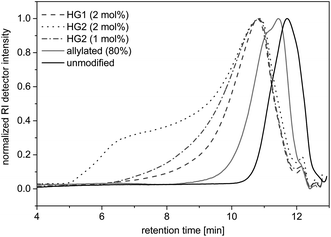
To demonstrate the accessibility of the allyl functions for further polymerizations, a self-metathesis of the allylated OL was performed in DCM with Hoveyda-Grubbs catalyst 1st and 2nd Generation (HG1 and HG2). SEC studies showed that products of higher molecular weights were formed after stirring at room temperature for 15 hours with a concentration of 0.1 mg mL−1 (Fig. 8). During the reaction, higher molecular weight products formed and the dispersity increased (see SEC trace of the reaction with 2 mol% of HG2 in Fig. 8). If higher concentrations (0.2 mg mL−1) were used, the solution gelled after stirring at room temperature for 60 or 30 minutes with HG1 or HG2, respectively. This indicates that the material started to crosslink. The final product was insoluble and could not be further analyzed. These first experiments prove that the allyl functional groups in modified lignin remain accessible and reactive and may, for instance, be converted using olefin metathesis.Conclusions
The efficient and sustainable allylation of beech wood OL including a detailed characterization was shown. Up to 90% of all hydroxyl groups were allylated using diallyl carbonate as reagent at relatively low temperatures between 90 and 120 °C. In a comparative screening, TBAB showed the highest reactivity towards the reaction compared to other bases. One of the advantages of TBAB is that it acts as phase transfer catalyst and no further solvent is necessary during the allylation reaction. An amount of at least 0.5 equivalents of TBAB per hydroxyl group is necessary for an efficient allylation reaction. However, this amount can be recovered quantitatively from the aqueous phase and recycled for further allylation reactions, which increases the sustainability of the reaction. With the aid of NMR and IR spectroscopy, the formation of the allyl function was proved. Furthermore, the SEC coupled mass spectra revealed new insights into the structure of lignin. The obtained exact mass differences showed mainly allyl ether formation and almost no carboxyallylation was observed for the detected masses, which might be due to a poor ionization efficiency for these structures. However, the carboxyallylation of aliphatic hydroxyl groups was proved by decarboxylation with LiOH. Thus, a higher content of aromatic hydroxyl groups compared to the amount of aliphatic hydroxyl groups is present in the low molecular weight lignin fragments. Although higher masses (>1000 g mol−1) were not detected, this method gives new information about structural motifs, such as the high probability of cyclic ethers in the structure. Performing the allylation of OL, a new functionality was introduced into the structure of lignin. As a short demonstration, the self-metathesis of the allylated OL showed how easily accessible the allyl functions are for further chemical transformations. Thus, the allylated product is a promising, sustainable starting material for further functionalization or direct polymerization.Acknowledgements
LCO is thankful for a PhD fellowship from the Deutsche Bundesstiftung Umwelt (German Federal Environmental Foundation, DBU). The authors are grateful to the Deutsche Forschungsgemeinschaft (German Research Council, DFG) in the context of §91b application under the auspices of Prof. C. Barner-Kowollik funding the Orbitrap mass spectrometer. The authors would like to thank colleagues at the Thünen Institute of Wood Research (Hamburg, Germany) for the performance of the organosolv pulping and the provision of the materials. We thank Marieke Poß for TGA measurements.References
- R. Whetten and R. Sederoff, Plant Cell, 1995, 7, 1001–1013 CrossRef CAS PubMed.
- D. S. Argyropouls and S. Ben Menachem, Adv. Biochem. Eng. Biotechnol., 1997, 127–158 CrossRef.
- P. J. Deuss and K. Barta, Coord. Chem. Rev., 2015 DOI:10.1016/j.ccr.2015.02.004.
- E. K. Pye, Pulping Conf., 1990, 991–996 Search PubMed.
- F. S. Chakar and A. J. Ragauskas, Ind. Crops Prod., 2004, 20, 131–141 CrossRef CAS.
- J. E. Holladay, J. F. White, J. J. Bozell and D. Johnson, in Top Value Added Chemicals from Biomass, 2007 Search PubMed.
- M. B. Hocking, J. Chem. Educ., 1997, 74, 1055–1059 CrossRef CAS.
- V. P. Saraf and W. G. Glasser, J. Appl. Polym. Sci., 1984, 29, 1831–1841 CrossRef CAS.
- C. A. Cateto, M. F. Barreiro, C. Ottati, M. Lopretti, A. E. Rodrigues and M. N. Belgacem, J. Cell. Plast., 2013, 50, 81–95 CrossRef.
- H. Zhu, Z. Peng, Y. Chen, G. Li, L. Wang, Y. Tang, R. Pang, Z. U. H. Khan and P. Wan, RSC Adv., 2014, 4, 55271–55279 RSC.
- P. C. Muller and W. G. Glasser, J. Adhes., 1984, 17, 157–173 CrossRef CAS.
- A. Tejado, G. Kortaberria, C. Pena, M. Blanco, J. Labidi, J. M. Echeverría and I. Mondragon, J. Appl. Polym. Sci., 2008, 107, 159–165 CrossRef CAS.
- H. Nitz, H. Semke and R. Mülhaupt, Macromol. Mater. Eng., 2001, 286, 737–743 CrossRef CAS.
- E. Jakab, O. Faix, F. Till and T. Székely, Holzforschung, 1991, 45, 355–360 CrossRef CAS.
- L. C.-F. Wu and W. G. Glasser, J. Appl. Polym. Sci., 1984, 29, 1111–1123 CrossRef CAS.
- I. Kühnel, J. Podschun, B. Saake and R. Lehnen, Holzforschung, 2015, 69, 531–538 CrossRef.
- A. W. Williamson, Liebigs Ann. Chem., 1851, 77, 37–49 CrossRef CAS.
- H. Sadeghifar, C. Cui and D. S. Argyropoulos, Ind. Eng. Chem. Res., 2012, 51, 16713–16720 CrossRef CAS.
- L. Zoia, A. Salati, P. Frigerio and M. Orlandi, BioResources, 2014, 9, 6540–6561 CrossRef CAS.
- P. Tundo, F. Trotta, G. Moraglio and F. Logorati, Ind. Eng. Chem. Res., 1988, 27, 1565–1571 CrossRef CAS.
- P. Tundo, G. Moraglio and F. Trotta, Ind. Eng. Chem. Res., 1989, 28, 881–890 CrossRef CAS.
- Y. Lee and I. Shimizu, Synlett, 1998, 1063–1064 CrossRef CAS.
- S. Ouk, S. Thiébaud, E. Borredon and P. Le Gars, Appl. Catal., A, 2003, 241, 227–233 CrossRef CAS.
- S. Ouk, S. Thiébaud, E. Borredon and P. Le Gars, Green Chem., 2002, 4, 431–435 RSC.
- S. Sen, S. Patil and D. S. Argyropoulos, Green Chem., 2015, 17, 1077–1087 RSC.
- J. N. G. Stanley, M. Selva, A. F. Masters, T. Maschmeyer and A. Perosa, Green Chem., 2013, 15, 3195 RSC.
- T. Weidlich, M. Pokorný, Z. Padělková and A. Růžička, Green Chem. Lett. Rev., 2007, 1, 53–59 CrossRef CAS.
- M. Selva, C. A. Marques and P. Tundo, J. Chem. Soc., Perkin Trans. 1, 1995, 1889–1893 RSC.
- O. Kreye, L. C. Over, T. Nitsche, R. Z. Lange and M. A. R. Meier, Tetrahedron, 2015, 71, 293–300 CrossRef CAS.
- H. Mutlu, J. Ruiz, S. C. Solleder and M. A. R. Meier, Green Chem., 2012, 14, 1728 RSC.
- T. Gruendling, M. Guilhaus and C. Barner-Kowollik, Anal. Chem., 2008, 80, 6915–6927 CrossRef CAS PubMed.
- A. Granata and D. S. Argyropoulos, J. Agric. Food Chem., 1995, 43, 1538–1544 CrossRef CAS.
- Y. Ono, Appl. Catal., A, 1997, 155, 133–166 CrossRef CAS.
- A. Bomben, M. Selva, T. Pietro and L. Valli, Ind. Eng. Chem. Res., 1999, 38, 2075–2079 CrossRef CAS.
- W.-C. Shieh, S. Dell and O. Repic, Org. Lett., 2001, 3, 4279–4281 CrossRef CAS PubMed.
- D. S. Argyropoulos, H. I. Bolker, C. Heitner and Y. Archipov, Holzforschung, 1993, 47, 50–56 CrossRef CAS.
- Z. Xia, L. G. Akim and D. S. Argyropoulos, J. Agric. Food Chem., 2001, 49, 3573–3578 CrossRef CAS PubMed.
- T. J. McDonough, TAPPI Solvent Pulping Symp, 1992 Search PubMed.
Footnote |
| † Electronic supplementary information (ESI) available: Quantitative 13C spectra and analysis, 1H NMR spectra after allylation and hydrolization, 1H spectrum of recovered TBAB and DAC, IR spectra of decarboxylation reaction, DSC traces, SEC traces, SEC–ESI–MS details: RI curve, mass spectra for different retention times, proposed chemical structures for exact mass peaks. See DOI: 10.1039/c5gc01882j |
| This journal is © The Royal Society of Chemistry 2016 |

