Nitrogen-doped CeOx nanoparticles modified graphitic carbon nitride for enhanced photocatalytic hydrogen production†
Jie
Chen
 ,
Shaohua
Shen
*,
Po
Wu
and
Liejin
Guo
*
International Research Centre for Renewable Energy, State Key Laboratory of Multiphase Flow in Power Engineering, Xi'an Jiaotong University, Shaanxi 710049, China. E-mail: shshen_xjtu@mail.xjtu.edu.cn; lj-guo@mail.xjtu.edu.cn; Fax: +86 82669033; Tel: +86 82668296
First published on 18th September 2014
Abstract
Nitrogen-doped CeOx nanoparticles (N-CeOx NPs) were directly formed on graphitic carbon nitride (g-C3N4) via a facile one-pot method by annealing a mixture of Ce(NO3)3 and melamine as CeOx and g-C3N4 precursors, respectively. Nitrogen was in situ doped into CeOx under NH3 atmosphere released by the decomposition of melamine during the annealing process. The physical and photophysical properties of N-CeOx NPs modified g-C3N4 photocatalysts were investigated to reveal the effects of N-CeOx NPs on the photocatalytic activities of g-C3N4. It was found that the one-pot annealing method was favorable for forming intimate interfacial contact between N-CeOx and g-C3N4. The visible light photocatalytic hydrogen production activity over g-C3N4 was enhanced by ca. 1.2 times with the N-CeOx NPs modification. The significant enhancement in photocatalytic performance for the N-CeOx/g-C3N4 heterojunction should be mainly because of the promoted charge transfer and charge separation between N-CeOx NPs and g-C3N4 resulting from the intimate interfacial contact and Type II band alignment. In addition, the improved visible light absorption of N-CeOx NPs induced by nitrogen doping could be another reason for the enhanced photocatalytic activity of the N-CeOx/g-C3N4 heterojunction.
Introduction
Photocatalytic water splitting to produce hydrogen over semiconductors by solar irradiation has received considerable attention due to its potential applications to alleviate the global energy crisis and environmental pollution. The development of efficient photocatalysts utilizing visible light (∼43% of the solar spectrum) is of vital importance to fulfill the practical applications of this technique. H2 production under visible light irradiation has been demonstrated with a myriad of semiconductor photocatalysts,1–3 including oxides, sulfides, and oxynitrides etc. However, some intrinsic drawbacks, such as poor optical absorption ability (e.g., TiO2,4 ZnO5) for wide band gap oxides, poor photochemical stability for sulfides (e.g., CdS6), and complicated preparation processes for oxynitrides (e.g., GaN![[thin space (1/6-em)]](https://www.rsc.org/images/entities/char_2009.gif) :
:![[thin space (1/6-em)]](https://www.rsc.org/images/entities/char_2009.gif) ZnO7), still significantly limit their practical application for photocatalytic solar-hydrogen conversion. To address these limitations, novel photocatalytic materials with efficient visible light absorption and good photochemical stability, as well as facile preparation methods must be developed for practical application of this state-of-the-art technique.
ZnO7), still significantly limit their practical application for photocatalytic solar-hydrogen conversion. To address these limitations, novel photocatalytic materials with efficient visible light absorption and good photochemical stability, as well as facile preparation methods must be developed for practical application of this state-of-the-art technique.
Since the first demonstration by Wang et al.,8 the novel metal-free polymer n-type semiconductor prepared by simply annealing cheap and abundant precursors (urea, melamine, dicyandiamide, and cyanamide), namely layered carbon nitride with a graphitic structure (g-C3N4), has attracted extensive interest because of its proper band gap (Eg ∼2.7 eV) and excellent photocatalytic stability.9 However, because of poor optical absorption above 460 nm and the fast recombination of photogenerated electron–hole pairs, the photocatalytic efficiency of pure g-C3N4 is relatively low. To enhance its photocatalytic performance, different methods have been exploited, including creating porous structures,10 doping with metal11 or non-metal ions,12 combining with other semiconductors13 and loading co-catalysts.14 Among them, combining g-C3N4 with other semiconductors to form semiconductor/g-C3N4 composite photocatalysts has been the most widely studied method. Several nanocomposites such as BiOBr/g-C3N4,13 TiO2/g-C3N4,15 ZnO/g-C3N4,16 Fe2O3/g-C3N4,17 and Ag2O/g-C3N4![[thin space (1/6-em)]](https://www.rsc.org/images/entities/char_2009.gif) 18 have been developed for improved charge separation and/or enhanced visible light absorption, leading to higher photocatalytic activities compared to pure g-C3N4.
18 have been developed for improved charge separation and/or enhanced visible light absorption, leading to higher photocatalytic activities compared to pure g-C3N4.
As a reactive rare earth oxide with outstanding catalytic properties, CeOx has been widely used in the solar cells, photocatalytic degradation of dye pollutants and hydrogen evolution.19,20 To date, various types of heterojunctions formed between CeOx and other semiconductors (e.g., TiO2,21 Cu2O,22 BiVO4,23 and CdS,.24) have been developed with enhanced photocatalytic performances because of the improved charge separation ability. However, in these CeOx/semiconductor composite photocatalysts, CeOx can only act as a Type II band alignment counterpart to improve the charge separation, but not as a visible light sensitizer because of its large band gap (Eg ∼2.9 eV) limiting its optical absorption in the visible light region. Nitrogen doping is a widely accepted approach to enhance the visible light response of CeOx as well as other wide band gap metal oxides.4,25,26 Mao et al.25 synthesized nitrogen doped CeOx (N-CeOx) through a wet-chemical route; the optical property of CeOx was considerably improved and the visible-light photocatalytic performance for methylene blue decomposition was enhanced. Jorge et al.26 prepared porous nitrogen doped CeOx with effective visible light-active performance for the decomposition of acetaldehyde by annealing mesoporous nanocrystalline ceria under NH3 at 550–700 °C. It should be noted that g-C3N4 can be easily synthesized from various simple precursors via a polycondensation reaction at 500–600 °C with the release of NH3.27,28 It becomes highly possible to dope nitrogen into the lattice of the semiconductors to form N-semiconductor/g-C3N4 heterojunctions by heating the mixture precursors of semiconductors and g-C3N4.29–31 However, as far as we know, N-CeOx/semiconductor composite photocatalysts with N-CeOx acting as an effective visible-light sensitizer have not yet been reported.
In the present study, we have successfully prepared a series of nitrogen doped CeOx nanoparticles (N-CeOx NPs) modified g-C3N4 photocatalysts via a facile one-pot method by simply heating a mixture of Ce(NO3)3 and melamine as CeOx and g-C3N4 precursors at 550 °C. The effect of N-CeOx NPs on the optical absorption and charge carrier separation, as well as the enhanced photocatalytic activities of g-C3N4, was thoroughly investigated.
Experimental details
Synthesis procedure
All chemicals in the present study were of analytical grade and used as received without further purification. N-CeOx NPs modified g-C3N4 photocatalysts were prepared via a facile one-pot method as illustrated in Fig. S1.† Typically, 3.0 g of melamine and V mL (V = 1, 3, 5, 7, 10, and 15 mL) of 0.031 g mL−1 Ce(NO3)3·6H2O aqueous solution were added to 200 mL of distilled water and heated at 90 °C for 1 h with stirring; the temperature was then increased to 100 °C for complete water evaporation. The resulting mixture was placed in an alumina crucible with a cover, and annealed at 550 °C under Ar flow (30 mL min−1) for 4 h with a ramping rate of 20 °C min−1. g-C3N4 modified with the different amounts of N-CeOx NPs by adding V mL of 0.031 g mL−1 Ce(NO3)3·6H2O aqueous solution is denoted as Ce-CN-V (V = 1, 3, 5, 7, 10, 15 mL).Pure g-C3N4 and CeOx were prepared by the same process without adding Ce(NO3)3 or melamine. Ce-CN-M composite as reference was prepared by the mechanical mixing of CeOx and pure g-C3N4. Ce-CN-T composite was also prepared as the reference by a two-step method, namely, annealing the grounded mixture of melamine and pure CeOx following the same heating process as described above. To be consistent with the loading amount of CeOx in Ce-CN-5, CeOx used for preparing Ce-CN-M and Ce-CN-T was obtained by heating and then annealing 5 mL of 0.031 g mL−1 Ce(NO3)3·6H2O aqueous solution at 550 °C. In addition, the reference samples of Ce-CN-M2 and Ce-CN-T2 were also prepared following the same preparation procedure as that for Ce-CN-M and Ce-CN-T, respectively, using 15 mL of Ce(NO3)3·6H2O aqueous solution as the CeOx precursors to be consistent with the loading amount of CeOx in Ce-CN-15.
Characterization
The transmission electron microscopy (TEM) images were obtained from a FEI Tecnai G2 F30 transmission electron microscope at an accelerating voltage of 300 kV. The X-ray diffraction (XRD) patterns were obtained from a PANalytical X'pert MPD Pro diffractometer operated at 40 kV and 40 mA using Ni-filtered Cu-Kα irradiation (Wavelength 1.5406 Å). UV-vis absorption spectra (UV-vis) were measured on a HITACHI U4100 instrument equipped with a labsphere diffuse reflectance accessory. Photoluminescence spectra (PL, including steady and time-resolved fluorescence emission) were carried out at room temperature on a PTI QM-4 fluorescence spectrophotometer. X-ray photoelectron spectroscopy (XPS) data were obtained on a Kratos Axis-Ultra DLD instrument with a monochromatized Al Kα line source (150 W). All the binding energies were referenced to the C 1s peak at 284.8 eV.Photocatalytic activity evaluation
Photocatalytic hydrogen evolution was performed in a gas-closed circulation system with a 230 mL Pyrex cell as the photoreactor. A 300 W Xe lamp was used as the light source, and the UV part of the irradiated light was removed by a 420 nm cut-off filter. The evolved hydrogen was analyzed on a thermal conductivity detector (TCD) gas chromatograph (NaX zeolite column, N2 as a carrier gas) every 60 min. In a typical experiment, the photocatalyst powder (50 mg) was dispersed in 200 mL of 10 vol% triethanolamine (TEOA) aqueous solution with stirring. Pt (1 wt%) was photodeposited in situ on the photocatalysts from the precursor of H2PtCl6·6H2O. Nitrogen was purged through the reactor for 15 min before the photocatalytic reaction to remove oxygen. The temperature for all the photocatalytic reactions was kept at 35 ± 0.5 °C by thermostatic water bath.Results and discussion
Fig. 1 shows the TEM images of the as-prepared Ce-CN-V (V = 1, 5, 10) photocatalysts. g-C3N4 photocatalyst exhibits a layered structure, as shown in Fig. 1A–C, which offered a good substrate for loading N-CeOx NPs. As demonstrated in Fig. 1A, for the Ce-CN-1 photocatalyst, N-CeOx NPs were evenly dispersed on g-C3N4 with a size range of 7–17 nm (See Fig. S2 in ESI† for the particle size distribution). When the volume of the Ce(NO3)3 precursor solution was increased to 5 mL, more N-CeOx NPs were found on the surface of g-C3N4 (Fig. 1B). Despite aggregation, no bulk CeOx was found on g-C3N4, and the particle size distribution of Ce-CN-5 was almost the same as that of Ce-CN-1, as shown in Fig. S2.† Further increasing the volume of Ce(NO3)3 precursor solution gave rise to more aggregates of N-CeOx NPs, covering larger areas of the g-C3N4 surface, as observed for Ce-CN-10 (Fig. 1C). It was reported that the shading effect induced by nanoparticle aggregation was detrimental for the photocatalytic hydrogen production reaction due to covering of the active species on the surface of the photocatalyst.32,33 As shown in Fig. 1D, the fringe spacings of N-CeOx in Ce-CN-5 were measured to be 3.18 Å and 1.96 Å, corresponding to the (111) and (220) lattice planes of cubic CeOx, respectively, which are slightly larger than the reported values of the (111) and (220) lattice planes of cubic CeOx (3.12 Å and 1.91 Å, JCPDS 004-0593). This phenomenon is very likely because nitrogen was introduced into the crystal lattice of CeOx, and thus the lattice parameters of nitrogen doped CeOx in Ce-CN-V nanocomposites became larger than those of pure CeOx due to the substitution of 4-coordinated O2− (ionic radius: 1.38 Å) by N3− (ionic radius: 1.46 Å) in CeOx.34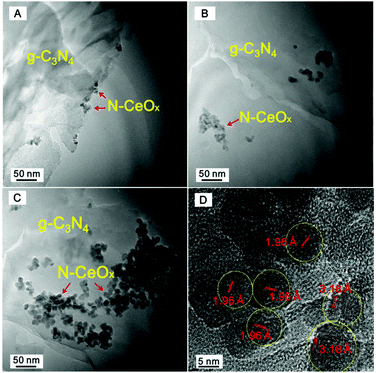 | ||
| Fig. 1 TEM images of Ce-CN-V photocatalysts: (A) V = 1 mL, (B) V = 5 mL, (C) V = 10 mL. (D) The magnified TEM image of Ce-CN-5. | ||
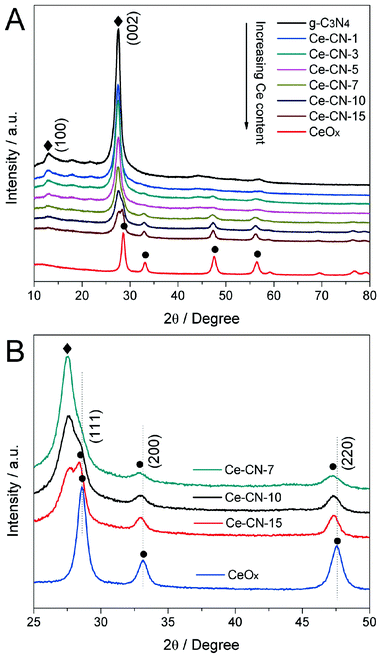
X-ray diffraction (XRD) patterns for g-C3N4, CeOx and Ce-CN-V photocatalysts were acquired to investigate their crystal structures. As shown in Fig. 2A, the (100) peak at 2θ = 13.0° corresponding to the d value of 0.676 nm is related to an in-plane structural packing motif of g-C3N4, such as the hole-to-hole distance of the nitride pores in the crystal.35 Both pure g-C3N4 and Ce-CN-V nanocomposites show a strong characteristic (002) peak at 2θ = 27.4°, corresponding to the interlayer-stacking of the conjugated aromatic system with a stacking distance of 0.326 nm, indicating that the as-prepared nanocomposites possess layered structures of g-C3N4. It was also found that with increased N-CeOx amounts in the nanocomposites, the relative intensity of both (100) and (002) peaks were significantly decreased; this was possibly due to the deposition of N-CeOx on the surface of g-C3N4.13 Here, the weakening of the (100) peak could be attributed to a slight distortion of the nitride pores, caused by N-CeOx modification, which changed the hole to hole distance.35,36 For the (002) peak, the weakening could result from a decrease in structural correlation length induced by the introduction of small sized N-CeOx NPs.37,38
The XRD peaks of pure CeOx were in good agreement with the cubic phase of CeOx (JCPDS 004-0593). For Ce-CN-V nanocomposites, with increase in the volume of Ce(NO3)3 precursor solution, the CeOx diffraction peaks gradually appeared and became stronger, indicating the presence of more N-CeOx NPs in the nanocomposites. However, as shown in Fig. 2B, the XRD peaks at 2θ = 28.6°, 33.1°, and 47.5° for CeOx slightly shifted to lower angles for Ce-CN-V, which should be attributed to the substitution of 4-coordinated O2− (ionic radius: 1.38 Å) by N3− (ionic radius: 1.46 Å) in CeOx.34 This is understandable because the nitrogen doping had occurred in CeOx NPs obtained by annealing Ce(NO3)3 precursor in the NH3 atmosphere25,26 created by heating melamine at 550 °C, as described in Fig. S1 and S3 in ESI†. In addition, when compared with the reference samples of Ce-CN-T2 and Ce-CN-M2, these three XRD peaks also slightly shifted to lower angles for Ce-CN-15, as shown in Fig. S4 in ESI†. These results could help in distinguishing the N-CeOx NPs modified g-C3N4 from CeOx/g-C3N4 composites, which again indicates that the one-pot method was favorable for nitrogen doping into the lattice of CeOx, as compared to the mechanical mixing or two-step method.
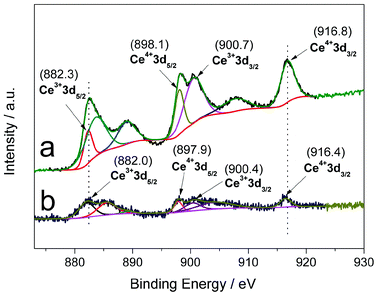
As determined by the XPS analysis (Fig. S5†), the actual weight ratios of Ce in Ce-CN-V (V = 1, 3, 5, 7, 10, and 15 mL) were determined to be 0.95, 2.45, 4.22, 5.88, 8.52 and 12.82 wt%, respectively. The weight contents for all the elements (C, N, O, Ce) in g-C3N4 and Ce-CN-V were also calculated, and are listed in Table S1 in ESI†. Ce 3d XPS spectra of pure CeOx (Fig. 3a) and Ce-CN-15 (Fig. 3b) were further compared to provide evidence that nitrogen was indeed introduced into the crystal lattice of CeOx. As shown in Fig. 3, because of the highly non-stoichiometric nature of CeOx, both 3+ and 4+ states are present in CeOx and Ce-CN-5. It should be noted that the Ce 3d binding energies (both Ce3+ and Ce4+) of Ce-CN-5 are slightly lower than those of pure CeOx. For example, the binding energies of Ce4+ 3d3/2, Ce4+ 3d5/2, Ce3+ 3d3/2 and Ce3+ 3d5/2 for pure CeOx are centered at ca. 916.8, 898.1, 900.7 and 882.3 eV, respectively; while those for Ce-CN-5 are located at 916.4, 897.9, 900.4 and 882.0 eV, respectively. Such lower shifts in the Ce 3d binding energies for Ce-CN-5 should be attributed to an increase in electron density around the Ce cation (Ce-N > Ce-O), which was induced by the replacement of oxygen atoms by nitrogen atoms with lower electronegativity.25,39
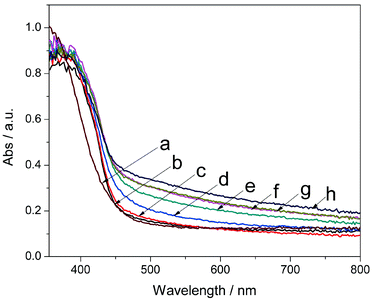
Fig. 4 shows UV-vis absorption spectra obtained to evaluate the optical absorption properties of the as-prepared photocatalysts. As calculated by the Kubelka–Munk method,40,41 the absorption edges of pure g-C3N4 and CeOx at around 460 nm and 430 nm correspond to the band gaps of 2.70 eV and 2.90 eV, respectively. The narrowed band gap and band position fine-tuning of CeOx by nitrogen doping was also confirmed by DFT calculation (see Computational Methods and Fig. S6 in ESI†). By forming nanocomposites, the absorption edge showed a gradual red shift to 490 nm for Ce-CN-15 with increasing N-CeOx loading amounts. It was also found that the light absorption in the range of λ > 500 nm was obviously enhanced, which was mainly due to the nitrogen doping-induced significant increase of the light absorption above 500 nm.25,26,34 The enhanced visible light absorption was beneficial for the photocatalytic performance, which is widely reported.17,18 However, for the Ce-CN-V (V = 1, 3, 5, 7, 10, and 15 mL) photocatalysts, the increasing N-CeOx loading amounts, which could gradually enhance the visible light absorption, would give rise to increasing serious shading effects,32,33,41 and thus they offset the benefit of the light absorption of N-CeOx. As a result, this negative shading effect induced by the excessive loading of N-CeOx NPs leads to decreased photocatalytic activity for hydrogen production, which is verified by the hydrogen production evaluation of the Ce-CN-V photocatalysts in the later sections.
It can be also noted that the visible light absorption of Ce-CN-5 was significantly enhanced compared to Ce-CN-T or Ce-CN-M (See Fig. S7 in ESI†), especially in the range of λ > 500 nm. This should be attributed to the fact that nitrogen was hardly introduced into the lattice of CeOx by the two-step or mechanical method, and thus the visible light absorption ability of Ce-CN-5 with N-CeOx modification was considerably stronger than that of Ce-CN-T or Ce-CN-M with only CeOx modification.
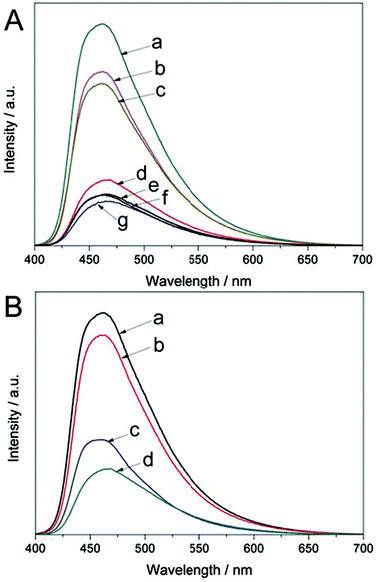
The photoluminescence (PL) emission spectra are very useful for understanding the behavior of photo-generated charge carriers in photocatalysts because PL emission results from the irradiative recombination of electrons and holes.42Fig. 5A shows the PL spectra for the as-prepared Ce-CN-V photocatalysts. All the photocatalysts exhibited a broad emission peak centered at around 460 nm, and a tail extending to 700 nm. The emission could be attributed to the band-band PL phenomenon related to the recombination of photoinduced electrons and holes in g-C3N4.41,43 The PL emission intensity exhibits the highest value for pure g-C3N4 and monotonously decreases with increasing N-CeOx content. This indicates that the recombination of photogenerated charge carriers is inhibited in the Ce-CN-V photocatalysts because of the efficient separation of the photo-induced electron hole pairs in the N-CeOx/g-C3N4 heterojunctions.
To prove that the N-CeOx/g-C3N4 heterojunctions prepared by the one-pot annealing method are superior for charge carrier separation, the PL spectra of the reference samples (Ce-CN-T, Ce-CN-M) were also obtained for comparison, as shown in Fig. 5B. For the Ce-CN-T photocatalyst prepared by the two-step method, the PL intensity was stronger than that of Ce-CN-5, indicating poorer charge separation in Ce-CN-T than in Ce-Ce-5. This phenomenon should be due to the larger size of CeOx nanoparticles, and thus the poorer interfacial contact between CeOx and g-C3N4 (as evidenced in Fig. S8C, D in ESI†), which consequently results in less efficient charge separation in Ce-CN-T. Moreover, for the mechanical mixture sample of Ce-CN-M, the PL emission intensity was significantly stronger relative to Ce-CN-T, indicating very poor charge separation between CeOx and g-C3N4 in Ce-CN-M. This is reasonable because of the serious aggregation of CeOx nanoparticles and loose interfacial contact between CeOx and g-C3N4 (Fig. S8E, F in ESI†) obtained by simply mechanical mixing the CeOx and g-C3N4.
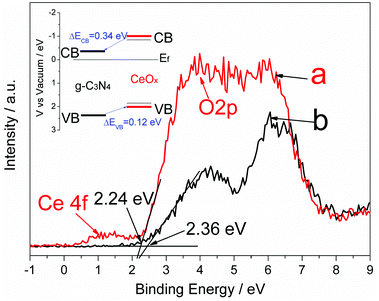
The charge separation in composite photocatalysts is usually related to the band alignment induced charge transfer at the interfaces of the two components (e.g., type II band alignment).41 In the present work, the valence band maximum (VBM) edge potentials of CeOx and g-C3N4 were measured by valence band X-ray photoelectron spectroscopy (VB XPS) to estimate the band alignment for the Ce-CN-V photocatalysts. As shown in Fig. 6, the peak assigned to Ce 4f can be observed at ∼1.5 eV. It was reported that Ce 4f was present for Ce2O3 but was absent for pure CeO2,44 confirming the presence of Ce3+. The band stretching from ca. 3 to 8 eV is assigned to the O 2p orbitals.44 For CeOx, the valence band is derived from the O 2p orbitals, and the band gap of 2.9 eV is derived from the O 2p–Ce 4f transition;24,44 thus, the VBM edge of the as-prepared CeOx is estimated to be approximately 2.24 eV below the Fermi band (Ef) from the VB XPS spectra. For g-C3N4, the VBM edge is estimated to be 2.36 eV from Fig. 6, which is in accordance with our previous reports.41,43 According to the equation ECB = EVB − Eg,41,45 the ECB of CeOx and g-C3N4 were calculated to be 0.66 eV and 0.32 eV above Ef, respectively. Based on the above deduction, as illustrated in Fig. 6, the ECB difference of 0.34 eV could facilitate the electron transfer from the conduction band of CeOx to that of g-C3N4, while the EVB difference of 0.12 eV will favor hole transfer from the valence band of g-C3N4 to that of CeOx. It should be noted that because of nitrogen doping in N-CeOx, the real Eg value for the N-CeOx must be smaller (dotted line in Fig. 6), as suggested by the improved visible light absorption and DFT calculation results, leading to enhanced visible light response of the nanocomposite photocatalysts of N-CeOx/g-C3N4 (e.g., the as-prepared Ce-CN-V heterojunctions).
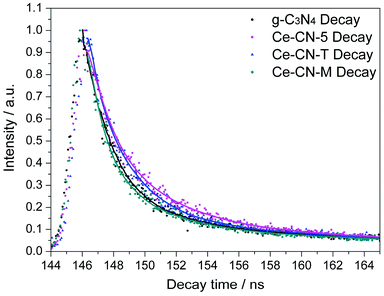
To further confirm the efficient charge separation between N-CeOx and g-C3N4 induced by Type II band alignment and intimate interfacial contact, time-resolved fluorescence emission decay spectra of Ce-CN-5, with g-C3N4, Ce-CN-M, and Ce-CN-T as references, were measured at room temperature, as shown in Fig. 7. The kinetic parameters for these as-prepared samples are summarized in Table 1. The average lifetimes of the carriers (τavg) were determined to be 4.94 ns, 4.99 ns, 9.85 ns and 21.10 ns for g-C3N4, Ce-CN-M, Ce-CN-T and Ce-CN-5, respectively (see decay kinetics calculation in the ESI†), indicating that the charge recombination in g-C3N4 was effectively inhibited when modified with N-CeOx (or CeOx) nanoparticles.41,43,45 In particular, the N-CeOx/g-C3N4 heterojunction prepared by the one-pot annealing method (Ce-CN-5) showed significantly prolonged carrier lifetime when compared to the reference samples of g-C3N4, Ce-CN-M and Ce-CN-T, which again confirmed the efficient charge transfer and separation between N-CeOx and g-C3N4, due to the intrinsic straddling (Type II) band alignment and the intimate interfacial contact.
| Samples | A 1 | τ 1 (ns) | A 2 | τ 2 (ns) | A 3 | τ 3 (ns) | τ avg (ns) | χ 2 |
|---|---|---|---|---|---|---|---|---|
| g-C3N4 | 0.1109 | 1.425 | 0.8667 | 0.033 | 0.0224 | 8.558 | 4.94 | 0.9571 |
| Ce-CN-M | 0.1274 | 7.929 | 0.4567 | 1.410 | 0.4159 | 0.343 | 4.99 | 0.9606 |
| Ce-CN-T | 0.2987 | 4.122 | 0.6196 | 1.207 | 0.0817 | 18.69 | 9.85 | 1.054 |
| Ce-CN-5 | 0.2488 | 2.269 | 0.1195 | 25.80 | 0.6317 | 0.295 | 21.10 | 0.9335 |
The photocatalytic activity of N-CeOx NPs modified g-C3N4 photocatalysts (Ce-CN-V, V = 1, 3, 5, 7, 10, and 15 mL) was evaluated by the hydrogen production reaction under visible light (λ > 420 nm). Pt (1 wt%) was used as the co-catalyst, providing hydrogen evolution sites on the as-prepared photocatalyst for efficient photocatalytic hydrogen production (Fig. S9 in ESI†).8,46–48
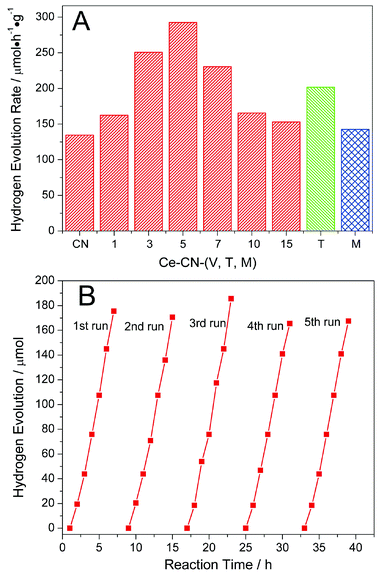
As shown in Fig. 8A, all the samples are photocatalytically active, and no hydrogen was detected in the absence of either photocatalyst or light irradiation. The rate of hydrogen evolution over pure g-C3N4 was 134.5 μmol h−1 g−1. As N-CeOx content increased, the photocatalytic activity of Ce-CN-V was significantly improved, with the highest hydrogen evolution rate (292.5 μmol h−1 g−1) achieved for Ce-CN-5, which was about 2.2 times that of pure g-C3N4. However, the photocatalytic activity decreased as the N-CeOx content of Ce-CN-V was further increased (V = 7, 10, and 15 mL).
To clarify the mechanism for photocatalytic H2 production over Ce-CN-V, it is necessary to clarify how the N-CeOx NPs influence the activity of g-C3N4; which is based on three effects resulting from N-CeOx NPs modification: (1) efficient charge separation between g-C3N4 and N-CeOx induced by the formed Type II band alignment,15,16 (2) N-CeOx acting as visible light sensitizers,17,18 (3) the negative shading effect of the excessive N-CeOx.32,33,41 For the Ce-CN-V (V = 1, 3, and 5 mL) photocatalysts, as shown from the UV-vis and PL spectra in Fig. 4 and 5A, both the visible light absorption and charge separation efficiency were improved with increasing loading amounts of N-CeOx NPs, leading to a gradual increase in photocatalytic activity for hydrogen evolution. In addition, it is noteworthy that both the optical absorption enhancement and the shading effect were related to the N-CeOx content; thus, larger the N-CeOx content, the stronger are the two effects. As seen from Fig. 4, the visible light absorption increased with the increase in the N-CeOx loading amounts, while the N-CeOx NPs aggregated as observed in Fig. 1C, leading to the negative shading effect of aggregated N-CeOx NPs. Thus, for Ce-CN-V (V = 7, 10, and 15 mL), although the light absorption ability was improved by increasing the N-CeOx loading amounts, the negative shading effect induced by the aggregation of N-CeOx NPs became more significant, leading to a decrease in photocatalytic performance. Therefore, the three factors mentioned above balanced and competed with each other, eventually resulting in the highest photocatalytic performance for the Ce-CN-5 photocatalyst with optimized N-CeOx loading.
To investigate the photocatalytic stability, the photocatalytic experiment for hydrogen production was run for 5 cycles. As shown in Fig. 8B, Ce-CN-5 shows good stability for photocatalytic hydrogen production, with the hydrogen production rate remaining almost unchanged during the 35 h reaction.
Hydrogen production over the reference samples of Ce-CN-M (mechanical mixture) and Ce-CN-T (two-step prepared) was also tested to prove the photocatalytic superiority of the N-CeOx/g-C3N4 heterojunction formed by the one-pot annealing method. As shown in Fig. 8A, the reference Ce-CN-T sample shows lower photocatalytic activity (201.7 μmol h−1 g−1) than the Ce-CN-5 sample (292.5 μmol h−1 g−1). This may be due to the limited visible light absorption ability of CeOx (Eg ∼2.9 eV) without nitrogen doping as well as the considerably larger CeOx nanoparticles hindering the charge transfer and separation between g-C3N4 and CeOx in Ce-CN-T (as evidenced by the PL properties in Fig. 5 and 7). Moreover, the Ce-CN-M reference sample, with a hydrogen production rate of only 142.5 μmol h−1 g−1, shows considerably lower photocatalytic activity than Ce-CN-T, but close to that of pure g-C3N4. This may be because the mechanical method did not form CeOx/g-C3N4 heterojunctions with intimate interfacial contact because of the serious aggregation of CeOx nanoparticles, resulting in a very low efficiency of charge transfer and separation between the two components.
To prove the existence and function of Pt nanoparticles as hydrogen evolution sites, TEM images for Pt loaded Ce-CN-5 after the photocatalytic hydrogen production reaction were obtained, as shown in Fig. S9 in ESI†. Pt NPs with an average size of ca. 10 nm were only formed on the surface of g-C3N4 for both pure g-C3N4 and Ce-CN-5, indicating that Pt NPs were preferentially reduced by the CB electrons from g-C3N4. Therefore, the Pt NPs acted as the reduction active sites on g-C3N4 to entrap photoinduced electrons for photocatalytic hydrogen production, which has been evidenced by previous studies.8,43,46–48
As analyzed above, a possible photocatalytic mechanism of the as-prepared N-CeOx NPs modified g-C3N4 nanocomposites for photocatalytic hydrogen production under visible light was proposed, and it is illustrated in Fig. 9. Upon visible light irradiation, both N-CeOx and g-C3N4 were photo-excited to produce CB electrons and VB holes. Because of the VB and CB energy level difference between the two components, the CB electrons in N-CeOx could easily transfer to the CB of g-C3N4, which could then get accumulated at Pt reduction active sites for the H2 production reaction, while the VB holes in g-C3N4 tended to transfer to the VB of N-CeOx to react with the sacrificial reagent in the aqueous solution. In this Pt/N-CeOx/g-C3N4 system, N-CeOx acted as a sensitizer improving the light absorption, and the Type II band alignment formed between N-CeOx and g-C3N4 efficiently separated the electron–hole pairs. Thus, the enhanced photocatalytic efficiency for hydrogen production under visible light was obtained over N-CeOx NPs modified g-C3N4 when compared to pure g-C3N4.
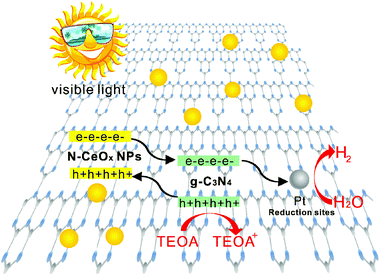 | ||
| Fig. 9 Schematic of band structure and charge transfer process in N-CeOx NPs/g-C3N4 for photocatalytic hydrogen generation. | ||
Conclusions
Nitrogen-doped CeOx nanoparticles modified g-C3N4 photocatalysts were successfully prepared via a one-pot annealing method. The photocatalytic activity for hydrogen production over g-C3N4 under visible light was significantly improved by nitrogen-doped CeOx NPs modification. The photoactivity was enhanced by ∼1.2 times, and the hydrogen evolution rate increased from 134.5 μmol h−1 g−1 for pure g-C3N4 to 292.5 μmol h−1 g−1 for the optimized sample of nitrogen-doped CeOx NPs modified g-C3N4 prepared by the one-pot method. It was believed that the significantly enhanced photocatalytic activity was mainly attributed to the improved visible light absorption with nitrogen-doped CeOx NPs acting as sensitizers, as well as the Type II band alignment-induced efficient charge separation between nitrogen-doped CeOx NPs and g-C3N4 with intimate interfacial contact. The present study presents a new facile method for nitrogen doping and heterojunction formation, which might provide novel opportunities for exploring nanostructured heterojunctions for photo(electro)catalytic and optoelectronic applications.Acknowledgements
The authors gratefully acknowledge the financial supports from the National Natural Science Foundation of China (no. 51102194, no. 51323011, no. 51121092), the Natural Science Foundation of Shaanxi Province (no. 2014KW07-02), the Natural Science Foundation of Jiangsu Province (no. BK20141212) and the Nano Research Program of Suzhou City (no. ZXG201442, ZXG2013003). One of the authors (S. Shen) was supported by the Foundation for the Author of National Excellent Doctoral Dissertation of China (no. 201335) and the “Fundamental Research Funds for the Central Universities.”Notes and references
- K. Akihiko and M. Yugo, Chem. Soc. Rev., 2009, 38, 253–278 RSC.
- K. Zhang and L. J. Guo, Catal. Sci. Technol., 2013, 3, 1672–1690 CAS.
- X. Chen, S. Shen, L. Guo and S. S. Mao, Chem. Rev., 2010, 110, 6503–6570 CrossRef CAS PubMed.
- L. L. Amy, G. Q. Lu and T. Y. John, Chem. Rev., 1995, 95, 735–758 CrossRef.
- P. Li, Z. Wei, T. Wu, Q. Peng and Y. D. Li, J. Am. Chem. Soc., 2011, 133, 5660–5663 CrossRef CAS PubMed.
- J. Fang, L. Xu, Z. Zhang, Y. Yuan, S. Cao, Z. Wang, L. S. Yin, Y. S. Liao and C. Xue, ACS Appl. Mater. Interfaces, 2013, 5, 8088–8092 CAS.
- M. Kazuhiko, T. Tsuyoshi, H. Michikazu, S. Nobuo, I. Yasunobu, K. Hisayoshi and D. Kazunari, J. Am. Chem. Soc., 2005, 127, 8286–8287 CrossRef PubMed.
- X. C. Wang, K. Maeda, A. Thomas, K. Takanabe, G. Xin, J. M. Carlsson, K. Domen and M. Antonietti, Nat. Mater., 2009, 8, 76–80 CrossRef CAS PubMed.
- X. C. Wang, B. Siegfried and A. Markus, ACS Catal., 2012, 2, 1596–1606 CrossRef CAS.
- J. Liang, Y. Zheng, J. Chen, J. D. Hulicova, M. Jaroniec and S. Z. Qiao, Angew. Chem., Int. Ed., 2012, 51, 3892–3896 CrossRef CAS PubMed.
- X. F. Chen, J. S. Zhang, X. Z. Fu, M. Antonietti and X. C. Wang, J. Am. Chem. Soc., 2009, 131, 11658–11659 CrossRef CAS PubMed.
- G. Liu, P. Niu, C. Sun, C. S. Smith, Z. G. Chen, G. M. Lu and H. M. Cheng, J. Am. Chem. Soc., 2010, 132, 11642–11648 CrossRef CAS PubMed.
- J. Fu, Y. L. Tian, B. B. Chang, F. N. Xi and X. P. Dong, J. Mater. Chem., 2012, 22, 21159–21166 RSC.
- K. Maeda, X. Wang, Y. Nishihara, D. Lu, M. Antonietti and K. Domen, J. Phys. Chem. C, 2009, 113, 4940–4947 CAS.
- H. Yan and H. Yang, J. Alloys Compd., 2011, 509, 26–29 CrossRef PubMed.
- Y. J. Wang, R. Shi, J. Lin and Y. F. Zhu, Energy Environ. Sci., 2011, 4, 2922–2929 CAS.
- S. Ye, L. G. Qiu, Y. P. Yuan, Y. J. Zhu, J. Xia and J. F. Zhu, J. Mater. Chem. A, 2013, 1, 3008–3015 CAS.
- M. Xu, L. Han and S. Dong, ACS Appl. Mater. Interfaces, 2013, 5, 12533–12540 CAS.
- A. Primo, T. Marino, A. Corma, R. Molinari and H. Garcia, J. Am. Chem. Soc., 2011, 133, 6930–6933 CrossRef CAS PubMed.
- S. Kundu, J. Ciston, S. D. Senanayake, D. A. Arena, E. Fujita, D. Stacchiola, L. Barrio, R. M. Navarro, J. L. G. Fierro and J. A. Rodriguez, J. Phys. Chem. C, 2012, 116, 14062–14070 CAS.
- Y. Wang, B. Li, C. Zhang, L. Cui, S. Kang, X. Li and L. Zhou, Appl. Catal., B, 2013, 130, 277–284 CrossRef PubMed.
- S. Hu, F. Zhou, L. Wang and J. Zhang, Catal. Commun., 2011, 12, 794–797 CrossRef CAS PubMed.
- N. Wetchakun, S. Chaiwichain, B. Inceesungvorn, K. Pingmuang, S. Phanichphant, A. I. Minett and J. Chen, ACS Appl. Mater. Interfaces, 2012, 4, 3718–3723 CAS.
- W. Li, S. Xie, M. Li, X. Ouyang, G. Cui, X. Lu and Y. Tong, J. Mater. Chem. A, 2013, 1, 4190–4193 CAS.
- C. Mao, Y. Zhao, X. Qiu, J. Zhu and C. Burda, Phys. Chem. Chem. Phys., 2008, 10, 5633–5638 RSC.
- A. B. Jorge, Y. Sakatani, C. Boissiere, C. Roberts, G. Sauthier, J. Fraxedas, C. Sanchez and A. Fuertes, J. Mater. Chem., 2012, 22, 3220–3226 RSC.
- G. Zhang, J. Zhang, M. Zhang and X. Wang, J. Mater. Chem., 2012, 22, 8083–8091 RSC.
- S. C. Yan, Z. S. Li and Z. G. Zou, Langmuir, 2009, 25, 10397–10401 CrossRef CAS PubMed.
- G. Li, N. Yang, W. Wang and W. F. Zhang, J. Phys. Chem. C, 2009, 113, 14829–14833 CAS.
- Q. Li, B. Yue, H. Iwai, T. Kako and J. H. Ye, J. Phys. Chem. C, 2010, 114, 4100–4105 CAS.
- Y. Liu, G. Chen, C. Zhou, Y. Hu, D. Fu, J. Liu and Q. Wang, J. Hazard. Mater., 2011, 190, 75–80 CrossRef CAS PubMed.
- M. Y. Wang, L. Sun, Z. Q. Lin, J. H. Cai, K. P. Xie and C. J. Lin, Energy Environ. Sci., 2013, 6, 1211–1220 CAS.
- Y. D. Hou, A. B. Laursen, J. S. Zhang, G. G. Zhang, Y. S. Zhu, X. C. Wang, S. Dahl and I. Chorkendorff, Angew. Chem., Int. Ed., 2013, 52, 3621–3625 CrossRef CAS PubMed.
- D. Sun, M. Gu, R. Li, S. Yin, X. Song, B. Zhao, C. Li, J. Li, Z. Feng and T. Sato, Appl. Surf. Sci., 2013, 280, 693–697 CrossRef CAS PubMed.
- A. Thomas, A. Fischer, F. Goettmann, M. Antonietti, J. O. Müller, R. Schlögl and J. M. Carlsson, J. Mater. Chem., 2008, 18, 4893–4908 RSC.
- Y. J. Zhang, A. Thomas, M. Antonietti and X. C. Wang, J. Am. Chem. Soc., 2008, 131, 50–51 CrossRef PubMed.
- Y. B. Li, H. M. Zhang, P. R. Liu, D. Wang, Y. Li and H. J. Zhao, Small, 2013, 9, 3336–3344 CAS.
- X. H. Li, X. C. Wang and M. Antonietti, ACS Catal., 2012, 2, 2082–2086 CrossRef CAS.
- R. Li, C. Fu, C. Q. Li, S. Yin, Y. Zhang and T. Sato, J. Ceram. Soc. Jpn., 2010, 118, 555–557 CrossRef CAS.
- V. Kumar, S. K. Sharma, T. P. Sharma and V. Singh, Opt. Mater., 1999, 12, 115–119 CrossRef CAS.
- J. Chen, S. Shen, P. Guo, M. Wang, P. Wu, X. Wang and L. Guo, Appl. Catal., B, 2014, 152–153, 335–341 CrossRef CAS PubMed.
- S. Shen, P. Guo, L. Zhao, Y. Du and L. Guo, J. Solid State Chem., 2011, 184, 2250–2256 CrossRef CAS PubMed.
- J. Chen, S. Shen, P. Guo, P. Wu and L. Guo, J. Mater. Chem. A, 2014, 2, 4605–4612 CAS.
- D. R. Mullins, S. H. Overbury and D. R. Huntley, Surf. Sci., 1998, 409, 307–319 CrossRef CAS.
- J. Zhang, M. Zhang, R. Q. Sun and X. C. Wang, Angew. Chem., Int. Ed., 2012, 124, 10292–10296 CrossRef.
- J. Zhang, Q. Xu, Z. Feng, M. Li and C. Li, Angew. Chem., Int. Ed., 2008, 47, 1766–1769 CrossRef CAS PubMed.
- P. Gao, J. C. Liu, S. Lee, T. Zhang and D. D. Sun, J. Mater. Chem., 2012, 22, 2292–2298 RSC.
- S. R. Lingampalli, U. K. Gautam and C. N. R. Rao, Energy Environ. Sci., 2013, 6, 3589–3594 CAS.
Footnote |
| † Electronic supplementary information (ESI) available: The illustrations for the fabrication and formation process of Ce-CN-V photocatalysts, particle size distribution histogram, XPS, DFT calculation results, UV-vis, PL spectra, TEM images and decay kinetics for the as-prepared photocatalysts. See DOI: 10.1039/c4gc01683a |
| This journal is © The Royal Society of Chemistry 2015 |

