
 Open Access Article
 This Open Access Article is licensed under a
 Creative Commons Attribution 3.0 Unported Licence
Capsaicin, nonivamide and trans-pellitorine decrease free fatty acid uptake without TRPV1 activation and increase acetyl-coenzyme A synthetase activity in Caco-2 cells
Barbara
Rohm
ab,
Annett
Riedel
b,
Jakob P.
Ley
c,
Sabine
Widder
c,
Gerhard E.
Krammer
c and
Veronika
Somoza
*ab
aChristian Doppler Laboratory for Bioactive Aroma Compounds, Faculty of Chemistry, University of Vienna, Althanstraße 14, 1090 Vienna, Austria. E-mail: Veronika.Somoza@univie.ac.at; Fax: +43 1 4277 9706; Tel: +43 1 4227 70601
bDepartment of Nutritional and Physiological Chemistry, Faculty of Chemistry, University of Vienna, Althanstraße 14, 1090 Vienna, Austria
cSymrise AG, Mühlenfeldstraße, 37603 Holzminden, Germany
First published on 10th November 2014
Abstract
Red pepper and its major pungent component, capsaicin, have been associated with hypolipidemic effects in rats, although mechanistic studies on the effects of capsaicin and/or structurally related compounds on lipid metabolism are scarce. In this work, the effects of capsaicin and its structural analog nonivamide, the aliphatic alkamide trans-pellitorine and vanillin as the basic structural element of all vanilloids on the mechanisms of intestinal fatty acid uptake in differentiated intestinal Caco-2 cells were studied. Capsaicin and nonivamide were found to reduce fatty acid uptake, with IC50 values of 0.49 μM and 1.08 μM, respectively. trans-Pellitorine was shown to reduce fatty acid uptake by 14.0 ± 2.14% at 100 μM, whereas vanillin was not effective, indicating a pivotal role of the alkyl chain with the acid amide group in fatty acid uptake by Caco-2 cells. This effect was associated neither with the activation of the transient receptor potential cation channel subfamily V member 1 (TRPV1) or the epithelial sodium channel (ENaC) nor with effects on paracellular transport or glucose uptake. However, acetyl-coenzyme A synthetase activity increased (p < 0.05) in the presence of 10 μM capsaicin, nonivamide or trans-pellitorine, pointing to an increased fatty acid biosynthesis that might counteract the decreased fatty acid uptake.
Introduction
Dietary fats are essential for normal body function, since they not only provide energy, but also essential fatty acids and facilitate the uptake of fat-soluble vitamins. However, the recommended total fat intake of 20–35% of total calories for adults is exceeded by large proportions of Western populations, despite longstanding dietary recommendations.1 An excessive energy (including fat) intake over energy expenditure has been demonstrated to be a major risk factor for various cancers, osteoporosis, dementia, and chronic diseases, such as obesity, diabetes, hyperlipidemia or hypercholesterolemia associated with macrovascular disease.1,2 Dietary measures to reduce the total energy or total fat uptake not only include a reduced food intake, but also administration of satiating compounds or compounds that limit intestinal lipid digestion. Lipase inhibitors prevent the enzymatic cleavage of triacylglycerols, which results in a reduced intestinal fatty acid uptake. However, inhibition of lipase activity in the gut has been associated with side effects, e.g. impaired availability of lipid soluble vitamins. Compounds specifically targeting the mechanisms of fatty acid uptake might allow intestinal digestion of lipids, maintaining lipid soluble nutrient availability.3 In addition, dietary compounds increasing the total energy demand via thermogenesis or compounds promoting the utilization of lipids as primary substrates for cellular energy formation may help prevent body weight gain in a sedentary lifestyle.3In this context, red pepper and its major pungent compound, capsaicin, are often considered as anti-obesity agents, since administering them to animals and humans has been associated with a decreased food intake, an increased energy metabolism, and with hypolipidemic effects.4,5 Although red pepper and capsaicin have been shown to be effective in reducing body fat, yet when used clinically,6 a strong compliance to a specific dosage is required, which has not been shown to be feasible yet due to their intense pungency. In a recent pre-clinical trial, we could demonstrate that nonivamide, a capsaicinoid with about half the pungency as that of capsaicin, reduced the ad libitum food and energy intake from a standardized breakfast in healthy overweight male subjects.7 However, the mechanisms of action for the hypolipidemic effects have not yet been elucidated for capsaicinoids. The present study aimed to investigate whether capsaicin and the less pungent structural analog nonivamide, the aliphatic relative trans-pellitorine and vanillin as the parent structural motif of vanilloids affect the intestinal fatty acid uptake to help combat hyperlipidemia and body weight gain.
The pungent sensation of capsaicin is caused by the depolarization of mechano-heat sensitive afferent trigeminal or dorsal neurons by lowering the temperature threshold through binding to the transient receptor potential cation channel subfamily V member 1 (TRPV1), also known as the capsaicin receptor or the vanilloid receptor 1 (2, Fig. 1). As a consequence, the calcium ion influx via TRPV1 is increased at body temperature, causing a pain signal. Nonivamide is another TRPV1-agonist that differs from capsaicin in one double bond and one methyl group in the carbon chain only (Fig. 1), and may exhibit similar effects on lipid metabolism as capsaicin. The aliphatic alkamide trans-pellitorine is structurally related to capsaicin as well, but is lacking the vanillyl group (Fig. 1). Because of its tingling effect on the tongue, trans-pellitorine is also discussed as an agonist of TRPV1 and TRPA1.8,9 The widely-used aroma compound vanillin is, like capsaicin and nonivamide, a vanilloid, but is not an amide and lacking the alkyl chain (Fig. 1). Since it is not clear whether the vanillyl-amide part of capsaicin is a necessary structural component for its effect on intestinal fatty acid uptake, vanillin was also included as a target compound in this study.
 | ||
| Fig. 1 Chemical structures of capsaicin (1), nonivamide (2), t-pellitorine (3), and vanillin (4). | ||
Mechanistically, activation of TRPV1 leads to an increased Ca2+-influx into the cell. An increased intracellular Ca2+ concentration has been shown to affect membrane permeability in human intestinal Caco-2 cells in culture.10 Caco-2 cells are widely used for studying lipid metabolism as they exhibit many characteristics of mature villus epithelial cells of the small intestine upon differentiation, including the formation of a brush border membrane and intracellular tight junctions, and the expression of fatty acid binding proteins.11,12
Since capsaicin and nonivamide have not only been demonstrated to act as TRPV1 ligands but also to increase Ca2+ mobilization in neural SH-SY5Y cells,13 we hypothesize that the selected compounds affect fatty acid uptake in differentiated Caco-2 cells via paracellular diffusion induced by TRPV1 activation.
To test whether a compound-induced effect on cellular fatty acid uptake was associated with functional changes of the cell membrane and related proteins, activation of the TRPV1 receptor or the epithelial Na+ channel (ENaC), specific inhibitors were used. In addition, we further studied parameters of membrane function including barrier function via trans-epithelial electrical resistance (TEER) and changes in the activity of glucose transporters via glucose uptake, as well as gene expression of fatty acid transport- and binding-proteins after incubation with the target compounds in the presence and absence of fatty acid uptake inhibitors. Target compounds for which the results revealed a decrease of fatty acid uptake in differentiated Caco-2 cells were studied for their effects on the enzymatic activity of acetyl-coenzyme A synthetase as an indicator of intracellular fatty acid biosynthesis.
Results
Cell viability
Cell viability was assessed using the MTT assay after treatment of differentiated Caco-2 cells with the test compounds capsaicin, nonivamide, trans-pellitorine, and vanillin in a concentration range of 0.1–100 μM, as well as the inhibitors capsazepine (1–100 μM), BCH (25–100 μM) and benzamil (1–100 μM) or a combination thereof. No significant difference (p > 0.05) between treatment for 90 min with the test compounds/inhibitors and the non-treated control was detected (one-way ANOVA vs. control, Holm–Sidak post-hoc test; data not shown).BODIPY-C12-uptake after capsaicin, nonivamide, trans-pellitorine and vanillin treatment
The effects of capsaicin, nonivamide, trans-pellitorine and vanillin on BODIPY-C12-uptake are displayed in Fig. 2. Since stock solutions of the four test compounds were prepared in ethanol, cells treated with the respective ethanol concentrations were also studied. As a result, there was no difference between treatment with buffer (HBSS–HEPES) solely and treatment with buffer supplemented with 0.1% ethanol (p = 0.552, Student's t-test). Treatment with capsaicin reduced fatty acid uptake to 93.5 ± 2.68% (p < 0.05 vs. control) at 0.1 μM and to 63.5 ± 1.77%, 51.9 ± 2.06% and 48.0 ± 1.35% (each p < 0.001 vs. control) at 1 μM, 10 μM and 100 μM, respectively. Addition of 0.1 μM of nonivamide had no effect on fatty acid uptake, whereas addition of 1 to 100 μM of nonivamide reduced fatty acid uptake in a dose-dependent manner as well (75.6 ± 3.59 at 1 μM to 54.9 ± 1.32% at 100 μM), although to a weaker extent than capsaicin (p < 0.05 vs. capsaicin). In contrast, incubation with trans-pellitorine increased fatty acid uptake by 7.77 ± 2.77% (p < 0.05 vs. control) at the lowest test concentration of 0.1 μM, but showed a decreasing effect at the highest test concentration of 100 μM by 14.0 ± 2.14% (p < 0.001 vs. control). This decrease was significantly weaker compared to the decrease after incubation with 100 μM nonivamide (p < 0.001) or capsaicin (p < 0.001). Incubation with 0.1 to 100 μM of vanillin did not change fatty acid uptake (p = 0.075) and was therefore not further investigated. For further mechanistic studies, a test concentration of 10 μM instead of the highest and most effective concentration of 100 μM was chosen for capsaicin, nonivamide and trans-pellitorine since the test concentration of 10 μM is closer to physiological conditions after the dietary intake of 5 g of C. frutescens.14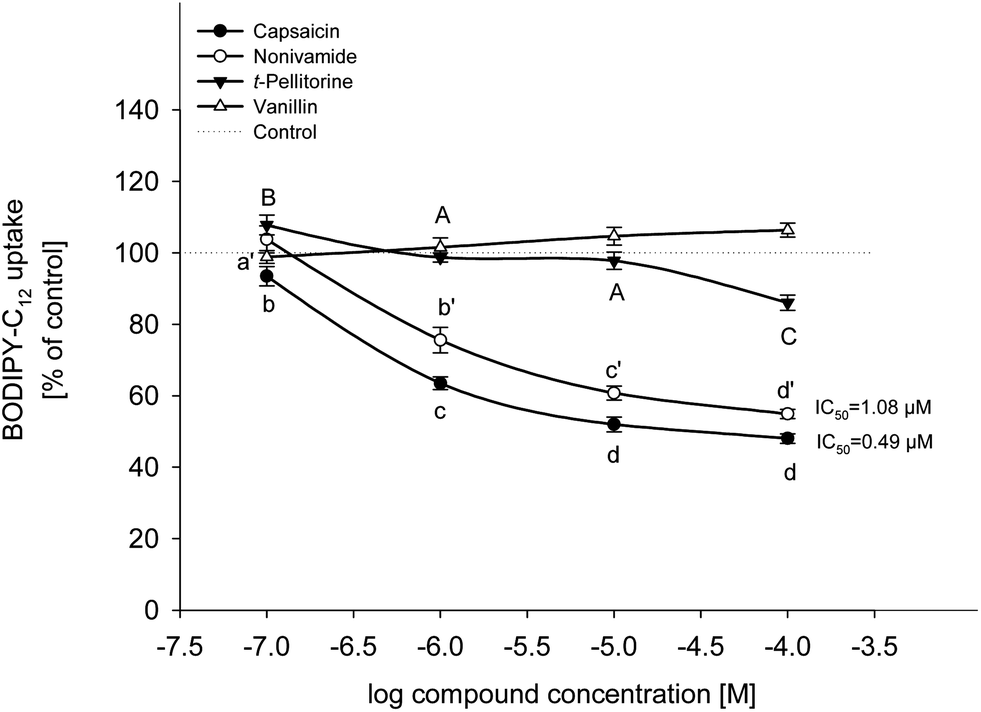 | ||
| Fig. 2 BODIPY-C12 uptake by differentiated Caco-2 cells after 30 min of pre-treatment with 0.1–100 μM capsaicin, nonivamide and trans-pellitorine compared to non-treated control cells (= 100%, dotted line). IC50 values for capsaicin and nonivamide were calculated using one site competition (max = 100) curve fitting in SigmaPlot 11.0. Values are presented as means ± SEM for three to four experiments assayed in triplicates. Significant differences between test concentrations within were tested using a one-way ANOVA with a Holm–Sidak post-hoc test and are marked with distinct letters (control = a). | ||
TRPV1-dependence of fatty acid uptake in Caco-2 cells
Capsaicin and nonivamide are known agonists for the TRPV1 cation channel. Activation of TRPV1 leads to an increased intracellular Ca2+ concentration, which may affect membrane permeability10 and thus paracellular fatty acid transport. To investigate whether the reduction in fatty acid uptake induced by capsaicin, nonivamide and trans-pellitorine depends on TRPV1 activation, the effect of two different well-established TRPV1 antagonists, capsazepine13,15,16 and BCH13,17 with/without the presence of the test compounds, on BODIPY-C12-uptake was assessed (Fig. 3).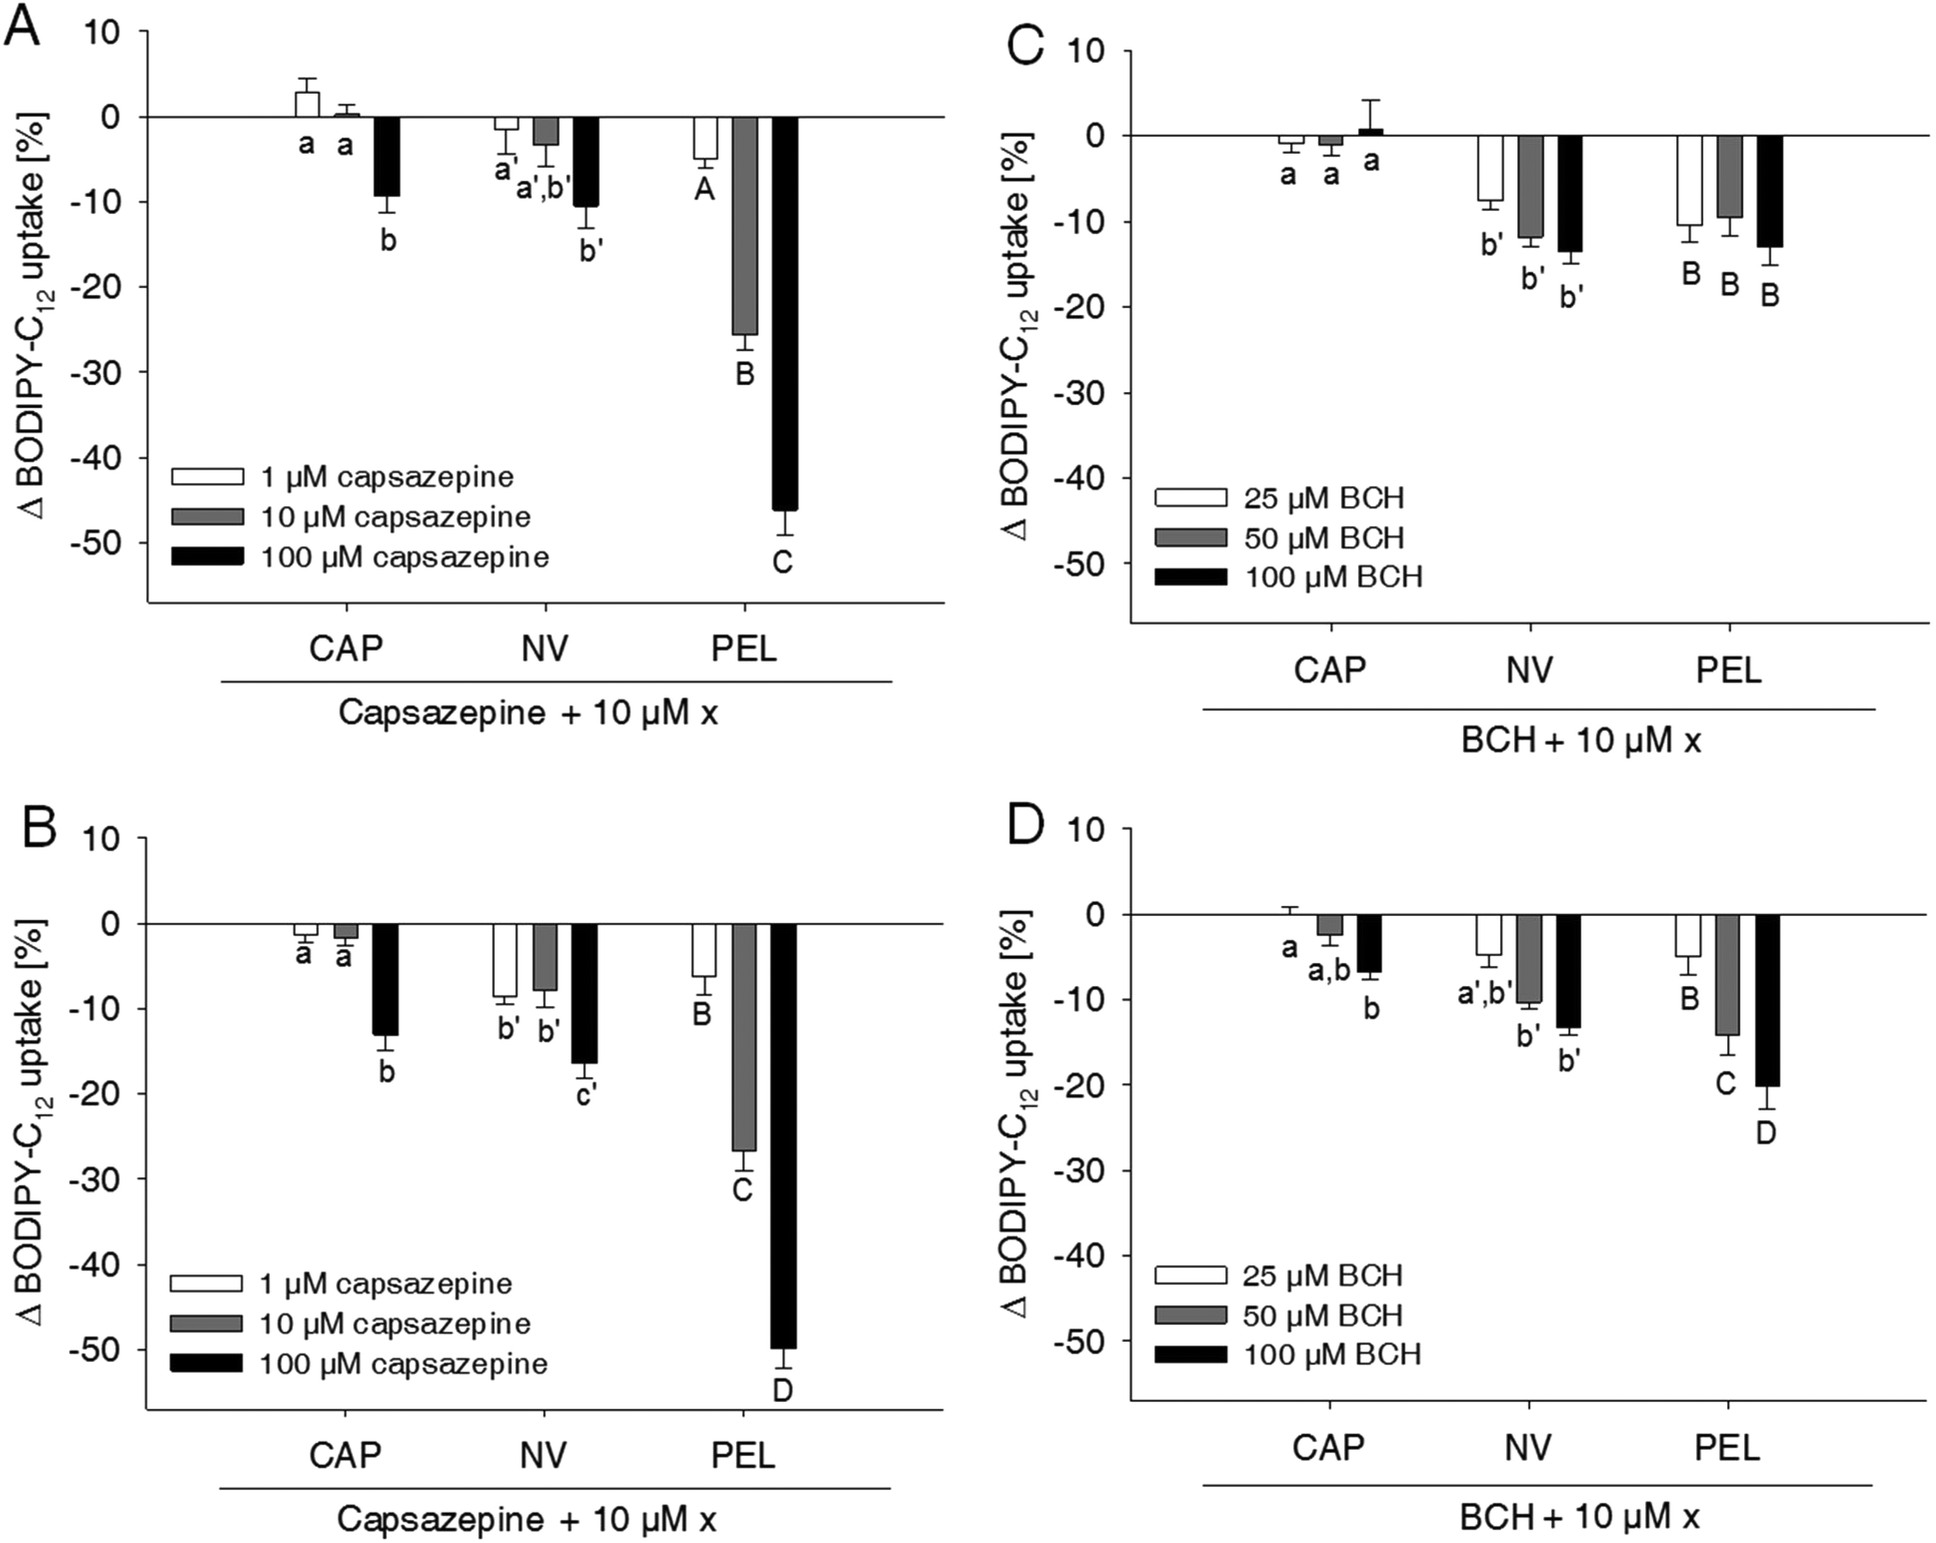 | ||
| Fig. 3 ΔBODIPY-C12 uptake by differentiated Caco-2 cells after treatment with the TRPV1 inhibitors capsazepine (CZE) (A, B) or trans-tert-butylcyclohexanol (BCH) (C, D). Inhibitors were added concomitantly with (A, C) or 30 min prior to (B, D) the addition of 10 μM capsaicin (CAP), nonivamide (NV) and trans-pellitorine (PEL). Data are presented as Δ means compared to cells treated with CAP, NV or PEL solely ± SEM from three different experiments with three technical replicates each. Significant differences between the treatments with CAP/NV/PEL and different concentrations of the inhibitors were tested using a two-way ANOVA with a Holm–Sidak post-hoc test and are marked with distinct letters (control = a). | ||
Treatment of the cells with the TRPV1 antagonist capsazepine reduced free fatty acid uptake in a dose dependent manner to 92.5 ± 2.42% (p < 0.05 vs. control = 100%) at 1 μM down to 49.1 ± 2.59% (p < 0.001 vs. control) at a concentration of 100 μM (data not shown in figures).
Concomitant addition of 1 μM capsazepine to the incubation medium containing 10 μM of capsaicin, nonivamide or trans-pellitorine did not alter fatty acid uptake in comparison to a treatment with capsaicin, nonivamide or trans-pellitorine alone (Fig. 3A). Also, co-incubation with 10 μM capsazepine did not significantly affect the reduction of fatty acid uptake induced by capsaicin and nonivamide, but reduced fatty acid uptake in combination with trans-pellitorine by 25.7 ± 1.68% (p < 0.001) in comparison to treatment with trans-pellitorine alone. Co-incubation with the highest test concentration of 100 μM capsazepine and capsaicin, nonivamide and trans-pellitorine further decreased fatty acid uptake by 9.39 ± 1.91% (capsaicin, p < 0.01), 10.5 ± 2.63% (nonivamide, p < 0.001) and 47.2 ± 2.99% (trans-pellitorine, p < 0.001), respectively. In further experiments, capsazepine was added to the incubation medium 30 min before the addition of any of the other test substances (Fig. 3B). Pre-incubation with capsazepine alone for 30 min did not alter fatty acid uptake at 1 μM, but reduced fatty acid uptake by 26.5 ± 1.01% (p < 0.001) at 10 μM and by 44.4 ± 2.47% (p < 0.001) at 100 μM (data not shown in the figure). The effect of 10 μM capsaicin (−48.0 ± 2.06%) was not reduced by pre-treatment with 1 and 10 μM, but with 100 μM of capsazepine (−61.1 ± 1.96%, p < 0.001 vs. capsaicin). However, the effects of nonivamide and trans-pellitorine were significantly amplified by pre-treatment with capsazepine at all test concentrations (1–100 μM) (Fig. 3B). The selective TRPV1 antagonist BCH was applied at 25, 50 and 100 μM, with no effect on fatty acid uptake at concentrations of 25 μM and 50 μM (data not shown in the figure). Application of 100 μM BCH reduced the fatty acid uptake by 13.7 ± 2.19% (p < 0.001 vs. control, data not shown). However, co-incubation of 25–100 μM BCH with capsaicin did not affect fatty acid uptake compared to treatment with capsaicin alone, but led to a reduced fatty acid uptake when co-incubated with nonivamide by up to 13.6 ± 1.37% at 100 μM and trans-pellitorine by up to 13.0 ± 2.18% compared to a treatment with nonivamide and trans-pellitorine alone (Fig. 3C). Pre-incubation with BCH for 30 min led to a decrease of fatty acid uptake not only at 100 μM (−14.9 ± 1.67%, p < 0.001), but also at the lower test concentrations of 50 μM (−12.4 ± 1.14%, p < 0.001) and 25 μM (−7.78 ± 1.47%, p < 0.01, data not shown). Addition of 25–100 μM BCH 30 min prior to the application of 10 μM capsaicin led to a further reduction of fatty acid uptake at 100 μM (−6.74 ± 0.81%), but not at 25 and 50 μM, compared to the application of capsaicin solely (Fig. 3D). The effect of nonivamide on fatty acid uptake was increased by pre-treatment with 50 μM (−11.5 ± 1.04%, p < 0.001) and 100 μM (−13.6 ± 1.37%, p < 0.001) BCH, and the effect of trans-pellitorine by up to −13.0 ± 2.18% (100 μM BCH, p < 0.001) at all test concentrations.
Glucose uptake after capsaicin, nonivamide, and trans-pellitorine treatment
The fatty acid uptake inhibition caused by capsaicin, nonivamide and trans-pellitorine does not depend on TRPV1 activation. However, a reduction in fatty acid uptake may still be caused by changes in membrane permeability. In order to investigate whether the reduced fatty acid uptake is accompanied by an altered glucose uptake, 2-NBDG uptake after 30 min pre-treatment with capsaicin, nonivamide and trans-pellitorine was measured (Fig. 4) as an additional parameter for membrane integrity. Insulin independent 2-NBDG uptake in Caco-2 cells was not affected by treatment with 0.1–100 μM of capsaicin (p = 0.503) or nonivamide (p = 0.277). Incubation with trans-pellitorine reduced glucose uptake by 14.4 ± 3.77% (p = 0.004) at a concentration of 0.1 μM, but did not affect glucose uptake in higher concentrations (p > 0.05).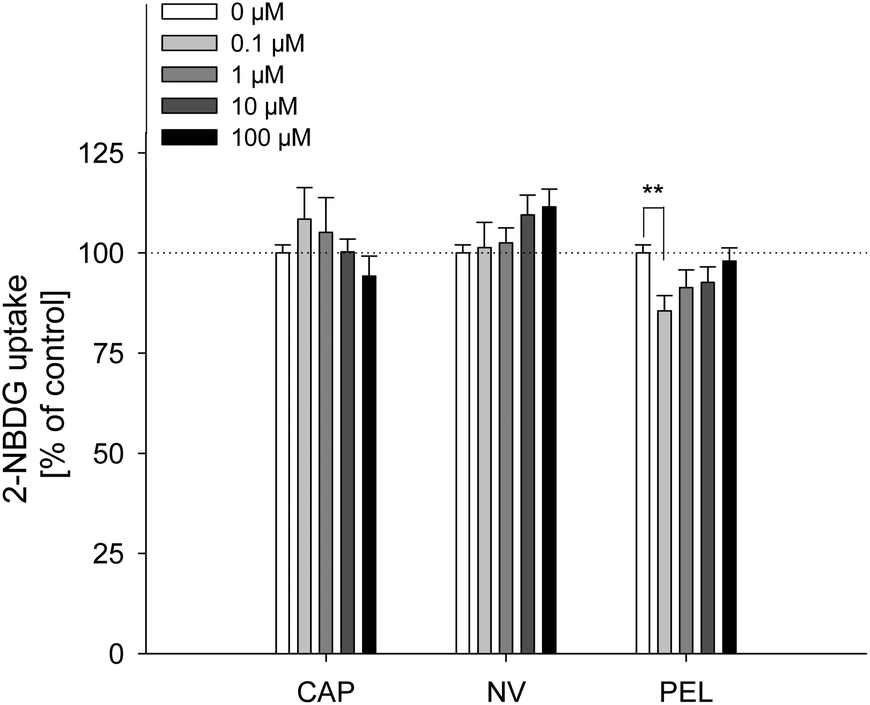 | ||
| Fig. 4 2-NBDG uptake by differentiated Caco-2 cells after 30 min of pretreatment with 0.1–100 μM capsaicin, nonivamide and trans-pellitorine compared to non-treated control cells (= 100%). Values are presented as means ± SEM for three to four experiments assayed in triplicates. Significant differences between test concentrations were tested using a one-way ANOVA with a Holm–Sidak post-hoc test. **p < 0.01 vs. control. | ||
Trans-epithelial electrical resistance (TEER)
Glucose uptake was not affected by capsaicin and nonivamide treatment and only reduced at the lowest test concentration after treatment with trans-pellitorine. Changes in membrane permeability might affect larger molecules like fatty acids, without affecting the transport kinetics of small molecules like glucose. In order to exclude a reduction of fatty acid uptake by modified membrane integrity and thus paracellular transport, the TEER was determined after 0, 15, 30, 60 and 90 min of incubation with 10 μM capsaicin, nonivamide and trans-pellitorine (Fig. 5). Untreated, differentiated Caco-2 cells demonstrated a mean TEER of 514 ± 12.9 Ω × cm2 (n = 23) after 60 min of starving. ΔTEER of control cells (treated with HBSS–HEPES buffer) remained stable after 15 min, but was decreased after 30, 60 and 90 min of incubation by 40.1 ± 7.89, 63.1 ± 4.35 and 72.4 ± 8.12 Ω × cm2 (p < 0.001 for all time points) in comparison to the initial TEER value (t = 0). Addition of 0.1% ethanol to the incubation medium did not change ΔTEER at any time point in comparison to treatment with HBSS–HEPES solely. Also, incubation medium supplemented with 10 μM capsaicin or nonivamide did not change ΔTEER in the time course experiment in comparison to control cells. However, after 90 min, ΔTEER was significantly higher (p < 0.01) after treatment with 10 μM trans-pellitorine (−40.5 ± 12.8 Ω × cm2) in comparison to untreated control cells (−72.4 ± 8.12 Ω × cm2), treatment with 0.1% ethanol (−73.3 ± 11.9 Ω × cm2) or 10 μM nonivamide (−85.5 ± 5.09 Ω × cm2), but was not significantly higher compared to capsaicin (−62.2 ± 6.60 Ω × cm2, Fig. 5).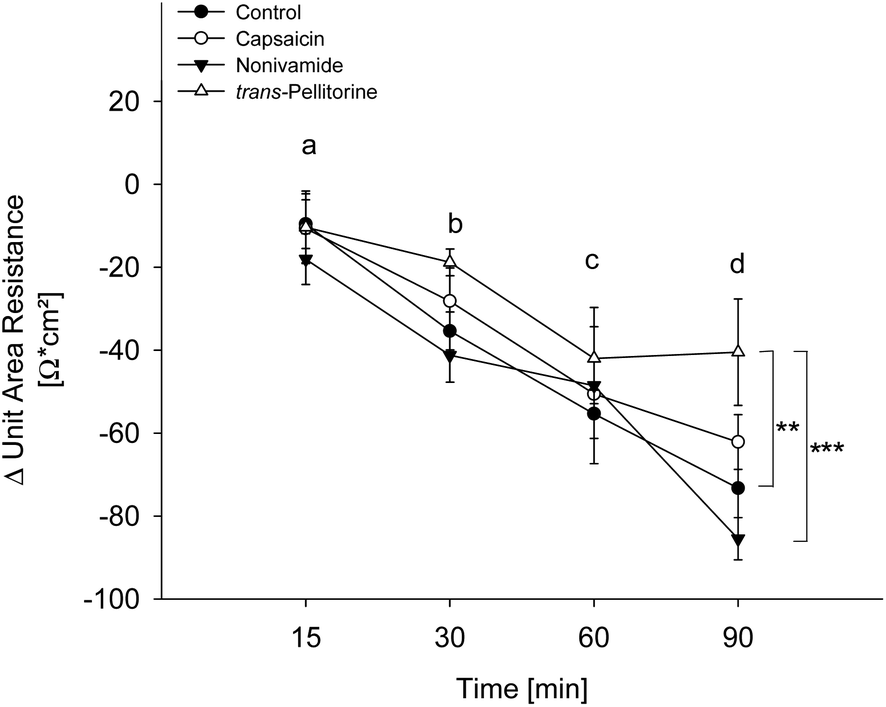 | ||
| Fig. 5 Evaluation of the trans-epithelial electrical resistance (TEER) of differentiated Caco-2 cells after treatment with 10 μM capsaicin, nonivamide or trans-pellitorine for 15, 30, 60 and 90 min or non-treated control cells. Values are presented as means ± SEM for three to four experiments assayed in duplicates. Significant differences were analyzed with a two-way ANOVA followed by a Holm–Sidak post hoc test. Time-dependent effects are marked with distinct letters and differences between treatments using the following code: **p < 0.01, ***p < 0.001. | ||
Effect of epithelial Na+-channel (ENaC) inhibition on fatty acid uptake reduction by capsaicin, nonivamide, trans-pellitorine, capsazepine and BCH
Sodium homeostasis of the cells is mediated by different sodium-selective channels and transporters, like the ENaC or SLC5A8, whose sodium transport is coupled to short chain fatty acids.18 Activation of ENaC leads to an increased sodium resorption,19 which may reduce the activity of sodium transporters like SLC5A8, thereby affecting fatty acid uptake.Since long chain fatty acids like arachidonic acid,20 and also capsazepine,21 influence the ENaC activity, the effect of the specific ENaC inhibitor benzamil, a potent analog of amiloride,22 on the fatty acid uptake reduction caused by capsaicin, nonivamide, trans-pellitorine, capsazepine and trans-tert-butylcyclohexanol was examined. Treatment with 10 μM benzamil alone, which was added 30 min prior to the addition of other test substances, did not alter the fatty acid uptake in Caco-2 cells (Fig. 6). Treatment with 10 μM benzamil had no impact on the reduced fatty acid uptake evoked by capsazepine, BCH, capsaicin or trans-pellitorine treatment. However, pre-treatment with benzamil followed by incubation with nonivamide reduced the fatty acid uptake by 10.4 ± 1.82% (p < 0.01, Student's t-test), compared to an incubation with nonivamide solely.
 | ||
| Fig. 6 ΔBODIPY-C12 uptake by differentiated Caco-2 cells after treatment with 10 μM of the endothelial sodium channel (ENaC) inhibitor benzamil. Benzamil was added 30 min prior to the addition of 10 μM capsaicin (CAP), nonivamide (NV) and trans-pellitorine (PEL), capsazepine (CZE) and 100 μM trans-tert-butylcyclohexanol (BCH). Data are presented as the relative means compared to capsaicin, nonivamide or trans-pellitorine treatment ± SEM from three different experiments with three technical replicates each. Significant differences (#p < 0.05) between treatment solely with the test compounds (CAP/NV/PEL/CZE/BCH) and addition of benzamil to the test compound were tested with a Student's t-test. | ||
Gene expression analysis of modulators of fatty acid uptake in Caco-2 cells
Passive transport mechanisms were affected after treatment with trans-pellitorine solely, which might at least partly explain the reduction in fatty acid uptake. However, paracellular transport mechanisms were not affected by nonivamide and capsaicin-treatment, pointing to a direct action on active fatty acid transport mechanisms. To address whether fatty acid uptake modulation by capsaicin, nonivamide or trans-pellitorine is accompanied by changes in gene expression of fatty acid transport proteins and other factors involved in fatty acid metabolism, time-dependent gene expression of genes encoding for fatty acid transport proteins 2 and 4 (FATP2 & FATP4), intestinal fatty acid binding protein (IFABP), fatty acid translocase (CD36), and peroxisome proliferator-activated receptor γ and α (PPARγ and PPARα) were determined after treatment with 10 μM capsaicin, nonivamide or trans-pellitorine for 15, 30, 60 and 90 min (Table 1).| Gene | Time (min) | Control | Capsaicin | Nonivamide | trans-Pellitorine |
|---|---|---|---|---|---|
| a Relative gene expression after treatment with 10 μM capsaicin, nonivamide or trans-pellitorine compared to non-treated control cells. Gene expression was normalized to HPRT expression levels. Data are shown as mean fold change ± SEM from 3–4 experiments assayed in triplicates. Significant differences between treatments are tested with two-way ANOVA and pairwise multiple comparison between treatments using the Holm–Sidak post hoc test (*p < 0.05, **p < 0.01, ***p < 0.001 vs. non-treated cells). | |||||
| FATP2 | 15 | 1.00 ± 0.02 | 0.99 ± 0.08 | 0.86 ± 0.11 | 1.09 ± 0.05 |
| 30 | 1.00 ± 0.02 | 1.08 ± 0.03 | 1.04 ± 0.06 | 0.98 ± 0.08 | |
| 60 | 1.00 ± 0.02 | 1.47 ± 0.11*** | 1.51 ± 0.14*** | 1.33 ± 0.06** | |
| 90 | 1.00 ± 0.02 | 1.03 ± 0.10 | 1.15 ± 0.10 | 1.09 ± 0.12 | |
| FATP4 | 15 | 1.00 ± 0.01 | 0.91 ± 0.04 | 1.17 ± 0.06 | 0.98 ± 0.07 |
| 30 | 1.00 ± 0.01 | 1.05 ± 0.04 | 0.99 ± 0.03 | 0.92 ± 0.01 | |
| 60 | 1.00 ± 0.02 | 1.29 ± 0.09** | 1.32 ± 0.08** | 1.22 ± 0.10 | |
| 90 | 1.00 ± 0.01 | 1.01 ± 0.09 | 1.10 ± 0.11 | 1.15 ± 0.13 | |
| IFABP | 15 | 1.00 ± 0.01 | 1.18 ± 0.11 | 0.94 ± 0.03 | 1.12 ± 0.05 |
| 30 | 1.00 ± 0.03 | 1.37 ± 0.04*** | 1.12 ± 0.09 | 1.06 ± 0.07 | |
| 60 | 1.00 ± 0.03 | 1.19 ± 0.13 | 1.32 ± 0.08** | 1.08 ± 0.04 | |
| 90 | 1.00 ± 0.03 | 1.03 ± 0.11 | 1.08 ± 0.08 | 0.90 ± 0.05 | |
| CD36 | 15 | 1.00 ± 0.03 | 1.17 ± 0.12 | 1.38 ± 0.13 | 1.31 ± 0.11 |
| 30 | 1.00 ± 0.02 | 1.46 ± 0.25 | 1.82 ± 0.23** | 1.17 ± 0.09 | |
| 60 | 1.00 ± 0.02 | 1.89 ± 0.14*** | 3.97 ± 0.59*** | 1.71 ± 0.16*** | |
| 90 | 1.00 ± 0.02 | 1.26 ± 0.16 | 1.72 ± 0.04 | 1.51 ± 0.05 | |
| PPARα | 15 | 1.00 ± 0.03 | 0.80 ± 0.03 | 1.04 ± 0.07 | 0.95 ± 0.05 |
| 30 | 1.00 ± 0.01 | 1.07 ± 0.07 | 1.02 ± 0.05 | 0.96 ± 0.02 | |
| 60 | 1.00 ± 0.03 | 1.29 ± 0.08*** | 1.28 ± 0.08*** | 1.31 ± 0.05*** | |
| 90 | 1.00 ± 0.02 | 1.04 ± 0.07 | 0.94 ± 0.04 | 1.15 ± 0.10 | |
| PPARγ | 15 | 1.00 ± 0.03 | 1.00 ± 0.11 | 1.04 ± 0.07 | 0.95 ± 0.05 |
| 30 | 1.00 ± 0.02 | 1.16 ± 0.08 | 1.05 ± 0.04 | 1.01 ± 0.04 | |
| 60 | 1.00 ± 0.02 | 1.29 ± 0.07*** | 1.50 ± 0.05*** | 1.40 ± 0.03*** | |
| 90 | 1.00 ± 0.03 | 0.99 ± 0.08 | 1.00 ± 0.08 | 1.15 ± 0.10 | |
FATP2 gene expression significantly peaked after 60 min of treatment with capsaicin (1.47 ± 0.11, p < 0.001), nonivamide (1.51 ± 0.14, p < 0.001) or trans-pellitorine (1.33 ± 0.06, p = 0.004) in comparison to control cells (1.00 ± 0.02). However, there was no difference between the three different treatments. Likewise, FATP4 expression peaked after 60 min of treatment with capsaicin (1.29 ± 0.09, p = 0.003) or nonivamide (1.32 ± 0.08, p = 0.001), but not after trans-pellitorine treatment. Furthermore, treatment with capsaicin increased IFABP expression after 30 min by 1.37 ± 0.04 (p < 0.001), whereas treatment with nonivamide led to increased gene expression after 60 min (1.32 ± 0.08, p < 0.01). Furthermore, treatment with nonivamide for 30 min and 60 min promoted CD36 gene expression in comparison to control cells to 1.82 ± 0.23 (p < 0.01) or 3.97 ± 0.59 (p < 0.001), respectively. This effect was more pronounced (p < 0.001) compared to the effect of capsaicin (1.89 ± 0.14, p < 0.01 vs. control) and trans-pellitorine-treatment (1.71 ± 0.16, p < 0.05 vs. control), which demonstrated increased CD36 gene expression after 60 min in comparison to control cells as well. PPARα and PPARγ gene expressions were most pronounced after 60 min incubation time with capsaicin, nonivamide and trans-pellitorine compared to control cells (each p < 0.001) as well. Treatment with capsaicin increased the PPARα expression to 1.29 ± 0.08 and PPARγ by 1.29 ± 0.07, whereas nonivamide promoted PPARα expression to 1.28 ± 0.08 and PPARγ to 1.50 ± 0.05. trans-Pellitorine led to an increase of PPARα gene expression up to 1.31 ± 0.05 and PPARγ gene expression up to 1.40 ± 0.03 (Table 1).
The time course experiment showed the most pronounced effects on gene expression of modulators of fatty acid uptake after 60 min. Therefore, further gene expression experiments were carried out after 60 min of incubation, exactly mimicking the incubation conditions used during the fatty acid uptake experiments. Cells were incubated after 60 min of starving, using a mixture of serum-free DMEM and test substance dissolved in HBSS–HEPES (9![[thin space (1/6-em)]](https://www.rsc.org/images/entities/char_2009.gif) :1) with or without addition of 5 μM lauric acid to investigate the effects of substrate addition on gene expression of modulators of fatty acid uptake (Table 2).
:1) with or without addition of 5 μM lauric acid to investigate the effects of substrate addition on gene expression of modulators of fatty acid uptake (Table 2).
| FATP2 | FATP4 | IFABP | CD36 | PPARα | PPARγ | |||||||
|---|---|---|---|---|---|---|---|---|---|---|---|---|
| wo LA | with LA | wo LA | with LA | wo LA | with LA | wo LA | with LA | wo LA | with LA | wo LA | with LA | |
| a Relative gene expression after treatment compared to non-treated control cells after 1 h of starving followed by 1 h of incubation with 10 μM capsaicin, nonivamide or trans-pellitorine with or without addition of 5 μM lauric acid (LA) to the incubation medium. Gene expression was normalized to HPRT expression levels and is displayed as fold change of non-treated control cells ± SEM from 3–4 experiments assayed in triplicates. Significant differences between treatments are tested with two-way ANOVA and pairwise multiple comparison between treatments using the Holm–Sidak post hoc test (*p < 0.05 vs. treatment without lauric acid (LA)). | ||||||||||||
| Control | 1.00 ± 0.03 | 1.15 ± 0.07 | 1.00 ± 0.01 | 1.18 ± 0.06* | 1.00 ± 0.03 | 1.17 ± 0.02 | 1.00 ± 0.04 | 1.21 ± 0.12 | 1.00 ± 0.02 | 1.17 ± 0.03 | 1.00 ± 0.02 | 1.06 ± 0.06 |
| Capsaicin | 1.12 ± 0.05 | 0.89 ± 0.03 | 1.19 ± 0.04 | 1.05 ± 0.07 | 1.31 ± 0.02 | 1.42 ± 0.02 | 1.68 ± 0.18 | 1.21 ± 0.06* | 1.19 ± 0.04 | 0.96 ± 0.02* | 1.04 ± 0.03 | 0.94 ± 0.05 |
| Nonivamide | 1.29 ± 0.16 | 1.20 ± 0.18 | 1.10 ± 0.05 | 1.26 ± 0.08 | 1.30 ± 0.07 | 1.50 ± 0.16 | 1.67 ± 0.20 | 2.06 ± 0.29 | 1.22 ± 0.06 | 1.32 ± 0.10 | 0.94 ± 0.05 | 1.01 ± 0.03 |
| t-Pellitorine | 1.56 ± 0.15 | 1.60 ± 0.18 | 1.24 ± 0.06 | 1.30 ± 0.10 | 1.38 ± 0.06 | 1.59 ± 0.18 | 1.63 ± 0.07 | 1.99 ± 0.17 | 1.24 ± 0.07 | 1.33 ± 0.14 | 1.00 ± 0.05 | 1.01 ± 0.08 |
Comparison of the control, capsaicin, nonivamide and trans–pellitorine treatments with or without 5 μM lauric acid demonstrated no impact of substrate addition on FATP2, PPARγ, and IFABP gene expression. However, the addition of lauric acid to capsaicin-containing incubation medium significantly decreased PPARα expression from 1.19 ± 0.04 to 0.96 ± 0.02 (p < 0.05) and CD36 gene expression from 1.68 ± 0.18 to 1.21 ± 0.06 (p < 0.05). Furthermore, the FATP4 gene expression of control cells was slightly up-regulated by 0.18 ± 0.06 (p < 0.05) on adding lauric acid to the buffer control (Table 2).
Changes in acetyl-coenzyme A synthetase activity after capsaicin, nonivamide and trans-pellitorine incubation
As demonstrated above, incubation with capsaicin, nonivamide and trans-pellitorine in the μM range decreased the fatty acid uptake without compensating for this lack of energy by altering the glucose uptake. In order to investigate whether Caco-2 cells compensate for a possible intracellular lack of fatty acids by an increased fatty acid de novo synthesis, acetyl-coenzyme A synthetase activity was assessed using an enzymatic assay. This enzyme catalyses the activation of acetate by conversion into acetyl-coenzyme A, which is used for de novo fatty acid synthesis.23 Acetyl-CoA synthetase activity in differentiated Caco-2 cells in comparison to non-treated control cells was significantly increased after 90 min of incubation with 10 μM of capsaicin (+3.00 ± 1.10 mU per mg of protein, p < 0.05), nonivamide (+3.96 ± 0.72, p < 0.05) and trans-pellitorine (+3.90 ± 0.70, p < 0.05) to the same extent (Fig. 7).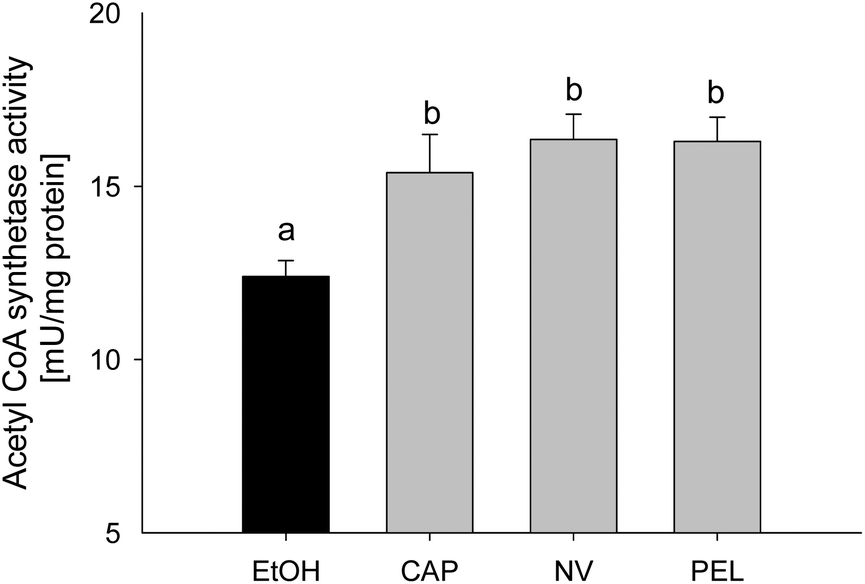 | ||
| Fig. 7 Acetyl-coenzyme A synthetase activity of differentiated Caco-2 cells after 90 min of treatment with 10 μM of capsaicin, nonivamide or trans-pellitorine. Values are presented as mean ± SEM from three different measurements with multiple technical replicates. Significant differences between the treatments were tested using a one-way ANOVA with a Student–Newman–Keuls post hoc test and are marked with distinct letters. | ||
Discussion
Red pepper and its major pungent compound capsaicin have been associated with hypocholesterolemic and hypotriglyceridemic effects in rats5,24–26 and humans.27 Although a decreased cholesterol absorption combined with an increased expression of hepatic LDL receptors and enhanced fecal excretion of bile acids has been reported to account for hypocholesterolemic effects of capsaicin,28 the effect of capsaicin on intestinal fatty acid uptake has not been studied so far. The present study aimed to investigate whether capsaicin, nonivamide, trans-pellitorine or vanillin affects intestinal fatty acid uptake via activation of TRPV1 in vitro. Differentiated Caco-2 cells were chosen as a cell model for epithelial cells of the small intestine.The results demonstrate that capsaicin and nonivamide reduce fatty acid uptake in differentiated Caco-2 cells. Nonivamide differs from capsaicin only in one double bond and one methyl group. This slight structural difference led to a major decrease in the potency to reduce fatty acid uptake, with IC50 values of 0.49 μM and 1.08 μM calculated for capsaicin and nonivamide, respectively. Statistical comparison confirmed that capsaicin decreased fatty acid uptake more potently than nonivamide at concentrations of 0.1 to 10 μM. Incubation with the alkamide trans-pellitorine, which bears a carbon chain with an amide group like capsaicin and nonivamide but is lacking the vanillyl group, increased fatty acid uptake in the lowest tested concentration of 0.1 μM, but reduced fatty acid uptake at 100 μM by 14% (p < 0.001). Vanillin, which was tested to exploit the function of the vanillyl group, did not alter fatty acid uptake. These data led us to the conclusion that the carbon chain or the amide group or the combination thereof – as opposed to the vanillyl-group – might play a pivotal role in the reduction of fatty acid uptake by Caco-2 cells in culture.
Molecular mechanisms underlying intestinal fatty acid absorption have not been fully understood so far. However, diffusion seems to coexist with protein-mediated mechanisms.29 Paracellular diffusion relies on membrane permeability, which is associated with tight junction permeability.30 In addition, increased intracellular Ca2+ levels have been associated with changes in membrane permeability, possibly via protein kinase C activation.31 Since activation of the TRPV1 receptor leads to an increased Ca2+-influx,32 a modulation of paracellular fatty acid uptake via a TRPV1 dependent pathway seemed likely. Capsaicin, nonivamide and trans-pellitorine have been shown to stimulate intracellular Ca2+ mobilization in SH-SY5Y cells,13,33 and a TRPV1-associated increase in intracellular Ca2+ levels following capsaicin exposure has also been reported in Caco-2 cells.34 To investigate whether TRPV1 receptor activation plays a role in the capsaicinoid-induced decrease in fatty acid uptake, the effect of two different TRPV1 antagonists, capsazepine and trans-tert-butylcyclohexanol (BCH), on BODIPY-C12 uptake was assessed. Hence, capsazepine and BCH were applied in different concentrations concomitantly or 30 min prior to treatment with capsaicin, nonivamide or trans-pellitorine. Concomitant application of capsazepine and BCH led to a further reduction of fatty acid uptake. When Caco-2 cells were pre-incubated with capsazepine and BCH for 30 min at concentrations that did not affect fatty acid uptake, the reducing effect on fatty acid uptake demonstrated for nonivamide and trans-pellitorine was amplified. These results indicate that one or more other receptors than TRPV1 mediate the reduction of fatty acid uptake induced by capsaicin, nonivamide and trans-pellitorine, while TRPV1 activation might not be mandatory. However, an increased fatty acid uptake is also facilitated by modulation of membrane permeability and paracellular diffusion. In order to investigate whether reduction of fatty acid uptake is accompanied by an altered glucose uptake, possibly through changes in the activity of glucose transporters or membrane permeability as well, 2-NBDG uptake after 30 min of pre-treatment with capsaicin, nonivamide and trans-pellitorine was assessed. However, there was no change in glucose uptake after treatment with capsaicin and nonivamide. In contrast, glucose uptake was decreased after treatment with 0.1 μM trans-pellitorine. This concentration led to an increased fatty acid uptake, a result that could argue for a compensatory mechanism rather than disruption of membrane-specific processes like changes in permeability or modulation of glucose transporters. However, a slight decrease in tight junction pore size would reduce the permeability for larger molecules like fatty acids, but not necessarily affect the transport of small molecules like glucose.10 Modulation of paracellular diffusion can, thus, not be excluded and needs further investigation. A good measure of paracellular diffusion is the trans-epithelial electrical resistance (TEER). A decrease in TEER is associated with an increased paracellular membrane permeability as a parameter for tight-junction permeability.30 Tsukura et al.35 found that treatment with 100 μM of capsaicin for 2 h caused a significant decrease in TEER without effects on cell viability. To exclude that fatty acid uptake inhibition by 0.1 to 100 μM capsaicin, nonivamide and trans-pellitorine is caused by an increase in TEER, which would point to a decrease in paracellular transport, TEER was monitored in differentiated Caco-2 cells after 15, 30, 60 and 90 min of treatment. Untreated, differentiated Caco-2 cells showed a mean TEER of 585 Ω × cm2, which is comparable to those described in other studies.36 Although the TEER decreased over time, the values measured never decreased below ∼330 Ω × cm2, a value which indicates an intact monolayer.37,38 Since there was no difference between the control and capsaicin or nonivamide treatments, effects of capsaicin and nonivamide on barrier function and paracellular fatty acid transport can be excluded. In contrast, after 90 min of treatment with trans-pellitorine, TEER was significantly increased compared to control cells, which could partly account for fatty acid uptake inhibition after trans-pellitorine treatment.
As a further measure of membrane function, a possible involvement of the epithelial sodium channel in the regulation of fatty acid uptake in Caco-2 cells was excluded. The sodium transport of some sodium transporters like SLC5A8 is coupled to short chain fatty acids.18 Caco-2 cells were previously shown to express delta, alpha, beta and gamma subunits of the epithelial sodium channel (ENaC),39 whose activation leads to an increased sodium resorption.40 Recently, Yamamura et al.21 demonstrated that capsazepine modulates ENaC activity. But also long chain fatty acids like arachidonic acid led to an altered ENaC activity,20 which could, in return, possibly affect the activity of sodium transporters like SLC5A8 and, thereby, also fatty acid uptake. Thus, the impact of a specific ENaC inhibitor, benzamil,19 to which Caco-2 cells were shown to be sensitive,41 on fatty acid uptake reduction caused by capsaicin, nonivamide and trans-pellitorine was investigated. There was no impact on fatty acid uptake reduction caused by capsazepine, BCH, capsaicin and trans-pellitorine. Co-incubation of benzamil with nonivamide further decreased fatty acid uptake compared to a treatment with nonivamide alone. Hence, the influence of the ENaC activity on fatty acid reduction by the test substances in Caco-2 cells can be excluded.
Besides diffusion, protein-mediated mechanisms account for fatty acid uptake. Intracellular fatty acid concentrations are two- or three-fold higher than external unbound fatty acid concentrations;42 therefore fatty acid uptake into cells against a concentration gradient requires effective transport systems. Members of the fatty acid receptor family include fatty acid translocase (CD36), plasma membrane associated fatty acid binding proteins (FABP), fatty acid transport proteins (FATPs) and long chain acyl-CoA synthetase (ACSl).43 In the present study, the influence of capsaicin, nonivamide and trans-pellitorine on genes encoding fatty acid transport mechanisms was examined using qPCR. In detail, gene expression of CD36, IFABP, FATP2, FATP4 and PPARα and PPARγ was determined in a time course experiment. FATP2 and FATP4, which both have ACSl activity and transport long chain fatty acids,43 were shown to be the predominant FATPs in Caco-2 cells.44 In addition, gene expression of the intestinal fatty acid binding protein (IFABP, also called gut FABP) was determined, since FABPs are thought to mediate intracellular binding and transport of fatty acids. A pivotal role in fat absorption and also in fat perception is discussed for CD36,29 whose gene expression was previously shown in Caco-2 cells.45 Additionally, gene expression of PPARα and PPARγ was assessed as representatives for modulators of fatty acid metabolism. The time course experiment revealed the most pronounced effects after 60 min of treatment with the three compounds with a tendency to up-regulation. Given that capsaicin and its analogs reduced fatty acid uptake without markedly changing the glucose uptake, the up-regulating effect of the compounds might be a counteraction of the cell towards a lack of energy. In order to exactly mimic the conditions used during fatty acid uptake experiments with BODIPY-C12 and to investigate the effect of substrate addition, further gene expression experiments were carried out, with or without the addition of 5 μM lauric acid. No effect was demonstrated for lauric acid addition on FATP2, PPARγ and IFABP gene expression and only partial effects were found on the expression of other genes. Overall, the treatment with capsaicin, nonivamide and trans-pellitorine resulted in a slight up-regulation of CD36, IFABP, FATP2, FATP4 and PPARα and PPARγ gene expression, which was not markedly influenced by the substrate (lauric acid) addition, pointing to a counteraction towards fatty acid uptake reduction.
The strong decrease of fatty acid uptake after incubation with capsaicin and the related compounds presumably led to a major lack of fatty acids, which is, in the experiments shown here, energetically not compensated by an increase in glucose uptake. However, after 90 min of incubation with capsaicin, nonivamide and trans-pellitorine, the enzymatic activity of the acetyl-CoA synthetase was increased compared to non-treated control cells. Acetyl-CoA synthetase catalyzes the conversion of acetate into acetyl-CoA, which is used, amongst others, for the de novo fatty acid synthesis.23 It is therefore likely that Caco-2 cells compensate for the reduced fatty acid uptake by an increase in endogenous fatty acid biosynthesis.
To summarize, the present study demonstrates that capsaicin, nonivamide and trans-pellitorine reduce fatty acid uptake in differentiated Caco-2 cells, with the capsaicinoids being the most potent compounds. In contrast to our hypothesis, there is no change in membrane integrity caused by TRPV1 activation or disruption of other membrane specific processes, like glucose uptake and tight junction permeability caused by nonivamide and capsaicin. In addition, the reduction in fatty acid uptake was not related to ENaC activation, excluding also sodium-coupled transport mechanisms as the major target of capsaicin, nonivamide and trans-pellitorine. Therefore, it can be hypothesized that capsaicin, nonivamide and trans-pellitorine induce a decrease in the activity of one or more fatty acid transporters, which is accompanied by a counter-regulation on a genetic level and an increase in acetyl-CoA synthetase activity, pointing to an increased endogenous fatty acid biosynthesis. However, the conclusion of the study is limited to an exclusion principle. Elucidation of the underlying mechanisms and downstream signalling pathways is warranted in future studies. In addition, the effects of trans-pellitorine might be partly explained by an increased TEER compared to the control, pointing to a slight decrease in membrane permeability. Fig. 8 offers a schematic overview of the examined parameters and potential pathways.
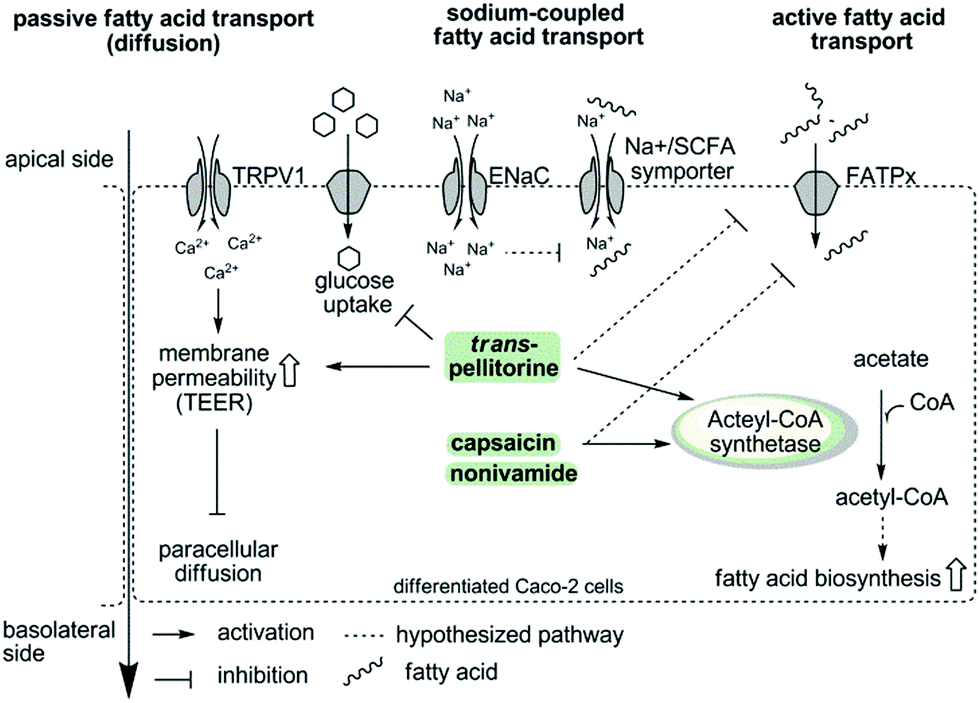 | ||
| Fig. 8 Schematic overview showing the examined parameters and potential activation and inactivation pathways of fatty acid uptake inhibition induced by capsaicin/nonivamide and trans-pellitorine in intestinal Caco-2 cells. The first hypothesis was an activation of TRPV1 by capsaicin, nonivamide and trans-pellitorine, leading to an increased intracellular Ca2+ concentration, which impacts membrane permeability via phosphokinase C activation, leading finally to a decreased paracellular diffusion. However, a TRPV1-dependence was experimentally excluded. In contrast to an incubation with capsaicin and nonivamide, incubation with trans-pellitorine led to an increased membrane permeability (on other pathways than TRPV1-activation) and a reduced glucose uptake, which may partly explain the inhibitory effect of trans-pellitorine. Fatty acid uptake inhibition caused by capsaicin, nonivamide and trans-pellitorine does not depend on activation of the endothelial sodium channel (ENaC). This was investigated to exclude that Na+-influx following ENaC activation reduces the activity of Na+/SFCA (short chain fatty acid) symporters due to an increased intracellular Na+ concentration. In summary, we hypothesize that capsaicin, nonivamide and trans-pellitorine directly act on the activity of fatty acid transporters (FATPx), which is supported by time-dependent gene regulation of FATP2 and FATP4 after incubation with the test compounds. In addition, incubation with capsaicin, nonivamide and trans-pellitorine increased the activity of the enzyme acetyl-CoA synthetase, increasing the amount of acetyl-CoA in the cell. Acetyl-CoA may be used by the cell for an increased fatty acid biosynthesis to compensate for the lack of fatty acids. An in vitro entry of nonivamide into the cell has been shown before,13 and nonivamide and the structurally similar compounds capsaicin and trans-pellitorine may thus unfold effects also intracellularly. | ||
Capsaicin is often referred to as an anti-obesity compound, not only because of its hypolipidemic effect, but also because its potential to reduce energy intake.4 However, due to its high affinity to the TRPV1 receptor resulting in a pungent sensation, oral intake of capsaicin is limited and demands less pungent alternatives. It was recently demonstrated that dietary administration of 0.15 mg of the less pungent capsaicinoid nonivamide in an oral glucose tolerance test reduced ad libitum energy intake from a standardized breakfast in slightly overweight male subjects.7 The here presented results demonstrate that nonivamide, and even the alkylamide trans-pellitorine, although less pronounced, reduce intestinal fatty acid uptake by intestinal Caco-2 cells. This mechanism might contribute to the hypolipidemic effects described for capsaicin,5,27 whereas activation of the TRPV1 receptor does not seem to be mandatory. Since the IC50 values of capsaicin and the less pungent nonivamide were in the same order of magnitude, nonivamide might be a promising capsaicinoid to be tested for its hypolipidemic effects in healthy volunteers to elucidate its clinical relevance. In addition, the present study could help explain the hypolipidemic effects of red pepper and capsaicin on a mechanistic level.
Materials & methods
Materials
trans-tert-Butylcyclohexanol (BCH), nonivamide (NV) and trans-pellitorine (PEL) were provided by Symrise AG (Germany). All other chemicals were purchased from Sigma Aldrich (Austria), unless stated otherwise. The human colon carcinoma cell line Caco-2 was obtained from ATCC.Cell culture
Caco-2 cells were maintained at 37 °C and 5% CO2 in Dulbecco's modified Eagle medium (DMEM) supplemented with 10% fetal bovine serum, 2% L-glutamine and 1% penicillin/streptomycin under a humidified atmosphere. Cells were passaged at 80–90% confluence and used until passage 20. For differentiation into an enterocyte cell model, cells were seeded in the desired format reaching confluence after two days. Medium was changed every second to third day and the differentiated cells were used for the different assays on day 21.Stock solutions (1000×) in ethanol (0.1–100 mM) of the test compounds capsaicin (CAP), nonivamide, trans-pellitorine, vanillin (VAN), capsazepine (CZE) and butylcyclohexanol (BCH) were prepared freshly each time. The final ethanol concentration on the cells during the assays never exceeded 0.2%.
Cell viability
Negative effects on cell viability of any of the test compounds capsaicin, nonivamide, trans-pellitorine, vanillin, capsazepine, BCH, and benzyl-amiloride (benzamil) were excluded using the MTT assay in a 96-well format. This assay is based on the reduction of the yellow tetrazolium salt MTT (3-(4,5-dimethylthiazol-2-yl)-2,5-diphenyltetrazolium bromide) to a purple formazan by mitochondrial and ER enzymes.46 For this purpose, cells were starved in serum free medium for one hour, followed by addition of the different test compounds or a combination of those, respectively, diluted in Hank's balanced salt solution supplemented with 20 mM HEPES (HBSS–HEPES). After 90 min of treatment, the medium was replaced by a MTT working solution, which contained a final concentration of 0.83 mg per mL of MTT diluted in PBS–serum-free medium (1:5). The reaction was stopped after 10 to 20 min by removal of the MTT working solution. The purple formazan formed during incubation was solved in 150 μL DMSO per well and the absorbance was measured at 550 nm with 690 nm as the reference wavelength using a multiwell plate reader (Tecan infinite M200, Tecan Austria). Cell viability was assessed relative to untreated control cells (100%).
Fatty acid uptake
Free fatty acid uptake in differentiated Caco-2 cells was measured in 96-well plates using the QBT™ fatty acid uptake kit (Molecular Devices Germany GmbH, Germany), according to the manufacturer's protocol. This assay measures the transport of the fluorescent fatty acid analog BODIPY-C12 into the cells, leading to an increase in fluorescence, while extracellular fluorescence is quenched. Differentiated, one-hour serum-deprived Caco-2 cells were pretreated with the test compounds diluted in HBSS–HEPES for 30 min at 37 °C. The inhibitors capsazepine, BCH and benzamil were added 30 min prior to or simultaneously with the addition of the test compounds. After the addition of the loading dye, containing BODIPY-C12 and 0.2% essentially fatty acid free BSA diluted in HBSS–HEPES, fluorescence was recorded every 20 s at 515 nm emission and 485 nm excitation for 60 min. The area under the curves (AUC) from corresponding signal/time plots for each test compound were calculated using SigmaPlot 11.0 and the data are calculated relative to control cells (100%).Glucose uptake
Glucose uptake in the absence of insulin was assessed using 2-(N-(7-nitrobenz-2-oxa-1,3-diazol-4-yl)amino)-2-deoxyglucose (2-NBDG) as described before.45 Briefly, differentiated Caco-2 cells were starved in DMEM w/o serum, glucose, L-glutamine and phenol red for one hour at 37 °C, before incubation with the test compounds diluted in HBSS–HEPES for a further 30 min. 2-NBDG was added to the cells at a final concentration of 200 μM and incubated at 37 °C for 30 min. Cells were washed three times with ice-cold PBS and fluorescence was measured at 550 nm emission and 480 nm excitation. Data are calculated relative to non-treated control cells (100%).Trans-epithelial electrical resistance (TEER)
TEER of differentiated Caco-2 cells was assessed using the EVOM resistance meter (World Precision Instruments, Germany) in combination with the EndOhm-24SNAP chamber (World Precision Instruments, Germany). Caco-2 cells were grown in Snapwell™ culture cups (Corning Costar, Austria) and, after differentiation, starved for one hour in serum-free DMEM. Capsaicin, nonivamide and trans-pellitorine dissolved in HBSS–HEPES were added to the upper compartment at a final concentration of 10 μM and the resistance was measured in duplicates after 15, 30, 60 and 90 min of incubation at 37 °C. Resistance was normalized to the initial resistance prior to test compound addition and the corresponding unit area resistance (Ω × cm2) was calculated by multiplying with the surface area of the Snapwell membrane.qPCR
Gene expressions of fatty acid transport protein 2 (FATP2) and 4 (FATP4), fatty acid translocase (CD36), intestinal fatty acid binding protein (IFABP), and peroxisome proliferated activated receptor alpha (PPARα) or gamma (PPARγ) were measured using a two-step quantitative real-time polymerase chain reaction (qPCR). Therefore, differentiated Caco-2 cells were incubated with 10 μM capsaicin, nonivamide or trans-pellitorine in serum free DMEM for 15, 30, 60 and 90 min. Alternatively, cells were starved for one hour in serum-free DMEM and the test compound, diluted in HBSS–HEPES, to a final concentration of 10 μM, was added for a further 60 min with or without addition of 5 μM lauric acid as the substrate. After washing with ice-cold PBS, total RNA was isolated using the PeqGold Total RNA Isolation Kit (Peqlab, Germany). RNA concentration and quality was measured using the NanoQuant Plate on an infinite M200 Tecan reader before reverse transcription using a high capacity cDNA kit (Life Technologies, Austria) following the manufacturer's protocol. Real-time PCR was subsequently carried out in triplicates on a Step-One Plus device (Life Technologies) using a Fast SYBR Green Master Mix (Life Technologies) and primers as described before.45 The starting concentrations of the respective mRNA used for reverse transcription were calculated using LinRegPCR v.12.847,48 and compared to those of non-treated control cells (= 1) after normalization to hypoxanthine guanine phosphoribosyl transferase (HPRT1) as a reference gene.Acetyl-CoA synthetase (ACS) activity
ACS activity was assessed as first described by Brown et al.49 using the following enzymatic net reaction:| acetate + ATP + L-malate + NAD+→citrate + AMP + NADH/H+ |
Differentiated Caco-2 cells in 6 cm cell culture dishes were starved for one hour in serum-free DMEM, before addition of the test compounds at a final concentration of 10 μM diluted in HBSS–HEPES for a further 90 min. Residual test compounds were removed by washing the cells two times with ice-cold PBS, and the cells were harvested in 65 mM KH2PO4 buffer using a cell scraper. Protein extracts for ACS determination were obtained by ultrasonic cell dissociation (4× 10 s, 60% power) followed by centrifugation at 15000×g at 4 °C for 15 min. Protein content of the cell lysate was determined using a Bradford test.50 A total of 40 μL of the cell-free supernatant was added to a 140 μL reaction mix containing 7 parts 100 mM Tris/HCl (pH 7.8) and one part each of 50 mM L-malate, 20 mM ATP, 50 mM MgCl2, 2 mM coenzyme A trilithium salt, 60 mM NAD+, 50 U per mL of malate dehydrogenase, and 25 U per mL of citrate synthase. The reaction was started with the addition of 20 μL 1 M sodium acetate and the increase in absorbance at 340 nm was recorded immediately every 10 s for 5 min using a Tecan M200 multiwell plate reader equipped with injectors (Tecan, Austria). The maximum slope in the Δabsorbance/time plot was used for the calculation of ACS activity. Data are expressed in mU per mg protein.
Statistical analysis
Data are presented as means ± SEM or fold change (T/C, treated/control) ± SEM from multiple replicates as indicated in the text or figure and table legends, where n refers to the number of biological replicates with at least two technical replicates each. Outliers determined with the Nalimov outlier test were excluded from calculations. Significant effects versus non-treated control cells were determined using a Student's t-test or one-way ANOVA vs. control followed by a Holm–Sidak post hoc test. Significant differences between multiple treatments (time- and dose-dependent effects) were assessed by one- or two-way ANOVA with a Holm–Sidak post hoc test or a Student–Newman–Keuls post hoc test as noted in the figure and table legends. Significant differences versus control cells are indicated in the figures and tables with *p < 0.05; **p < 0.01; ***p < 0.001. Time- and dose-dependent effects are indicated with distinct letters, and no common letter indicates significance. IC50 values were calculated using one site competition (max = 100) curve fitting in SigmaPlot 11.0.Abbreviations
BCH trans-tert-ButylcyclohexanolCAP Capsaicin
CoA Coenzyme A
CZE Capsazepine
ENaC Epithelial sodium channel
FAU Fatty acid uptake
NV Nonivamide
PEL trans-Pellitorine
TRPV1 Transient receptor potential cation channel subfamily V member 1
Conflict of interest
The authors S. Widder, J.P. Ley and G.E. Krammer are employees of Symrise AG, Holzminden, Germany.Acknowledgements
The financial support by the Austrian Federal Ministry of Economy, Family and Youth and the Austrian National Foundation for Research, Technology and Development and the Symrise AG is gratefully acknowledged.Notes and references
- L. B. Dixon and N. D. Ernst, J. Nutr., 2001, 131, 510S–526S CAS.
- M. L. Wahlqvist, Asia Pac. J. Clin. Nutr., 2005, 14, 313–318 CAS.
- G. A. Bray and L. A. Tartaglia, Nature, 2000, 404, 672–677 CAS.
- K. Diepvens, K. R. Westerterp and M. S. Westerterp-Plantenga, Am. J. Physiol. Regul., Integr. Comp. Physiol., 2007, 292, R77–R85 CrossRef CAS PubMed.
- R. K. Kempaiah and K. Srinivasan, J. Nutr. Biochem., 2006, 17, 471–478 CrossRef CAS PubMed.
- D. Tsi, A. K. Nah, Y. Kiso, T. Moritani and H. Ono, J. Nutr. Sci. Vitaminol., 2003, 49, 437–441 CrossRef CAS.
- C. M. Hochkogler, B. Rohm, K. Hojdar, M. Pignitter, S. Widder, J. P. Ley, G. E. Krammer and V. Somoza, Mol. Nutr. Food Res., 2014, 58, 1282–1290 CAS.
- V. Sharma, J. Boonen, N. S. Chauhan, M. Thakur, B. De Spiegeleer and V. K. Dixit, Phytomedicine, 2011, 18, 1161–1169 CrossRef CAS PubMed.
- J. Boonen, A. Bronselaer, J. Nielandt, L. Veryser, G. De Tre and B. De Spiegeleer, J. Ethnopharmacol., 2012, 142, 563–590 CrossRef CAS PubMed.
- T. Lindmark, Y. Kimura and P. Artursson, J. Pharmacol. Exp. Ther., 1998, 284, 362–369 CAS.
- E. Grasset, M. Pinto, E. Dussaulx, A. Zweibaum and J. F. Desjeux, Am. J. Physiol., 1984, 247, C260–C267 CAS.
- I. J. Hidalgo, T. J. Raub and R. T. Borchardt, Gastroenterology, 1989, 96, 736–749 CAS.
- B. Rohm, A. K. Holik, M. M. Somoza, M. Pignitter, M. Zaunschirm, J. P. Ley, G. E. Krammer and V. Somoza, Mol. Nutr. Food Res., 2013, 57, 2008–2018 CAS.
- M. L. Wahlqvist, Asia Pac. J. Clin. Nutr., 2005, 14, 313–318 CAS.
- G. R. Seabrook, K. G. Sutton, W. Jarolimek, G. J. Hollingworth, S. Teague, J. Webb, N. Clark, S. Boyce, J. Kerby and Z. Ali, J. Pharmacol. Exp. Ther., 2002, 303, 1052–1060 CrossRef CAS PubMed.
- C. S. Walpole, S. Bevan, G. Bovermann, J. J. Boelsterli, R. Breckenridge, J. W. Davies, G. A. Hughes, I. James, L. Oberer and J. Winter, et al. , J. Med. Chem., 1994, 37, 1942–1954 CrossRef CAS.
- T. Kueper, M. Krohn, L. O. Haustedt, H. Hatt, G. Schmaus and G. Vielhaber, Exp. Dermatol., 2010, 19, 980–986 CrossRef CAS PubMed.
- S. Miyauchi, E. Gopal, Y.-J. Fei and V. Ganapathy, J. Biol. Chem., 2004, 279, 13293–13296 CrossRef CAS PubMed.
- M. L. Chalfant, K. Peterson-Yantorno, T. G. O'Brien and M. M. Civan, Am. J. Physiol., 1996, 271, F861–F870 CAS.
- Y. Wei, D.-H. Lin, R. Kemp, G. S. Yaddanapudi, A. Nasjletti, J. R. Falck and W.-H. Wang, J. Gen. Physiol., 2004, 124, 719–727 CrossRef CAS PubMed.
- H. Yamamura, S. Ugawa, T. Ueda, M. Nagao and S. Shimada, J. Biol. Chem., 2004, 279, 44483–44489 CrossRef CAS PubMed.
- T. R. Kleyman and E. J. Cragoe Jr., J. Membr. Biol., 1988, 105, 1–21 CrossRef CAS.
- V. Starai and J. Escalante-Semerena, Cell. Mol. Life Sci., 2004, 61, 2020–2030 CrossRef CAS PubMed.
- K. Sambaiah and M. N. Satyanarayana, Indian J. Exp. Biol., 1980, 18, 898–899 CAS.
- M. R. Srinivasan, K. Sambaiah, M. N. Satyanarayana and M. V. L. Rao, Nutr. Rep. Int., 1980, 21, 455–467 CAS.
- M. R. Srinivasan and M. N. Satyanarayana, J. Biosci., 1987, 12, 143–152 CrossRef CAS.
- M. P. Lejeune, E. M. Kovacs and M. S. Westerterp-Plantenga, Br. J. Nutr., 2003, 90, 651–659 CrossRef CAS.
- J. A. Negulesco, S. A. Noel, H. A. Newman, E. C. Naber, H. B. Bhat and D. T. Witiak, Atherosclerosis, 1987, 64, 85–90 CrossRef CAS.
- F. Nassir and N. A. Abumrad, Immunol., Endocr. Metab. Agents Med. Chem., 2009, 9, 3–10 CrossRef CAS.
- Tight-junction-modulatory factors in food, ed. M. Shimizu, A. Mori, Y. Mine and F. Shahidi, CRC Press, LLC, 2006 Search PubMed.
- T. Lindmark, Y. Kimura and P. Artursson, J. Pharmacol. Exp. Ther., 1998, 284, 362–369 CAS.
- M. van der Stelt, M. Trevisani, V. Vellani, L. De Petrocellis, A. Schiano Moriello, B. Campi, P. McNaughton, P. Geppetti and V. Di Marzo, EMBO J., 2005, 24, 3026–3037 CrossRef CAS PubMed.
- B. Rohm, M. Zaunschirm, S. Widder, J. P. Ley, G. E. Krammer and V. Somoza, in Current topics in flavor chemistry & biology, Proceedings of the 10th Wartburg Aroma Symposium, Eisenach, ed. T. Hofmann, D. Krautwurst and P. Schieberle, Deutsche Forschungsanstalt für Lebensmittelchemie, Freising, 2014, ISBN 978-3-938896-79-2, pp. 43–50 Search PubMed.
- H. Isoda, J. Han, M. Tominaga and T. Maekawa, Cytotechnology, 2001, 36, 155–161 CrossRef CAS.
- Y. Tsukura, M. Mori, Y. Hirotani, K. Ikeda, F. Amano, R. Kato, Y. Ijiri and K. Tanaka, Biol. Pharm. Bull., 2007, 30, 1982–1986 CAS.
- A. Sandoval, A. Chokshi, E. D. Jesch, P. N. Black and C. C. DiRusso, Biochem. Pharmacol., 2010, 79, 990–999 CrossRef CAS PubMed.
- M. Traber, H. Kayden and M. Rindler, J. Lipid Res., 1987, 28, 1350–1363 CAS.
- P. J. Trotter and J. Storch, J. Lipid Res., 1991, 32, 293–304 CAS.
- H.-L. Ji, X.-F. Su, S. Kedar, J. Li, P. Barbry, P. R. Smith, S. Matalon and D. J. Benos, J. Biol. Chem., 2006, 281, 8233–8241 CrossRef CAS PubMed.
- B. Rossier, News Physiol. Sci., 1996, 11, 102–102 Search PubMed.
- M. Fukuda, A. Ohara, T. Bamba and Y. Saeki, Jpn. J. Physiol., 2000, 50, 215–225 CrossRef CAS PubMed.
- J. P. Kampf and A. M. Kleinfeld, J. Biol. Chem., 2004, 279, 35775–35780 CrossRef CAS PubMed.
- P. N. Black, A. Sandoval, E. Arias-Barrau and C. C. DiRusso, Immunol., Endocr. Metab. Agents Med. Chem., 2009, 9, 11–17 CrossRef CAS.
- A. Sandoval, P. Fraisl, E. Arias-Barrau, C. C. DiRusso, D. Singer, W. Sealls and P. N. Black, Arch. Biochem. Biophys., 2008, 477, 363–371 CrossRef CAS PubMed.
- A. Riedel, R. Lang, B. Rohm, M. Rubach, T. Hofmann and V. Somoza, J. Nutr. Biochem., 2014, 25, 750–757 CrossRef CAS PubMed.
- M. V. Berridge, P. M. Herst and A. S. Tan, Biotechnol. Annu. Rev., 2005, 11, 127–152 CAS.
- J. M. Ruijter, C. Ramakers, W. M. Hoogaars, Y. Karlen, O. Bakker, M. J. van den Hoff and A. F. Moorman, Nucleic Acids Res., 2009, 37, e45 CrossRef CAS PubMed.
- J. M. Tuomi, F. Voorbraak, D. L. Jones and J. M. Ruijter, Methods, 2010, 50, 313–322 CrossRef CAS PubMed.
- T. D. Brown, M. C. Jones-Mortimer and H. L. Kornberg, J. Ethnopharmacol., 1977, 102, 327–336 CAS.
- M. M. Bradford, Anal. Biochem., 1976, 72, 248–254 CrossRef CAS.
| This journal is © The Royal Society of Chemistry 2015 |