Relation between operating parameters and desalination performance of capacitive deionization with activated carbon electrodes
Received
18th April 2015
, Accepted 3rd June 2015
First published on 4th June 2015
Abstract
Electrosorptive batch experiments were conducted for the development of a statistical model to describe the relation between operating parameters and desalination performance of capacitive deionization (CDI) with activated carbon electrodes. Results showed that the statistical model reproduced the data well, with both regression and verification R2 values above 0.85. The exponents in the statistical model, shown as 2.79, −0.45, and 1.05 for the applied voltage, spacer thickness, and retention time, respectively, revealed the importance of each factor in the correspondingly examined range. In addition, the effects of interactions between the factors were judged as significant, which could be explained by the electrical double-layer theory. The influence of initial salt concentration could be best characterized by the Langmuir isotherm. This work demonstrates that direct modeling of desalination performance with operating parameters is feasible and the results can be used to guide practical engineering applications.
Water impact
To guide practical implementations of capacitive deionization (CDI) systems for water desalination, quantitative methods to predict the CDI behavior based on operating parameters are essential but not available so far. This work presents a novel attempt at using a statistical modeling approach as a predictive tool to elucidate the relation between operating parameters and desalination performance of CDI. Although CDI is a complex process depending on various factors, our work demonstrates that direct modeling of electrosorption with operating parameters is feasible and the results can be used to guide practical engineering applications.
|
Introduction
As the availability of affordable clean water is becoming a critical issue worldwide, research on desalination technologies for seawater, brackish water, produced water, treated wastewater, etc. is of keen interest to scientists nowadays. Handling, treatment, disposal, and beneficial reuse of these waters have also been great challenges for industry and regulators.1
To date, ion exchange, reverse osmosis, electrodialysis, and evaporation have been the most commonly used desalination technologies. However, their disadvantages including by-product formation, complex pretreatment and operation, and high energy consumption hindered many applications. Capacitive deionization (CDI), or electrosorption as referred in some literature, has emerged as a low-polluting, energy-efficient, and cost-effective alternative to conventional desalination technologies.2 It uses pairs of oppositely charged electrodes to attract ions from the saline water flowing between them, that is, cations move towards the cathode while anions move towards the anode. After the electrodes are saturated with ions, regeneration is performed by removing the electric field and the adsorbed ions are released into the regeneration stream. Carbon materials are known to be ideal candidate electrode materials due to their excellent electrical conductivity and large specific surface area.3 Since electrosorption of ions is an interfacial process, the use of a high surface area porous carbon for maximum contact area between the electrode and the water is beneficial for improving the desalination performance.4 Although many carbon materials (carbon aerogel, ordered mesoporous carbon, carbon nanotubes, graphene, etc.) have been studied,5,6 activated carbon stands out as a commercially available and cost efficient material.4,7 The good electrosorption performance of activated carbon electrodes is attributed to the optimum pore size for the passage of salt ions, and the mesostructure of activated carbon also facilitates the easy movement for adsorption and desorption of ions.8 As a novel electrochemical process, CDI exhibits many advantages over conventional desalination technologies. Unlike ion exchange, it does not need salt for regeneration, and is therefore more environmentally-friendly than resin-based processes.9 In addition, it is a low-pressure non-membrane process operated at ambient conditions and low voltages with simple pretreatment like cartridge filtration, and therefore, minimization of processing costs and waste can be achieved.10
As an emerging technology, CDI is still in the developing stage and research remains to be done before it can be widely applied as a commercial technology. For instance, to design a CDI system, it is important to understand the relation between operating parameters and its desalination performance. Applied voltage, spacer thickness, and retention time are such parameters and must be adjusted to achieve both high salt electrosorption capacity and fast kinetics at the same time during CDI operation. To date, isotherm-based Langmuir and Freundlich equations have been typically applied to describe the adsorption performance of CDI,11,12 and they are expressed below:Langmuir:
| | | qe = qmKLCe/(1 + KLCe) | (1) |
Freundlich:
where
qe is the amount of adsorbed salt at equilibrium (in milligram per gram of activated carbon electrode, mg g
−1),
qm is the maximum amount of adsorbed salt (in mg g
−1),
Ce is the equilibrium concentration of salt in solution (mg L
−1), while
KL,
KF and 1/
n are constants of the corresponding system.
It can be seen from the two expressions that they are both a function of salt concentration and reveal no direct relationship between the operating parameters and the desalination performance. Although some other CDI models13–16 are recently proposed, they may not be easily used. Instead of controllable operating parameters, these recent models were developed based on intrinsic system configurations (e.g. pore size distribution, surface area, capacitance, series resistance, surface group, etc.) that are difficult to adjust during operation. It is important to have a model that is practical in assisting system designs and operations.
Until now, direct modeling of the correlation between CDI performance and these operating parameters is not available. Statistical modeling has been widely used to elucidate the influence of various factors on many system behaviors. Tang et al.17 used statistical approaches to develop an empirical model to evaluate the effects of operating parameters on clean-bed head loss of crumb rubber filtration, and a high correlation between predicted head loss data and actual data was obtained, which outperformed the widely used Kozeny and Ergun equations. It was hypothesized that an empirical model based on a statistical approach for describing salt adsorption as a function of applied voltage, spacer thickness and retention time could be a suitable tool to quantify the influence of these operating parameters on CDI performance for practical engineering use.
In this work, we conducted a series of electrosorptive batch tests under various levels of three operating parameters (applied voltage, spacer thickness, and retention time). The objective of this study was to develop a statistical model for elucidation of the relation between the operating parameters and the desalination performance of CDI. The study will aid in the practical engineering design and operation of CDI systems.
Materials and methods
CDI configuration and reactor setup
Fig. 1 presents the schematic diagram of the CDI configuration and reactor setup. The CDI assembly consisted of stainless steel mesh as current collectors, commercially available activated carbon as electrodes, and nylon mesh spacers to separate the electrodes. The activated carbon cloth (ACC, FM10) with a specific surface area of 1000 m2 g−1 and a thickness of 0.5 mm was obtained from Chemviron UK. The ACC was pre-rinsed with DI water until conductivity in the rinsed water became stable and no more ions were further released. All materials were cut into 3.5 × 3.5 cm2 dimensions and assembled in sequence as shown in Fig. 1, and then the entire stack of all layers was firmly pressed together with a cable tie and placed in the reactor. The reactor included a CDI cell, a conductivity meter, a potentiostat as external power supply, and a magnetic stirring plate with a stirrer for mixing.
 |
| | Fig. 1 Schematic diagram of CDI configuration and reactor setup. | |
Electrosorptive batch experiments
The electrosorptive batch experiments were carried out at room temperature using 0.3 g of ACC as electrodes and 75 mL of NaCl solution (984 mg L−1) with an initial conductivity of 2000 μs cm−1 – a typical value for some fresh water with high salinity and treated wastewater that requires further desalination to be reused. Prior to each experiment, the CDI unit was equilibrated with the tested feed water to eliminate the influence of physical adsorption. The supply voltage was adjusted by a DC potentiostat (RXN-305D, Shenzhen Zhaoxin Power Co. Ltd., China). The spacer thickness was adjusted by increasing or decreasing the layers of nylon mesh between the ACC electrodes. The conductivity of the NaCl solution was monitored by a conductivity meter (DDS-307, Shanghai Yueping Scientific Instruments Co. Ltd., China). The relationship between conductivity and NaCl concentration was obtained by preparing a calibration curve prior to the experiments. The electrosorption at retention time t (qt, mg g−1) was calculated using the following equation:where C0 (mg L−1) and Ct (mg L−1) are the NaCl concentrations at time zero and time t, respectively, V (mL) is the volume of the NaCl solution, and W (g) is the mass of ACC in the CDI assembly.
The study used a mixed-level factorial design to analyze the influence of the operating parameters. Three levels of applied voltage (0.6, 0.9, and 1.2 V) and spacer thickness (2, 4, and 6 mm) and 21 retention times from 0 to 60 min (0, 3, 6, 9, 12, 15, 18, 21, 24, 27, 30, 33, 36, 39, 42, 45, 48, 51, 54, 57, and 60 min) were investigated. The experiments started with pristine ACC for each defined spacer thickness condition, and for each condition 63 cycles (3 voltages × 21 retention times) were performed. The maximum applied voltage was selected based on a value lower than the voltage for water electrodialysis (the voltage for water electrodialysis is about 1.23 V), while the maximum spacer thickness and retention time were selected based on practical engineering considerations such as the control of the CDI device in a small footprint while not sacrificing its desalination efficiency. To elucidate the effect of salt concentration during the electrosorption process, NaCl solutions with initial conductivity from 100 to 2000 μs cm−1 were also tested under operating conditions of 1.2 V applied voltage, 2 mm spacer thickness, and 0–60 min retention time.
Statistical modeling
The statistical modeling process used a total of 189 electrosorption data sets (3 applied voltages × 3 spacer thicknesses × 21 retention times) obtained from the CDI treatment of NaCl solutions with an initial conductivity of 2000 μs cm−1. Based on statistical requirements, 132 data sets (about 70% of the data sets) were randomly chosen to initiate the regression and the remaining 57 data sets (about 30%) were used to validate the corresponding regression results. Sigma Plot 10 (Systat Software Inc, Chicago, Illinois, USA) was used to conduct statistical multiple nonlinear regression. A multiplicative power-law relationship was used to model the electrosorption as a function of applied voltage, spacer thickness, and retention time. The statistical significance of each parameter was evaluated based on a p-value of 0.05 (the smallest choice of α that would allow the null hypothesis to be rejected). The coefficient of determination (R2) was used to evaluate the modeling results. An R2 of 1.0 indicates that the model addresses all the variability of dependent variables, and it generally indicates a strong relation if R2 is large. However, it does not guarantee a statistically valid model since a high R2 can occur with insignificant parameters if only a few data observations are available.17 In this study, the model was validated by (1) examining the p-value of each parameter, and (2) comparing the regression R2 and verification R2.
Results and discussion
CDI behavior
The electroadsorption/electrodesorption behavior of a typical CDI cell is illustrated in Fig. 2, which shows the adsorption and regeneration capability of the cell during the batch operation. A NaCl solution was used, because sodium and chloride occupy a large proportion of the electrosorption capacity of the CDI electrodes due to their high concentration in target solutions in spite of their relatively low affinity compared to other ions.18 After the ACC electrodes were saturated with electroadsorbed ions and the electric field was removed, it took approximately 10 minutes to completely restore to the original state of initial conductivity, and greater than 90% of the electrodesorption was completed in the first 3 minutes. This batch operation test confirmed that complete regeneration could be achieved and the ACC had been pretreated to eliminate the interference of physical adsorption and the obtained adsorption data used in the following modeling process were all attributable to electrosorption.
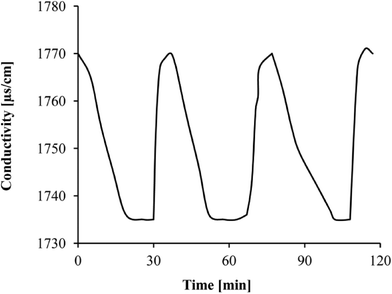 |
| | Fig. 2 Electroadsorption/electrodesorption behavior of a typical CDI cell in batch experiments. | |
Statistical modeling
A multiplicative power-law relationship, as a widely used approach in statistical regressions, is expected to be able to give better results compared to linear and power function approaches.19 In this study, it was used to model the electrosorption as a function of applied voltage, spacer thickness, and retention time. The expression of the model was presented as follows:| | | Electrosorption = K × [applied voltage]a × [spacer thickness]b × [retention time]c | (4) |
where electrosorption, applied voltage, spacer thickness, and retention time were presented in the units of mg g−1, V, mm, and min, respectively, while K was a unitless constant characteristic of the system.
Regression was performed with 70% of data sets and the results are summarized in Table 1. The p-value of the constant K was 0.0013, which was less than 0.05. The p-values of the operating parameters – applied voltage, spacer thickness, and retention time – were all less than 0.0001, showing that these factors were significant. Standard errors of these factors gave the ranges of the variability. In addition, the regression results passed the normality test. Therefore, all factors included in the model correlate with the desalination performance.
Table 1 Parameters in the statistical model
| Parameter |
Value |
Standard error |
p-Value |
Normality test |
|
K
|
0.13 |
0.04 |
0.0013 |
Pass |
|
a
|
2.79 |
0.19 |
<0.0001 |
|
b
|
−0.45 |
0.06 |
<0.0001 |
|
c
|
1.05 |
0.08 |
<0.0001 |
The statistical model was further validated by the 57 remaining data sets. The predicted electrosorption data with the actual observations during the experiments are illustrated in Fig. 3. The 45° lines in the figure depicted the hypothetic electrosorption estimates that were precisely equal to the actual values. Each R2 value was calculated between the predicted data versus actual data and the 45° line. It was found that the regression R2 and verification R2 values were 0.8559 (Fig. 3a) and 0.8648 (Fig. 3b), respectively, which were both higher than 0.85. Therefore, the statistical model reproduced the electrosorption data well and was a suitable tool for interpretation of the relation between the operating parameters and the desalination performance of CDI.
 |
| | Fig. 3 Statistical model predicted data versus actual observations: (a) regression results with 70% data; (b) verification results with 30% data. | |
The data points deviating from the 45° lines imply underestimation or overestimation of electrosorption. The discrepancy may be attributed to the intrinsic properties that were not addressed by the modeling process. In addition, recent publications20–23 detailed how the desalination performance of CDI relates to the potential distribution and the electrode stability during prolonged cycling. The research resembled the practical start-up of a CDI system with pristine activated carbon electrodes followed by continuous cycling and allowing no extra time for pre-charging prior to a new cycle. To improve the accuracy of the statistical data, the charging time and the number of cycles may be controlled.
Interpretation of the modeling results
Fig. 4 is a 3D figure showing the distribution of the statistical model predicted electrosorption data under various combinations of applied voltage and spacer thickness. Based on the results, it could be presumed that the operation of a CDI system with good desalination performance would benefit from a higher voltage, a smaller spacer thickness and a longer retention time. Since these factors included in the model correlate with electrosorption, the value of the constant (a, b and c) related to each factor shows the importance of that factor in the correspondingly examined range, as discussed in sections below.
 |
| | Fig. 4 Statistical model predicted electrosorption under various combinations of applied voltage and spacer thickness in 60 min CDI treatment of a NaCl solution with an initial conductivity of 2000 μs cm−1. | |
Effect of applied voltage.
The exponent of applied voltage, shown as 2.79 in this study, implied a substantial influence of this operating parameter on electrosorption. The observed positive correlation indicates that a higher voltage corresponds to higher electrosorption, which is attributed to a thicker electrical double layer (EDL) and stronger Coulombic interactions between the electrodes and charged ions.24 Therefore, it can be deduced that a lower salt concentration in the effluent of a CDI system can be expected with increased applied potential. However, it should be noted that the faster increase in electrosorption with an increase of applied voltage could not be addressed by a linear relationship. The exponent of 2.79 in the statistical model was greater than 1, showing that as the applied voltage increased from 0.6 to 1.2 V, the electrosorption response became exponential. This was in agreement with the results of Porada et al.14 who reported a nonlinear relationship between cell voltage and salt adsorption. Porada et al.4 suggested an EDL voltage of above 0.5 V during a symmetrical CDI cell design. Tsouris et al.25 found that 1.2 V was an optimum value for the applied voltage and increasing the voltage above this value did not result in a greater removal capacity for ions. This was attributed to the increased parasitic effects of water electrolysis.26 Therefore, for best engineering practice, it is recommended that CDI be operated at a cell voltage of 1.2 V – a voltage slightly lower than the voltage for water electrodialysis (1.23 V).
Effect of spacer thickness.
The exponent of spacer thickness, shown as −0.45 in this study, implied that the factor inversely correlated with electrosorption. Smaller spacer thickness means shorter distance for the ions to travel to the electrodes under an applied potential, which improves the desalination performance. In addition, because the adsorption capacity of electrodes is mainly affected by the EDL capacity due to the electrostatic attractive force between the ions and the electrodes,10 a smaller spacer thickness leads to the formation of a thicker EDL and lower electric resistance in the solution between the electrodes, both of which are beneficial for electrosorption. Although a smaller spacer thickness is theoretically preferred for higher electrosorption, for best engineering practice, there should be a thorough consideration of the increased potential of short circuit and clogging and decreased saline water treatment capacity if the spacer thickness is made too small.
Effect of retention time.
Jande and Kim16 included the flow rate as a factor in the modeling of single-pass CDI operation, and suggested a different effect compared with that of batch-mode CDI. Retention time is a term that illustrates the length of period that saline water stays in contact with the CDI electrodes. The term is applicable in both batch-mode and single-pass CDI operations, and was therefore modeled in this study instead of the flow rate. The exponent of retention time, shown as 1.05 in the statistical model, implied a positive correlation between this operating parameter and electrosorption. This is because an increased retention time allows the solution to complete the required ion transfer for purification. Li and Zou26 observed a steep adsorption at the beginning of the CDI process, indicating a high adsorption rate constant followed by a decreasing trend with lowered conductivity in the solution as the retention time increased further. The exponent of 1.05 found in this study demonstrated a close-to-linear relationship which resembled the first phase at the beginning of the CDI process, indicating that the electrodes were not saturated yet in the modeling process of the batch experiments. Therefore, increasing the retention time before the saturation of electrodes is beneficial for electrosorption. For best engineering practice, it is recommended that the optimum retention time be determined based on the inflection point of the electrosorption curve. Before the inflection point, there is an approximately linear relationship as revealed in the statistical model and the improved electrosorption can be obtained by increasing the retention time through decreasing the flow rate or increasing the number of CDI cells connected in parallel, which allows more time for ion transfer from the saline water to the CDI electrodes. After the inflection point, the improvement of electrosorption by increasing the retention time slows down as revealed by Li and Zou,26 and there would be practical considerations to balance the footprint and cost of CDI systems for engineering applications.
Interactions between the factors.
A mixed-level factorial calculation with the assistance of MINITAB 15 (Minitab Inc., State College, Pennsylvania, USA) was conducted to analyze the standardized effects of each factor and their interactions, and the results are shown in Fig. 5. The threshold value, as denoted by the vertical line in the Pareto chart of the standardized effects, was determined to be 1.97 with a significance level of 0.05. It is not surprising to find that the individual factors were significant and their standardized effects were in agreement with the absolute values of their exponents (|applied voltage| > |retention time| > |spacer thickness|). It is worth mentioning that all interactions between the factors were judged as significant, since their p-values were less than 0.05. This is because the applied voltage, spacer thickness and retention time all affect the electrosorption by the same mechanism, which is the EDL theory describing the Coulombic interactions and facilitation of ion transfer to the electrodes as discussed in the previous sections. Being more specific, AC indicates the combined effect of applied voltage and retention time, as a higher voltage relates to less required time to complete ion transfer. AB presents the combined effect of applied voltage and spacer thickness, as a higher voltage and a smaller spacer thickness both contribute to a thicker EDL. BC describes the combined effect of spacer thickness and retention time, as a smaller spacer thickness also results in less required time to complete ion transfer. ABC is an indication of the combined effect of all three factors. Among the effects of these interactions, the interaction between applied voltage and retention time showed a much higher effect than others, suggesting a wise move to firstly adjust these two operating parameters to obtain the desired desalination performance for engineering practice.
 |
| | Fig. 5 Pareto chart of the standardized effects showing the results of factorial calculation. (Response is based on observed electrosorption in mg g−1. Significance level = 0.05). | |
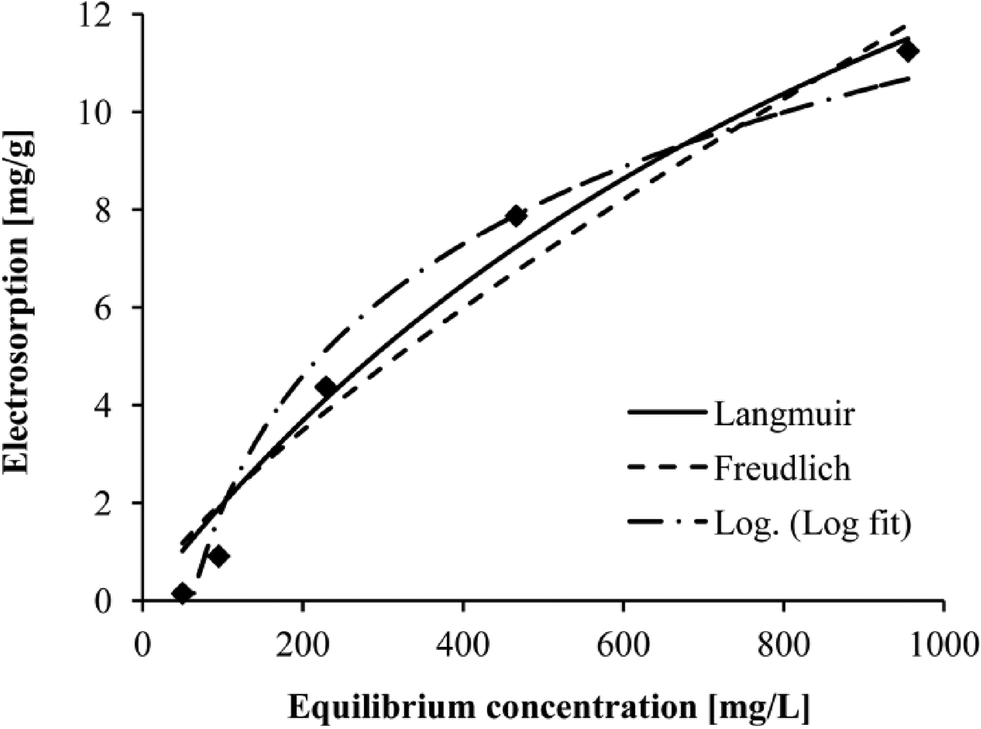
Isotherm-based models
Initial salt concentration was not considered as an operating parameter for the statistical model in this study. However, its influence has been well characterized by isotherm-based models, i.e. Langmuir and Freundlich equations. To further investigate the CDI behavior under the influence of initial salt concentration, five electrosorptive batch experiments with NaCl solutions were carried out under an applied voltage of 1.2 V and a spacer thickness of 2 mm. The initial conductivity of NaCl solutions was 100, 200, 500, 1000, and 2000 μs cm−1, respectively. The obtained electrosorption data were fitted by Langmuir, Freundlich, and the least-squares fitting logarithmic equation, which is expressed as follows:where qe is the amount of adsorbed salt at equilibrium (mg g−1), Ce is the equilibrium concentration of salt in solution (mg L−1), while a and b are constants characteristic of the system.
Fig. 6 shows the correspondence between the actual data and the three fitting lines. In general, all models reproduced the data well, and high correlations between actual salt adsorption and predicted salt adsorption were obtained. Table 2 shows that the Langmuir equation correlated better with the experimental data according to an R2 of 0.9746 followed by the logarithmic equation (R2 = 0.9722) and Freundlich equation (R2 = 0.9550). This implied that the ion sorption could be described by the Langmuir isotherm, indicating monolayer adsorption.27 It can be deduced that as the saline water flows between a series of electrode pairs, the electrosorption of each pair decreases as the electrolyte solution concentration drops.18 This implies that during the operation of a CDI device with multiple pairs of electrodes in series, the electrodes in front may have saturated, while the electrodes in the end may not. For best engineering use, it is important to propose a design that can make the best use of the saturation capacity of all electrodes to avoid frequent regeneration and increase water production.
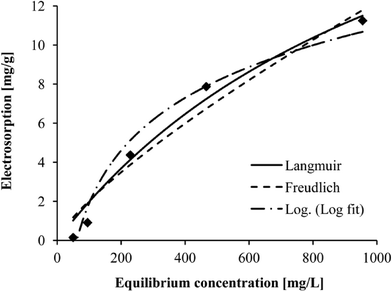 |
| | Fig. 6 Langmuir, Freundlich, and logarithmic model predicted electrosorption versus actual observations in 60 min CDI treatment of NaCl solutions with different initial conductivities from 100 to 2000 μs cm−1. | |
Table 2 Parameters in the Langmuir, Freundlich, and least-squares fitting logarithmic equations
| Equation |
Parameter |
Value |
| Langmuir |
q
m
|
26.1783 |
|
K
L (×10−4) |
8.2038 |
|
R
2
|
0.9746 |
| Freundlich |
K
F
|
0.0565 |
| 1/n |
0.7783 |
|
R
2
|
0.9550 |
| Logarithmic |
a
|
3.8873 |
|
b
|
−15.993 |
|
R
2
|
0.9722 |
Other researchers conducted similar experiments to plot salt concentrations versus electrosorption with different materials as electrodes,11,12,26,28 and their data were in agreement with Langmuir isotherms as well, indicating monolayer coverage of the electrode surface area.29 This phenomenon suggests that the monolayer adsorption is primary during the electrosorption process. Since the electrosorption behavior of CDI would follow the Langmuir isotherm, the desalination performance at other feed salt concentrations could be predicted by the isotherm-based model for engineering use.
Conclusions
CDI is a complex process and modeling is an important approach for gaining a thorough understanding of its desalination performance for practical engineering use. In this paper, a series of electrosorptive batch experiments were conducted for the development of a statistical model to describe the relation between operating parameters (applied voltage, spacer thickness, and retention time) and desalination performance of CDI with activated carbon electrodes. The statistical model was validated by statistical requirements. It reproduced the data well, with both regression and verification R2 values above 0.85. It can be deduced that operation of a CDI system with good desalination performance would benefit from a higher voltage, a smaller spacer thickness and a longer retention time. The exponents in the statistical model, shown as 2.79, −0.45, and 1.05 for the applied voltage, spacer thickness, and retention time, respectively, revealed the importance of each factor in the correspondingly examined range. In addition, the effects of interactions between the parameters were judged as significant, which could be explained by the electrical double-layer theory. The influence of initial salt concentration could be best characterized by the Langmuir isotherm, which can be used to predict the desalination performance at other feed salt concentrations. This work demonstrates that direct modeling of desalination performance with operating parameters of CDI is feasible and the results can be used to guide practical engineering applications. A future study will explore how the modeling process described in this paper depends on other electrode materials and salt constituents.
Acknowledgements
This research was supported, in part, by Minn Water (Minneapolis, Minnesota, USA) under project no. 1390501914. The authors acknowledged Ningbo Chuanming Electrosorption Equipment Co. Ltd. (Ningbo, China) for assistance on acquiring materials for the bench work.
References
- C. Forrestal, Z. Stoll, P. Xu and Z. Ren, Environ. Sci.: Water Res. Technol., 2015, 1, 47–55 Search PubMed.
- L. Zou, G. Morris and D. Qi, Desalination, 2008, 225, 329–340 CrossRef CAS PubMed.
- Y.-J. Kim, J.-H. Kim and J.-H. Choi, J. Membr. Sci., 2013, 429, 52–57 CrossRef CAS PubMed.
- S. Porada, R. Zhao, A. van der Wal, V. Presser and P. M. Biesheuvel, Prog. Mater. Sci., 2013, 58, 1388–1442 CrossRef CAS PubMed.
- Y. Gao, L. Pan, H. Li, Y. Zhang, Z. Zhang, Y. Chen and Z. Sun, Thin Solid Films, 2009, 517, 1616–1619 CrossRef CAS PubMed.
- Y. Wimalasiri and L. Zou, Carbon, 2013, 59, 464–471 CrossRef CAS PubMed.
- M.-W. Ryoo and G. Seo, Water Res., 2003, 37, 1527–1534 CrossRef CAS.
- L. Zou, L. Li, H. Song and G. Morris, Water Res., 2008, 42, 2340–2348 CrossRef CAS PubMed.
- K. C. Leonard, J. R. Genthe, J. L. Sanfilippo, W. A. Zeltner and M. A. Anderson, Electrochim. Acta, 2009, 54, 5286–5291 CrossRef CAS PubMed.
- P. Xu, J. E. Drewes, D. Heil and G. Wang, Water Res., 2008, 42, 2605–2617 CrossRef CAS PubMed.
- H. Li, L. Zou, L. Pan and Z. Sun, Environ. Sci. Technol., 2010, 44, 8692–8697 CrossRef CAS PubMed.
- Z. Chen, C. Song, X. Sun, H. Guo and G. Zhu, Desalination, 2011, 267, 239–243 CrossRef CAS PubMed.
- R. Zhao, P. M. Biesheuvel, H. Miedema, H. Bruning and A. van der Wal, J. Phys. Chem. Lett., 2010, 1, 205–210 CrossRef CAS.
- S. Porada, L. Borchardt, M. Oschatz, M. Bryjak, J. S. Atchison, K. J. Keesman, S. Kaskel, P. M. Biesheuvel and V. Presser, Energy Environ. Sci., 2013, 6, 3700–3712 CAS.
- Y. A. C. Jande and W. S. Kim, Sep. Purif. Technol., 2013, 115, 224–230 CrossRef CAS PubMed.
- Y. A. C. Jande and W. S. Kim, J. Ind. Eng. Chem., 2014, 20, 3356–3360 CrossRef CAS PubMed.
- H. L. Tang, J. M. Regan, S. E. Clark and Y. F. Xie, J. Environ. Eng., 2011, 137, 55–62 CrossRef CAS.
- M. Mossad and L. Zou, J. Hazard. Mater., 2012, 213–214, 491–497 CrossRef CAS PubMed.
- Z. Tang, M. A. Butkus and Y. F. Xie, Environ. Eng. Sci., 2006, 23, 561–569 CrossRef CAS.
- E. Avraham, M. Noked, Y. Bouhadana, A. Soffer and D. Aurbach, Electrochim. Acta, 2010, 56, 441–447 CrossRef CAS PubMed.
- I. Cohen, E. Avraham, Y. Bouhadana, A. Soffer and D. Aurbach, Electrochim. Acta, 2013, 106, 91–100 CrossRef CAS PubMed.
- X. Gao, A. Omosebi, J. Landon and K. Liu, J. Electrochem. Soc., 2014, 161, E159–E166 CrossRef PubMed.
- X. Gao, A. Omosebi, J. Landon and K. Liu, Energy Environ. Sci., 2015, 8, 897–909 CAS.
- H. Li, L. Zou, L. Pan and Z. Sun, Sep. Purif. Technol., 2010, 75, 8–14 CrossRef CAS PubMed.
- C. Tsouris, R. Mayes, J. Kiggans, K. Sharma, S. Yiacoumi, D. DePaoli and S. Dai, Environ. Sci. Technol., 2011, 45, 10243–10249 CrossRef CAS PubMed.
- H. Li and L. Zou, Desalination, 2011, 275, 62–66 CrossRef CAS PubMed.
- C. J. Gabelich, T. D. Tran and I. H. Suffet, Environ. Sci. Technol., 2002, 36, 3010–3019 CrossRef CAS.
- X. Z. Wang, M. G. Li, Y. W. Chen, R. M. Cheng, S. M. Huang, L. K. Pan and Z. Sun, ECS Solid State Lett., 2006, 9, E23–E26 CrossRef CAS PubMed.
- Z.-H. Huang, M. Wang, L. Wang and F. Kang, Langmuir, 2012, 28, 5079–5084 CrossRef CAS PubMed.
|
| This journal is © The Royal Society of Chemistry 2015 |
Click here to see how this site uses Cookies. View our privacy policy here. 
 *ab
*ab