Membrane configuration influences microbial capacitive desalination performance
Dandan
Ma
ab,
Casey
Forrestal
b,
Min
Ji
a,
Ruying
Li
a,
Hongting
Ma
a and
Zhiyong Jason
Ren
*b
aSchool of Environmental Science and Engineering, Tianjin University, Weijin Road 92, Tianjin 300072, China
bDepartment of Civil, Environmental, and Architectural Engineering, University of Colorado Boulder, Boulder, CO 80309, USA. E-mail: jason.ren@colorado.edu; Tel: +1 (303) 492 4137
First published on 25th February 2015
Abstract
A microbial capacitive desalination cell (MCDC) is a new bioelectrochemical reactor for energy-positive wastewater treatment and desalination. So far, MCDCs have only used two cation exchange membranes (CEMs) to separate three chambers (CC-MCDC), and in this study we investigated how and why different membrane setups can impact system performance. Three types of MCDCs were developed by using different combinations of CEMs and anion exchange membranes (AEMs). In addition to the CC-MCDC, a CA-MCDC used a CEM to separate the anode chamber from the middle chamber and an AEM to divide the middle and cathode chambers, and an AA-MCDC used two AEMs to separate the three chambers. Results showed that the membrane effects are significant due to the different ion transfer mechanisms. The CA-MCDC shows higher performance by removing salts from all three chambers, with anode, middle, and cathode chamber desalination efficiencies of 14.5%, 44.4%, and 5.3%, respectively. The performance of the reactors decreased by 7–12% after a 5-month operation, and the AA-MCDC showed the lowest membrane scaling potential during the long-term operation.
Water impactResearch into desalination using a microbial electrochemical system has used either electrodialysis to drive desalination through ion-exchange membranes (a microbial desalination cell (MDC)), or capacitive deionization which adsorbs the ions onto a high surface electrode (a microbial capacitive desalination cell (MCDC)). However, both of these traditional systems were flawed in that while one part of the reactor was desalinating another part was becoming more concentrated. Here we present a new reactor configuration using the MCDC system that simultaneously desalinates all electrolyte solutions in the reactor. Additionally, biofouling and scaling are major concerns for desalination reactors. Here we demonstrate how a reactor configuration can improve the long-term operation of MCDC systems. |
Introduction
The severe shortage of fresh water due to economic growth and climate change in many areas, such as Western USA and Northern China, is pressing the development of new technologies to desalinate seawater and saline groundwater as new water sources. However, the cost of supplying desalinated water is higher than through conventional means, thus representing an increased financial burden on governments and users. The cost of supplying freshwater is about US$0.2 m−3, and for desalinated water the cost ranges between US$0.5 and 0.8 m−3.1 One main research area that can reduce desalination cost is energy saving, because most current desalination processes are energy intensive. For example, reverse osmosis units require 3–5 kWh m−3 for water desalination and multi-stage flash evaporation may require up to 68 kWh m−3.2 Desalination driven by renewable energies, such as solar, wind and geothermal energies, has received increasing attention.3 However, at the current stage, desalination powered by renewable energy costs more than the methods powered by conventional energy sources even though environmental benefits may balance the high cost in the long run.4Microbial desalination cell (MDC) is a recently developed technology that can desalinate water by using the electrical potential generated by microorganisms during organic degradation to drive ion transport through a pair of cation exchange membranes (CEM) and anion exchange membranes (AEM). The MDC system is considered as an energy-neutral or positive process because it does not use any external power but rather converts the biochemical energy stored in waste to electricity or hydrogen gas.5,6 A traditional MDC contains 3 chambers, with a CEM against the anode and an AEM against the cathode, which allows the cations and anions to migrate from the middle desalination chamber to the anode and cathode chambers, respectively. However, such a design suffers from pH fluctuation problems, and the salts removed from the middle chamber become concentrated in the anode and cathode chambers, making water reuse a challenge.7 Membrane fouling and scaling were also reported as results of ion migration.8,9 The newly developed microbial capacitive desalination cell (MCDC) addressed these problems by replacing the AEM with another CEM to allow free proton transfer, and by capacitively adsorbing ions through a high surface electrode assembly in the middle chamber to prevent salt migration.10–12 Taking advantage of the potential generated across the anode and cathode, the MCDC was capable of removing 72.7 mg of total dissolved solids (TDS) per gram of ACC without using any external energy, which was 7 to 25 times more efficient than the traditional capacitive deionization processes.12 It has also been used to treat shale gas produced water and recover energy, which showed superior performance compared to MDC by removing COD at a rate of 170 mg L−1 per hour and TDS at a rate of 2760 mg L−1 per hour, 5 times and 18 times faster than the MDC, respectively.13,14
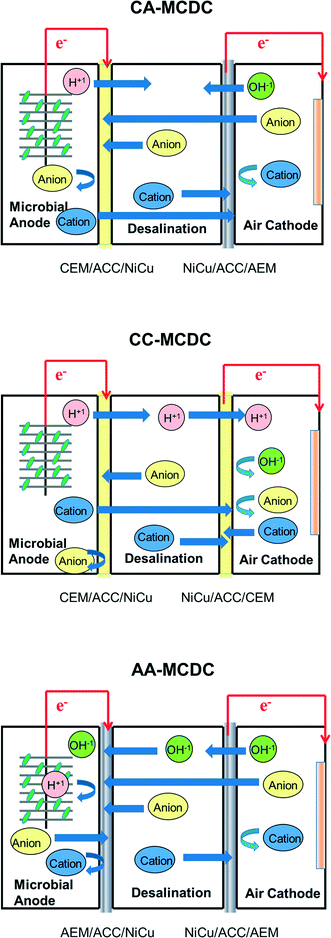
To further understand the ion transport and removal mechanisms and improve system performance under different membrane conditions, two new types of MCDCs were built in this study and compared with the first CEM–CEM design (CC-MCDC). One reactor switched the traditional location of the membranes by placing the CEM between the anode and the middle chambers and the AEM between the cathode and the middle chambers (CA-MCDC) (Fig. 1). In this reactor, cations migrate from the anode chamber to the middle chamber while anions are transferred from the cathode chamber to the middle chamber. Both migrated ions and ions in the middle chamber are adsorbed on the electrical double layer capacitors present on the surface of the capacitive electrode assembly interface. The third configuration used two pieces of AEMs to separate the three chambers, which is called AA-MCDC. This configuration allows anions to transfer from the catholyte to the middle chamber and hydroxyl removal in a process that minimizes pH fluctuation. The key difference between the MCDC and the MDC is the method of salt removal. In the MCDC, salts are capacitively adsorbed rather than relocated. The driving force of MCDC electrical salt adsorption is the electrical potential generated between the anode and the cathode assemblies in the middle chamber. System performance is also affected by the junction potentials between the anode and the anodic assembly, and the cathode and the cathode assembly, as well as the concentration difference between the different chambers. The hypothesis of this study is that by understanding and modulating ion transport under different membrane configurations, the removal mechanisms can be further understood and system performance can be improved. Fig. 1 shows the hypothesized ion-transfer mechanisms within different reactors. The process of salt removal in the different chambers was characterized, long-term system performance was monitored, and the effects of regeneration on electrode integrity were analyzed.
Materials and methods
Reactor configuration and construction
Three MCDCs, designated as CA-MCDC, AA-MCDC and CC-MCDC, were constructed and operated in parallel during the study. For each reactor, three cube-shaped polycarbonate blocks were clamped together to form one anode chamber, one cathode chamber and one middle chamber with effective volumes of 25, 10 and 23 mL, respectively. The difference in the effective liquid volume is due to the different electrode volumes occupied inside the chambers. The membrane pairs used in each reactor to separate the anode chamber from the middle chamber and the middle chamber from the cathode chamber are CEM–AEM (CA-MCDC), AEM–AEM (AA-MCDC), and CEM–CEM (CC-MCDC), respectively (Fig. 1).12 Two capacitive carbon electrodes placed in parallel were set into the middle desalination chamber and they were connected to the anode and cathode electrodes to apply the electrical potential to the middle chamber electrodes for capacitive adsorption. Each electrode assembly was constructed by placing a membrane (CMXSB or AMXSB, Astom Corporation, Japan), a Ni/Cu mesh current collector (McMaster-Carr, IL), and 4 layers of activated carbon cloth (ACC, Chemviron Carbon, UK) together. The total weight of the ACC was 2.1 g. The ACC assemblies were connected to the anode/cathode by titanium wires. Four pieces of filter paper separated the assemblies in order to avoid short circuit. A graphite brush (25 mm diameter × 30 mm length) was used as the anode. The cathode consisted of a 30% wet-proofed carbon cloth with platinum (0.5 mg cm−2) and four diffusion layers on it with an effective surface area of 9 cm2.15,16 Prior to use, the carbon cloth and brush were pretreated by washing with acetone overnight and heating to 350 °C for 30 minutes.17The MCDCs were inoculated with anolyte effluent obtained from a microbial fuel cell operated using acetate as the carbon source. The MCDC anolyte medium contains (per liter) 1.6 g of CH3COONa, 1.5 g of NH4Cl, 0.1 g of CaCl2·2H2O, 0.1 g of MgCl2·6H2O, 12.5 mL of trace mineral solution, and 100 mM potassium phosphate buffer solution (PBS). The solution conductivity was 12.1 mS cm−1. The catholyte contained the same ionic strength of PBS buffer solution. The middle chamber was filled with 5 g L−1 NaCl during the beginning of each operation for desalination operation.
Reactor operation
The reactors were operated in two-chamber MFC mode before conducting desalination experiments. All three types of MCDCs were transformed from MFC to MCDC mode by inserting membrane assemblies following multiple repeatable voltage profiles.18 During operation, the anode and cathode were connected to the assemblies, and the salt water continuously recirculated between the middle chamber and an external reservoir (30 mL) at a rate of 2 mL min−1. One abiotic control reactor with two cation exchange membranes but without inoculum was operated to measure the physical adsorption capacity of ACC assemblies and understand the effects of infiltration caused by the salinity gradient. Because of the absence of microorganisms, no electrical potential is generated across the electrodes and therefore no electrical adsorption. To regenerate the ACC assemblies, the polarity of the applied potential was reversed and then the desalination chambers were rinsed with 30 mL of deionized water for 30 minutes to remove the electrically adsorbed salts. When the ACC assembly's potential difference reached 0 ± 0.5 mV, the ACCs were assumed to be electrically regenerated. After electrical regeneration, the anode and cathode were connected using a 1000 Ω resistor to maintain microbial activity while the assemblies were short circuited to prevent ions from re-adsorbing onto the charged assemblies.12 Because the membrane configurations are different from traditional MDCs, this connection is different from MDC operation.Analysis and calculations
Salt concentrations were measured in conductivity using a conductivity meter (Sension 156, HACH Co., USA). The concentration of NaCl was experimentally confirmed having a linear correlation with the conductivity of NaCl solution within the range of NaCl concentration tested in the study. To evaluate the desalination performance, eqn (1) was used to determine the quantity of adsorbed salts per gram of ACC. | (1) |
| SRR = (ΔTDSd)/m·U | (2) |
The electrolyte pH was monitored using a pH meter (Sension 156, HACH Co., USA). The concentration of chemical oxygen demand (COD) was measured using a colorimeter according to the manufacturer's procedure (Hach DR/890, Hach Loveland, CO). The internal resistance change of the MCDCs was determined by electrochemical impedance spectroscopy (EIS) which was conducted using a potentiostat (G300, Gamry Instrument Inc.). EIS measurements were performed by using the anode as the working electrode and the cathode as the counter electrode. EIS measurement was performed under open-circuit voltage conditions. The internal resistances of the cell were obtained from Nyquist plots, where the intercept of the curve with the Zre axis was defined as the ohmic resistance.19 Anode and cathode potentials were determined using a potentiostat and a Ag/AgCl reference electrode.
Results and discussion
Ion removal in the three chambers of different MCDCs
During desalination, the ACC assemblies were charged by an electrical potential formed across the anode and cathode. Fig. 2 shows the variation of the potentials among the three MCDCs, as well as the decrease in conductivity in the middle chamber, due to the electrical potential generated by microorganisms in the anode chamber. The desalination rates were the greatest at the beginning of the adsorption stage and then decreased gradually, suggesting that the adsorption capacity of the ACC assemblies decreased along with the increased amount of salt adsorbed on the assemblies. Such decreased desalination rates indicate that the high salt removal at the beginning was mainly due to a combined physical and electrical adsorption, while the later slower drop is attributed to electrical adsorption. This can be supported by the observation that the negative control also showed the greatest conductivity decrease during the first several minutes but showed no further decrease due to lack of electrical adsorption capability. The CC-MCDC showed the highest removal in the middle chamber, with the conductivity decreasing from 8.14 mS cm−1 to 3.94 mS cm−1. The salt removed for CA-MCDC, AA-MCDC and CC-MCDC was 47.7 ± 0.4%, 43.3 ± 0.3%, and 51.6 ± 1.0%, respectively, and electrical adsorption alone contributed to 7.1%, 5.7% and 10.1%, respectively, of the overall conductivity removal. For the MCDCs, the ion adsorption can be observed comparatively to the charge formed between the ACC assemblies. In traditional CDI studies, applied potential is directly correlated with salt removal.20 However, for the MCDC such correlations between voltage and salt removal among the different reactor configurations cannot be directly observed, likely due to a combination of factors including membrane fouling, ion flux into the middle chamber and microbial electrical current generation.8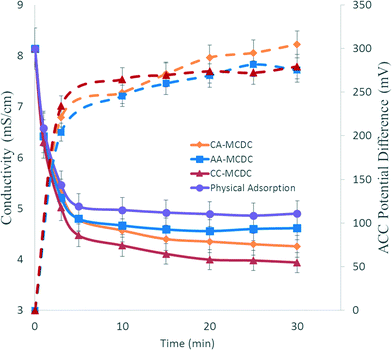 | ||
| Fig. 2 Changes and correlations between the charge potentials across the ACC assemblies (dotted lines) and conductivity (solid lines) in the middle desalination chamber. | ||
Fig. 3 shows the normalized adsorption capacity of the ACC assembly (QA, the quantity of adsorbed TDS per gram of ACC) based upon the reduction of conductivity in all three chambers. The QAs of CA-MCDC, AA-MCDC, CC-MCDC, and the negative control reactor were 39.8, 32.2, 29.5, and 20.5 mg g−1, respectively. The results showed that for the same amount of adsorptive material, the CEM–AEM assembly in the CA-MCDC adsorbed the most TDS because it allows free migration of the ions within the reactor which resulted in a fraction of the salts adsorbed coming from the anode and cathode chambers in addition to the middle chamber. The configuration also leads to co-ion repulsion inhibition compared with other reactors, which further contributed to ion removal.21
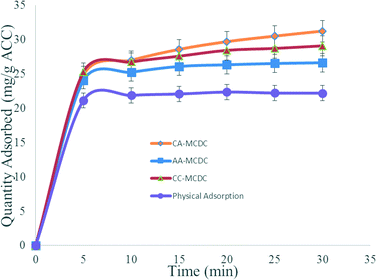 | ||
| Fig. 3 Normalized TDS adsorption quantities of the three active MCDCs and of the abiotic negative control. | ||
The conductivity variations in the anolyte and catholyte for the MCDCs are shown in Fig. 4. In the middle chamber, salts are removed by capacitive deionization, but changes in conductivity in the anode and cathode are associated with either ion migration across a membrane or by biochemical scaling on the membrane.9 The CA-MCDC demonstrated the best desalination performance for the middle chamber, which is also reflected by the anolyte and catholyte conductivity change. During three typical desalination and regeneration cycles, the electric potential of the ACCs electrically attracted the opposite ions in the anolyte and catholyte that crossed the membranes and substantially decreased anolyte conductivity by 1.75 mS cm−1 and catholyte conductivity by 0.67 mS cm−1. Similar to the CA-MCDC, the negative potential of the ACC assembly behind the CEM in the CC-MCDC drives the cations in the anolyte across the CEM to the desalination chamber and leads to significant ion removal in the anolyte. In contrast, for both the CA-MCDC and the AA-MCDC, the anions in the catholyte may have been driven across the AEM by the positive potential of the ACC, or because of concentration gradients and the formation of a junction potential, which resulted in ion removal from the catholyte. However, unlike the CA-MCDC that allows appropriate ion migration in both chambers, the cations in the anolyte of the AA-MCDC and anions in the catholyte of the CC-MCDC under the electrical potential were prevented from migrating into the middle chamber by the intercepting AEM and CEM, which resulted in conductivity increase or no removal in the respective chambers. Because of the effect of concentration gradients between the anolyte/catholyte and the salt solution, the conductivity of the anolyte in the abiotic control reactor also slowly decreased as a result of ion migration. Compared to the salt removal in the middle chamber, the lower desalination efficiencies of the anode and cathode chambers are partially due to the lack of electrical double layer adsorption, the ion transfer resistance across ion-exchange membranes, and the equal electrical potential between the ACC and the connected anode or cathode.9,20,22 Additionally, the junction potential and concentration gradients between the anode, cathode and desalination chambers also contribute to ion migration, which should be further explored.
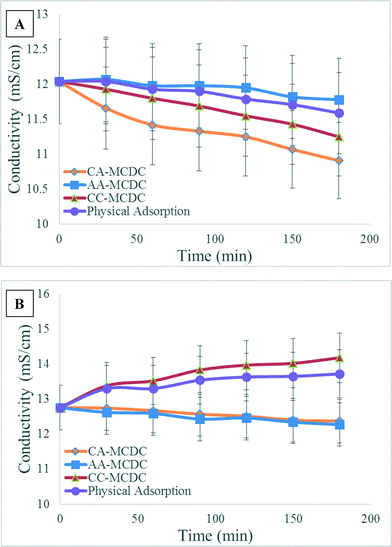 | ||
| Fig. 4 Conductivity variations in the anode (A) and cathode (B) chambers of the MCDCs and in the negative control over 3 consecutive batch cycles. | ||
The specific removal rates in terms of SRR values after one desalination cycle were 27.8 mg V−1 g−1, 23.6 mg V−1 g−1 and 27.0 mg V−1 g−1 for the CA-MCDC, AA-MCDC, and CC-MCDC, respectively. These SRR values take into account both the physical and the electrical adsorption values because during the experiments, physical and electrical adsorption occurred simultaneously and therefore cannot be directly separated. A higher SRR value means more effective use of the voltage potential applied on the ACCs for electrical ion adsorption, which proves that the CA-MCDC is a better configuration than the other 2 configurations. The slow removal rate in the AA-MCDC could be attributed to the decline of the anode pH, which may have inhibited the activity of the electrochemically active bacteria, and the relatively slow moving rate of the anions in the cathode. While strong buffer capacity was provided to prevent pH from affecting the results, the pH in the anode chamber of the AA-MCDC showed almost a 4× larger change in pH from 7.15 to 6.93 than the other configurations tested, likely due to proton accumulation and slow migration across the AEM.
Membrane assembly regeneration
To regenerate the ACC assemblies in situ after desalination, the polarity of the voltage applied on the assemblies was reversed by exchanging the connection of the anode and cathode electrodes. During the regeneration stage, the captured salt was desorbed from the ACCs under the repulsion force of the exchanged electrodes. In less than half an hour, the potential difference was dissipated with the adsorbed salt being released back into the solution. The salt recovery ratios for the CA-MCDC, AA-MCDC, and CC-MCDC were 124.4%, 122.9% and 128.2%, respectively, which indicate that more ions migrated from the anode and cathode chambers to the middle chamber. Compared to traditional CDI systems that consume 0.21–1.78 Wh external energy to generate the potential to remove 1 g of TDS, the MCDCs accomplished desalination as well as ACC regeneration by utilizing the in situ potential difference generated by microorganisms without using any external energy.12 Short circuiting the ACC assemblies after complete electrical salt desorption was used to prevent re-adsorption of ions onto the electrical double layer.MCDC performance during a long-term operation
The tested MCDCs were operated for over 3600 h in fed-batch mode using sodium acetate as the anode substrate. Fig. 5 shows representative salt removal profiles during the beginning period of operation (0–400 h) and the final period of operation (3600 h). At the beginning of operation with newly installed ion-exchange membranes and ACC assemblies, the maximum salt removed for one cycle in the desalination chambers were 47.7 ± 0.4%, 43.3 ± 0.3%, and 51.6 ± 1.0% for the CA-MCDC, AA-MCDC, and CC-MCDC, respectively. After 3600 h of operation, the desalination efficiencies of the MCDC middle chambers decreased by 7.2%, 5.4%, and 12.0%, respectively.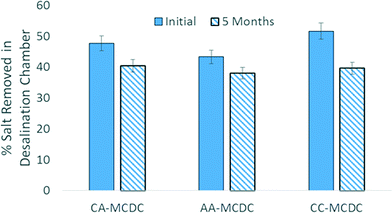 | ||
| Fig. 5 Long-term performance change in terms of desalination efficiency of the MCDC desalination chambers between the beginning and the end of the 5-month operation. | ||
Electrochemical impedance spectroscopy (EIS) measurements indicated the increase in ohmic resistance after a 4-month operation, which was positively correlated with performance drop. The ohmic resistances of the CA-MCDC, AA-MCDC, and CC-MCDC increased from 2.4, 3.8, and 2.5 Ω at the beginning to 33.5, 41.2, and 54.6 Ω, respectively, after 3550 h. The higher starting ohmic resistance of the AA-MCDC is believed to be due to a slightly higher resistance of the AEM than the CEM. The open-circuit potentials of the MCDC anodes were maintained around −340 mV during the 5-month operation which suggests that microbial activity on the anode was not a limiting factor. The pH was relatively stable across the different chambers due to the sufficient buffer capacity designed to minimize pH effects. The ion-exchange membranes and ACC assemblies of the MCDCs were disassembled to observe the biofouling and scaling after the 5-month operation. Deformation and color changes were visible on the CEM and AEM after 3600 h of MCDC operation. The surface of the used CEM that faced the cathode chamber in the CC-MCDC had the most severe scaling layer compared to the CA-MCDC and AA-MCDC. The reason is presumably due to the negative potential of the ACC assembly in the middle chamber, attracting cations within the catholyte moving toward the desalination chamber. This is consistent with the previous membrane scaling observation in microbial desalination reactors.8,9
Conclusion
The results obtained in this study show that membrane configuration in a MCDC can dramatically affect ion movement in different chambers and long-time operation stability. The CA-MCDC developed here can be used to simultaneously remove salt from all three chambers. The conductivity reductions of the salt solution, anolyte, and catholyte in the CA-MCDC were 44.4%, 14.5% and 5.3%, respectively. The two pieces of AEM used in the AA-MCDC demonstrated improved performance by minimizing the effect of scaling on the membrane between the desalination/cathode interfaces. Over the five-month operation, the CA-MCDC and AA-MCDC systems removed 40.4–47.7% and 38.0–43.3% of the TDS contents in the salt solution, which were more stable than the CC-MCDC with 39.3–51.6%. Based on the adsorption capacity limitation of the ACCs and the increasing resistance during operation, optimization of the structure of MCDCs, such as the dimension and configuration of the desalination chamber, needs to be investigated in the future.Acknowledgements
CF and ZJR appreciate the support from the Office of Naval Research (ONR) under Award N000141310901 and National Science Foundation (NSF) under Award IIP-1445084.References
- D. I. South, Economic Considerations For Supplying Water Through Desalination In South Mediterranean Countries, 2012 Search PubMed.
- T.-X. He and L.-J. Yan, Application of alternative energy integration technology in seawater desalination, Desalination, 2009, 249(1), 104–108 CrossRef CAS PubMed; R. Semiat, Energy Issues in Desalination Processes, Environ. Sci. Technol., 2008, 42(22), 8193–8201 CrossRef.
- E. Mathioulakis, V. Belessiotis and E. Delyannis, Desalination by using alternative energy: Review and state-of-the-art, Desalination, 2007, 203(1), 346–365 CrossRef CAS PubMed.
- S. A. Kalogirou, Seawater desalination using renewable energy sources, Prog. Energy Combust. Sci., 2005, 31(3), 242–281 CrossRef CAS PubMed.
- X. X. Cao, X. Huang, P. Liang, K. Xiao, Y. J. Zhou, X. Y. Zhang and B. E. Logan, A New Method for Water Desalination Using Microbial Desalination Cells, Environ. Sci. Technol., 2009, 43(18), 7148–7152 CrossRef CAS; Y. Kim and B. E. Logan, Microbial desalination cells for energy production and desalination, Desalination, 2013, 308, 122–130 CrossRef PubMed.
- H. Luo, P. E. Jenkins and Z. Ren, Concurrent Desalination and Hydrogen Generation Using Microbial Electrolysis and Desalination Cells, Environ. Sci. Technol., 2011, 45(1), 340–344 CrossRef CAS PubMed.
- H. Luo, P. Xu, T. M. Roane, P. E. Jenkins and Z. Ren, Microbial desalination cells for improved performance in wastewater treatment, electricity production, and desalination, Bioresour. Technol., 2012, 105, 60–66 CrossRef CAS PubMed.
- H. Luo, P. Xu, P. E. Jenkins and Z. Ren, Ionic composition and transport mechanisms in microbial desalination cells, J. Membr. Sci., 2012, 409, 16–23 CrossRef PubMed.
- H. Luo, P. Xu and Z. Ren, Long-term performance and characterization of microbial desalination cells in treating domestic wastewater, Bioresour. Technol., 2012, 120, 187–193 CrossRef CAS PubMed.
- C. Forrestal, P. Xu, P. E. Jenkins and Z. Ren, Microbial desalination cell with capacitive adsorption for ion migration control, Bioresour. Technol., 2012, 120, 332–336 CrossRef CAS PubMed.
- Q. X. Wen, H. Yang, Z. Q. Chen and H. C. Zhang, Microbial Desalination Cell Combined with Capacitive Deionization/Membrane Capacitive Deionization to Desalinate Seawater, Adv. Mater. Res., 2013, 807, 373–379 CrossRef.
- C. Forrestal, P. Xu and Z. Ren, Sustainable desalination using a microbial capacitive desalination cell, Energy Environ. Sci., 2012, 5(5), 7161–7167 CAS.
- C. Forrestal, Z. Stoll, P. Xu and Z. J. Ren, Microbial capacitive desalination for integrated organic matter and salt removal and energy production from unconventional natural gas produced water, Environ. Sci.: Water Res. Technol., 2015, 47–55 Search PubMed.
- Z. A. Stoll, C. Forrestal, Z. J. Ren and P. Xu, Shale gas produced water treatment using innovative microbial capacitive desalination cell, J. Hazard. Mater., 2015, 283, 847–855 CrossRef CAS PubMed.
- S. Cheng, H. Liu and B. E. Logan, Increased performance of single-chamber microbial fuel cells using an improved cathode structure, Electrochem. Commun., 2006, 8(3), 489–494 CrossRef CAS PubMed.
- L. Lu, T. Huggins, S. Jin, Y. Zuo and Z. J. Ren, Microbial Metabolism and Community Structure in Response to Bioelectrochemically Enhanced Remediation of Petroleum Hydrocarbon-Contaminated Soil, Environ. Sci. Technol., 2014, 48(7), 4021–4029 CrossRef CAS PubMed.
- H. Wang, M. Davidson, Y. Zuo and Z. Ren, Recycled tire crumb rubber anodes for sustainable power production in microbial fuel cells, J. Power Sources, 2011, 196(14), 5863–5866 CrossRef CAS PubMed.
- T. Huggins, H. Wang, J. Kearns, P. Jenkins and Z. J. Ren, Biochar as a sustainable electrode material for electricity production in microbial fuel cells, Bioresour. Technol., 2014, 157, 114–119 CrossRef CAS PubMed.
- Z. Ren, R. P. Ramasamy, S. R. Cloud-Owen, H. Yan, M. M. Mench and J. M. Regan, Time-course correlation of biofilm properties and electrochemical performance in single-chamber microbial fuel cells, Bioresour. Technol., 2011, 102(1), 416–421 CrossRef CAS PubMed.
- Y. Oren, Capacitive deionization (CDI) for desalination and water treatment - past, present and future (a review), Desalination, 2008, 228(1–3), 10–29 CrossRef CAS PubMed.
- P. Biesheuvel, S. Porada, M. Levi and M. Z. Bazant, Attractive forces in microporous carbon electrodes for capacitive deionization, J. Solid State Electrochem., 2014, 18(5), 1365–1376 CrossRef CAS.
- R. Zhao, P. M. Biesheuvel and A. van der Wal, Energy consumption and constant current operation in membrane capacitive deionization, Energy Environ. Sci., 2012, 5, 9520–9527 CAS.
| This journal is © The Royal Society of Chemistry 2015 |

