 Open Access Article
Creative Commons Attribution 3.0 Unported Licence
Optimizing the performance of a membrane bio-electrochemical reactor using an anion exchange membrane for wastewater treatment
Jian
Li
and
Zhen
He
*
Department of Civil and Environmental Engineering, Virginia Polytechnic and State University, Blacksburg, VA 24061, USA. E-mail: zhenhe@vt.edu; Tel: +1 (540) 231 1346
First published on 5th March 2015
Abstract
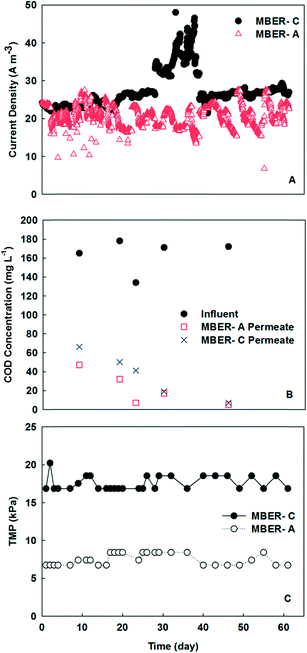
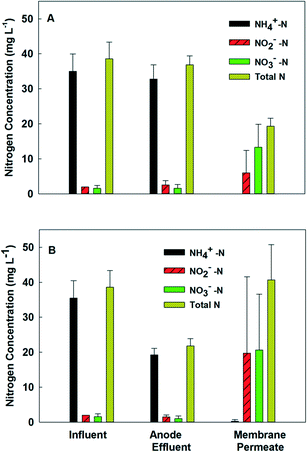
A membrane bioelectrochemical reactor (MBER) is a system integrating ultrafiltration membranes into microbial fuel cells (MFCs) for energy-efficient wastewater treatment. To improve nitrogen removal, an MBER based on an anion exchange membrane (AEM), the MBER-A, was investigated for treating synthetic solution or actual wastewater during a 200-day operation. The MBER-A significantly improved the removal of total nitrogen to 56.9% with the synthetic solution, compared with 7.6% achieved in the MBER containing a cation exchange membrane (MBER-C). This was mainly due to the removal of nitrate through both nitrate migration across AEM and heterotrophic denitrification in the anode. The final filtrate from MBER-A contains 11.9 mg L−1 nitrate-nitrogen, 6.0 mg L−1 nitrite-nitrogen, and less than 1 mg L−1 ammonia-nitrogen. The MBER-A achieved 91.3 ± 6.4% of COD removal, resulting in a COD concentration of 21.6 ± 17.8 mg L−1 in its membrane filtrate. The transmembrane pressure (TMP) remained below 10 kPa when being operated with synthetic solution. The actual wastewater (primary effluent) led to the decrease in both COD and nitrogen removal, likely due to complex composition of organic compounds and low electricity generation. The MBER-A decreased the COD concentration by 84.5 ± 14.4% and total nitrogen concentration by 48.4 ± 1.9%. The ammonia-nitrogen concentration remained at 0.3 mg L−1 in the final filtrate. The energy consumption by the MBER-A could be significantly decreased through reducing the strength of the anolyte recirculation rate. Those results encourage further investigation and development of the MBER technology for energy efficient removal of organic and nitrogen compounds from wastewater.
Water impactMembrane bioreactors (MBRs) are promising technologies for wastewater treatment; however, the high energy requirement and the lack of nutrient removal have become key challenges in applying MBRs. This work attempts to address the above problems through developing a new technology based on the synergy between bioelectrochemical systems and MBRs. The developed membrane bioelectrochemical reactor (MBER) is able to achieve energy-efficient wastewater treatment with simultaneous nitrogen removal. The use of an anion exchange membrane significantly improves the reduction of total inorganic nitrogen via anion movement (driven by bioelectricity) and heterotrophic denitrification. The results encourage the integration of membrane technology into bioelectrochemical systems, towards an energy-efficient approach for sustainable wastewater treatment. |
1. Introduction
There has been a great demand for sustainable wastewater treatment because of increased energy expense and high water quality for direct discharge or reuse. In general, sustainable wastewater treatment requires minimal input of energy and resource for treatment and maximal recovery of valuable resources such as energy and high-quality water, thereby decreasing carbon and water footprint of the treatment process. Those tasks can be accomplished through either optimizing the existing treatment systems or developing new technologies. Among the new technologies/concepts, membrane bioreactors (MBRs) and bioelectrochemical systems (BESs) are of strong interest because of their advantages in producing high-quality water and energy efficient treatment. MBRs use ultra/micro-filtration membranes to achieve separation of water and biomass, eliminating the sedimentation processes; BES takes advantages of microbial interaction with a solid electron acceptor/donor to achieve the production of bioelectricity from organic contaminants. More details about MBR or BES can be found in various review publications.1–4 Research found that there is a strong synergy between MBR and BES, and proper integration of the two can complement each other by achieving low energy treatment and high-quality effluent.Several efforts have been made to integrate membrane modules with BES to form a new treatment technology. The early studies used a biofilm attached on stainless steel mesh as a filter material to achieve low effluent turbidity and high removal of both organic compounds and ammonia.5,6 Theoretical analysis indicated that such a system with biofilm-membranes could recover net energy from wastewater.7 The commercially available ultra-filtration hollow fiber membranes were installed in the anode chamber of a microbial fuel cell (MFC) system to form a membrane bioelectrochemical reactor (MBER).8 It was found that hollow fiber membranes can be rapidly fouled in the presence of a large amount of microorganisms, and to alleviate fouling issues, fluidized granular activated carbon (GAC) was applied to the anode of the MBER.9 However, having hollow fiber membranes in the anode created challenges for membrane cleaning; to solve this problem, the MBER was modified with hollow fiber membranes installed in its cathode chamber with aeration.10 The linkage between MBR and BES was also accomplished through external connection, for example, a two stage MFC-anaerobic fluidized bed MBR (MFC-AFMBR) was demonstrated to produce high quality effluent using AFMBR as a post treatment process of the MFC.11
The integrated MBR-BES system can achieve good removal of organic contaminants with low energy consumption. However, because of its anaerobic characteristic, nitrogen removal has not been well addressed in an anaerobic MBR.12 BES, on the other hand, can accomplish the removal of nitrogen through multiple approaches, including ammonia recovery, bioelectrochemical denitrification and/or heterotrophic denitrification.13 A suitable design of the integrated system may accomplish the removal of nitrogen with the help of aeration. In this study, an MBER containing an anion exchange membrane (AEM) as a separator between the anode and the cathode was developed and investigated for enhancing nitrogen removal (Fig. 1). The hypothesized path of nitrogen compounds in this system is that ammonium remains in the effluent of the anode after the organic compounds are greatly reduced and the electrons are generated; the anode effluent is then transported with wastewater flow (driven by the same feeding pump that supplies the anode influent) to the cathode as a catholyte, where aeration is provided to convert ammonium into nitrate via nitrification; in the presence of AEM and driven by electricity generation, nitrate ions move back to the anode across the AEM and are reduced to nitrogen gas with organic compounds as electron donors via heterotrophic denitrification. The direction of wastewater flow must be from the anode (anaerobic) into the cathode (aerobic) to maintain a good separation of two different environments; backflow of the catholyte into the anode is not preferred, because it will bring dissolved oxygen into the anode (damaging the anode reaction) and there will be insufficient organic compounds for conducting denitrification.
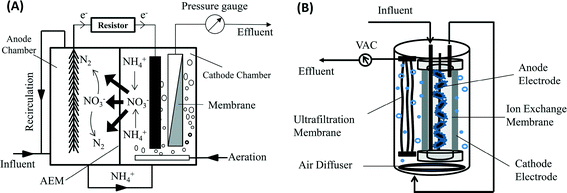 | ||
| Fig. 1 Schematic of an AEM-membrane bioelectrochemical reactor: (A) general schematic showing nitrogen transformation; and (B) tubular configuration used in this study. AEM – Anion Exchange Membrane. | ||
To examine this hypothesis, a tubular MBER was built with AEM and compared with the one containing a cation exchange membrane (CEM). The specific objectives of this study include: (1) to examine whether the removal of inorganic nitrogen can be enhanced with the use of AEM in the MBER fed with either synthetic or municipal wastewater; (2) to investigate the membrane fouling and the removal of organic compounds with either synthetic or actual municipal wastewater under different operation modes; and (3) to analyze energy consumption of the MBER system treating wastewater.
2. Materials and methods
2.1 MBER setup
The proposed MBER system was constructed as a tubular reactor (38 cm long and 5 cm in diameter) made of an anion exchange membrane (AEM-Ultrex AMI 7001, Membranes International. Inc, Glen Rock, New Jersey, USA). A carbon brush was installed in the anodic chamber as an anode electrode, resulting in an anode liquid volume of 750 mL. Before use, the carbon brush was soaked in acetone solution overnight and then heated for 30 min at 450 °C.14 The cathode electrode was one piece of carbon cloth (Zoltek Corporation, St. Louis, MO, USA) coated with Pt/C powder (10% Etek, Somerset, NJ, USA) with loading rate 0.2 mg of Pt per cm2. The cathode electrode wrapped the membrane tube. The MBER was put in a 2 L container that acted as a cathode compartment, and the aeration with air was supplied from the bottom of the container. Thirteen 35 cm PVDF hollow fiber membranes (15![[thin space (1/6-em)]](https://www.rsc.org/images/entities/char_2009.gif) 000 Dalton, Litree Purifying Technology Co., China) were glued by epoxy as a bundle and installed in the cathode compartment. The anode and cathode electrodes were connected by using titanium wire to an external resistor. As a control, an identical MBER was constructed with cation exchange membrane (CEM-Ultrex CMI 7000, Membranes International Inc. Glen Rock, NJ, USA). Two MBER systems were recognized as the MBER-A (AEM) and the MBER-C (CEM), and operated in parallel.
000 Dalton, Litree Purifying Technology Co., China) were glued by epoxy as a bundle and installed in the cathode compartment. The anode and cathode electrodes were connected by using titanium wire to an external resistor. As a control, an identical MBER was constructed with cation exchange membrane (CEM-Ultrex CMI 7000, Membranes International Inc. Glen Rock, NJ, USA). Two MBER systems were recognized as the MBER-A (AEM) and the MBER-C (CEM), and operated in parallel.
2.2 Operating conditions
The MBER anodes were inoculated with anaerobic sludge from Pepper's Ferry Wastewater Treatment Plant (Radford, VA, USA) and were operated at room temperature. The synthetic solution contains (per L of tap water): sodium acetate 0.2 g; NH4Cl 0.15 g; NaCl 0.5 g; MgSO4 0.015 g; CaCl2 0.02 g; KH2PO4 0.53 g; K2HPO4 1.07 g and 1 mL trace elements.15 Municipal wastewater used in this study was the effluent from the primary clarifier at Pepper's Ferry. The anolyte was recirculated at 250 mL min−1 unless otherwise noted, and there was no recirculation applied to the catholyte. The MBER was operated in continuous flow mode with a hydraulic full loop, in which wastewater was first fed into the anode compartment and then the anode effluent flowed into the cathode compartment. The final permeate was extracted from the hollow fiber membranes. The flow rate was controlled by peristaltic pumps to achieve the desired hydraulic retention time (HRT).2.3 Measurements and analysis
The voltage was recorded every 5 min by a digital multimeter (2700, Keithley Instruments, Cleveland, OH). The current and power density was normalized to the anode liquid volume. The pH was measured using a benchtop pH meter (Oakton Instruments, Vernon Hills, IL, USA). The conductivity was measured by a benchtop conductivity meter (Mettler-Toledo, Columbus, OH, USA). The concentrations of chemical oxygen demand (COD), ammonium, nitrite and nitrate were measured according to the manufacturer's procedure (Hach DR/890, Hach Company, Loveland, CO, USA). Transmembrane pressure (TMP) was recorded manually and the average value was reported in this study. Turbidity was measured using a turbidimeter (DRT 100B, HF Scientific, Inc, Fort Myers, FL, USA). The comparison between the data was conducted by using the two-sample t-test. Energy consumption by the MBER came from two parts, pumping system and aeration. The estimation of energy consumption by the pumping system (for feeding, recirculating and membrane extraction) was calculated by the following equation:16where P is power requirement (kW), Q is flowrate (m3 s−1), γ is 9800 (N m−3) and E is head loss (m H2O). The energy by aeration was estimated according to a previous study.17 The data for energy consumption were expressed based on the volume of treated wastewater (kWh m−3), the removed organics (kWh per kg of COD),18 and the removed nitrogen (kWh per kg of N).
3. Results and discussions
3.1 MBER fed with synthetic solution
3.2 MBER fed with primary effluent (actual wastewater)
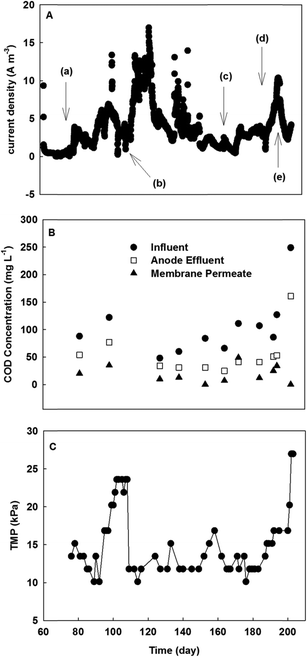
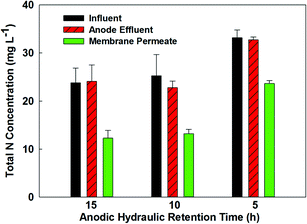
Because the MBER-A demonstrated superior performance in improved nitrogen removal, the following sections report the performance of the MBER-A only fed with actual wastewater (primary effluent) from day 62 to 200.The removal efficiency of total inorganic nitrogen also became lower with actual wastewater, although the ammonia-nitrogen concentration remained low at 1.0 mg L−1 in the membrane filtrate. The decreased removal efficiency of total inorganic nitrogen was mainly due to the accumulation of nitrate. At HRT 6 h, the concentrations of nitrate- and nitrite-nitrogen in the membrane filtrate were 15.2 and 2.0 mg L−1, respectively. Increasing HRT to 15 h improved the removal of nitrate and decreased its final concentration to 10.0 mg L−1. On the other hand, decreasing HRT to 10 and 5 h reduced the total nitrogen removal rate, resulting in the final total nitrate-nitrogen concentrations of 11.5 and 22.0 mg L−1 (Fig. 5). Low current generation was a major factor that decreased migration of nitrate ions from the cathode into the anode, and thus less nitrate ions were removed via heterotrophic denitrification in the anode.
3.3 Energy consumption
Energy consumption is a key parameter to evaluate the MBER system. When the MBER-A was fed with the synthetic solution, it was estimated that the system would consume 0.12 kWh to treat 1 m3 of wastewater (or 0.86 kWh energy to remove 1 kg COD), lower than 0.6 kWh m−3 by a typical activated sludge process.20 Further analysis shows that anolyte recirculation was the major consumer with 55% of total energy consumption used to drive the recirculation pump. The remaining energy consumption was mostly by aeration in the cathode; and the energy requirement by feeding and extracting water was very minor. The MBER-A produced 0.03 kWh m−3 or 0.20 kWh per kg of COD energy from synthetic solution. The final energy balance (considering both energy consumption and production) showed that the MBER-A would consume 0.09 kWh m−3 or 0.66 kWh per kg of COD. For each kg of total nitrogen removed, the MBER-A would consume 4.40 kWh.To further understand the effect of the anolyte recirculation on energy consumption, we have investigated the energy requirement of the MBER-A at three different recirculation rates, 50, 150, and 250 mL min−1; the external resistance was fixed at 1 ohm, the HRT was 5 h for those tests, and actual wastewater was used as an anode substrate. The use of 1 ohm was because that with actual wastewater, the energy production was very low (0.05 kWh kg of COD at 150 ohm, which was close to the internal resistance of the MBER). The results clearly show that a lower recirculation rate would result in much less energy consumption. The total energy consumption at 50 mL min−1 was 0.02 kWh m−3 or 0.25 kWh per kg of COD, less than 40% of the ones at 250 mL min−1 (0.05 kWh m−3 or 0.57 kWh per kg of COD) (Fig. 6). The energy demand for nitrogen removal was 3.0 kWh per kg of N at 50 mL min−1, much lower than 12.6 kWh per kg of N at 250 mL min−1. Varying the anolyte recirculation rate did not significantly affect the anode COD removal efficiency, which was 41.6 ± 25.3% at 50 mL min−1 or 39.9 ± 7.5% at 250 mL min−1; in addition, the total nitrogen concentration in the final membrane filtrate was 21.9 mg L−1 at 50 mL min−1 or 19.5 mg L−1 at 250 mL min−1. Those results of contaminant removal and energy consumption at different anolyte recirculation rates suggest that the energy consumption by the MBER could be decreased by optimizing the operating conditions without negative influence on the treatment performance.
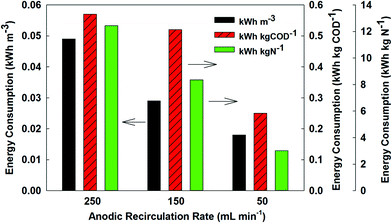 | ||
| Fig. 6 Energy consumption by the MBER-A per volume of wastewater treated, per kg of COD removed, or per kg of nitrogen removed at different anolyte recirculation rates. | ||
3.4 Perspectives on the MBER technology
The developed MBER possesses certain advantages compared with the existing technologies. Its energy consumption is much lower than MBRs. Unlike MBRs, MBER is an integrated system to combine the anaerobic process in the anode chamber and the aerobic process in the cathode chamber. With anaerobic treatment, the organic input to the aerobic process (the cathode) is low, resulting in less requirement of aeration energy, low production of aerobic sludge, and low membrane fouling. However, compared with AnMBRs, the MBERs do not have obvious energy advantage, because of much lower energy recovery (although AnMBRs also have significant challenges in recovering methane that is largely dissolved in the membrane filtrate21). The main advantage of the MBERs lies in nitrogen removal through integrated aerobic and anaerobic processes involving electricity generation. In addition, the MBERs can be operated at lower temperature than AnMBRs, thereby saving a large amount of energy associated with heating.There are some challenges that must be addressed in future development of the MBER technology. First, nitrogen removal efficiency needs to be further improved; because nitrate removal is the bottleneck of the total nitrogen removal, nitrate migration across the AEM or bioelectrochemical denitrification in the cathode should be further investigated. One possible approach for promoting nitrate migration is to apply a small external voltage to increase current generation.22 Second, the energy consumption needs to be minimized by controlling aeration intensity and electrolyte recirculation, with simultaneous evaluation of the effects of those control strategies on the MBER performance (e.g., removal of contaminants and membrane fouling). Third, a strategy for a system scale up should be developed to transform laboratory results into a practical technology.
4. Conclusions
This study has demonstrated the improved removal of total nitrogen by using an anion exchange membrane in a membrane bioelectrochemical reactor. The present design promoted nitrate migration/removal, and maintained a low membrane fouling due to the removal of organic compounds in the anode. The MBER system effectively removed organic and nitrogen compounds from both synthetic solution and actual wastewater (primary effluent). Energy consumption could be reduced by decreasing the intensity of the anolyte recirculation. Further investigation needs to further improve nitrate removal, decrease energy consumption, and develop an appropriate strategy for a system scale up.Acknowledgements
The authors would like to thank Litree Purifying Technology (China) for donating hollow fiber membranes, Pepper's Perry Wastewater Treatment Plant for providing wastewater samples, Zheng Ge (Virginia Tech) for his help with experiments, and anonymous reviewers for their helpful comments. This research was financially supported by a grant from the National Science Foundation (#1358145).References
- S. Judd, The status of membrane bioreactor technology, Trends Biotechnol., 2008, 26(2), 109–116 CrossRef CAS PubMed.
- F. Meng, S.-R. Chae, A. Drews, M. Kraume, H.-S. Shin and F. Yang, Recent advances in membrane bioreactors (MBRs): membrane fouling and membrane material, Water Res., 2009, 43(6), 1489–1512 CrossRef CAS PubMed.
- B. E. Logan, B. Hamelers, R. Rozendal, U. Schröder, J. Keller, S. Freguia, P. Aelterman, W. Verstraete and K. Rabaey, Microbial Fuel Cells:
![[thin space (1/6-em)]](https://www.rsc.org/images/entities/char_2009.gif) Methodology and Technology, Environ. Sci. Technol., 2006, 40(17), 5181–5192 CrossRef CAS.
Methodology and Technology, Environ. Sci. Technol., 2006, 40(17), 5181–5192 CrossRef CAS. - W. W. Li, H. Q. Yu and Z. He, Towards sustainable wastewater treatment by using microbial fuel cells-centered technologies, Energy Environ. Sci., 2014, 7(3), 911–924 CAS.
- Y. K. Wang, G. P. Sheng, W. W. Li, Y. X. Huang, Y. Y. Yu, R. J. Zeng and H. Q. Yu, Development of a Novel Bioelectrochemical Membrane Reactor for Wastewater Treatment, Environ. Sci. Technol., 2011, 45(21), 9256–9261 CrossRef CAS PubMed.
- Y. P. Wang, X. W. Liu, W. W. Li, F. Li, Y. K. Wang, G. P. Sheng, R. J. Zeng and H. Q. Yu, A microbial fuel cell–membrane bioreactor integrated system for cost-effective wastewater treatment, Appl. Energy, 2012, 98, 230–235 CrossRef CAS.
- Y. K. Wang, G. P. Sheng, B. J. Shi, W. W. Li and H. Q. Yu, A novel electrochemical membrane bioreactor as a potential net energy producer for sustainable wastewater treatment, Sci. Rep., 2013, 3(1864), 1–6 CAS.
- Z. Ge, Q. Ping and Z. He, Hollow-fiber membrane bioelectrochemical reactor for domestic wastewater treatment, J. Chem. Technol. Biotechnol., 2013, 88(8), 1584–1590 CrossRef CAS.
- J. Li, Z. Ge and Z. He, A fluidized bed membrane bioelectrochemical reactor for energy-efficient wastewater treatment, Bioresour. Technol., 2014, 167, 310–315 CrossRef CAS PubMed.
- J. Li, Z. Ge and Z. He, Advancing membrane bioelectrochemical reactor (MBER) with hollow-fiber membranes installed in the cathode compartment, J. Chem. Technol. Biotechnol., 2014, 89(9), 1330–1336 CrossRef CAS.
- L. J. Ren, Y. T. Ahn and B. E. Logan, A Two-Stage Microbial Fuel Cell and Anaerobic Fluidized Bed Membrane Bioreactor (MFC-AFMBR) System for Effective Domestic Wastewater Treatment, Environ. Sci. Technol., 2014, 48(7), 4199–4206 CrossRef CAS PubMed.
- A. L. Smith, L. B. Stadler, N. G. Love, S. J. Skerlos and L. Raskin, Perspectives on anaerobic membrane bioreactor treatment of domestic wastewater: A critical review, Bioresour. Technol., 2012, 122, 149–159 CrossRef CAS PubMed.
- P. T. Kelly and Z. He, Nutrients removal and recovery in bioelectrochemical systems: A review, Bioresour. Technol., 2014, 153, 351–360 CrossRef CAS PubMed.
- X. Wang, S. Cheng, Y. Feng, M. D. Merrill, T. Saito and B. E. Logan, Use of carbon mesh anodes and the effect of different pretreatment methods on power production in microbial fuel cells, Environ. Sci. Technol., 2009, 43(17), 6870–6874 CrossRef CAS.
- Z. He, N. Wagner, S. D. Minteer and L. T. Angenent, An upflow microbial fuel cell with an interior cathode: Assessment of the internal resistance by impedance Spectroscopy, Environ. Sci. Technol., 2006, 40(17), 5212–5217 CrossRef CAS.
- J. Kim, K. Kim, H. Ye, E. Lee, C. Shin, P. L. McCarty and J. Bae, Anaerobic Fluidized Bed Membrane Bioreactor for Wastewater Treatment, Environ. Sci. Technol., 2011, 45(2), 576–581 CrossRef CAS PubMed.
- F. Zhang, Z. Ge, J. Grimaud, J. Hurst and Z. He, Improving electricity production in tubular microbial fuel cells through optimizing the anolyte flow with spiral spacers, Bioresour. Technol., 2013, 134, 251–256 CrossRef CAS PubMed.
- L. Xiao, Z. Ge, P. Kelly, F. Zhang and Z. He, Evaluation of normalized energy recovery (NER) in microbial fuel cells affected by reactor dimensions and substrates, Bioresour. Technol., 2014, 157(0), 77–83 CrossRef CAS PubMed.
- E. Zuriaga-Agustí, A. Bes-Piá, J. A. Mendoza-Roca and J. L. Alonso-Molina, Influence of extraction methods on proteins and carbohydrates analysis from MBR activated sludge flocs in view of improving EPS determination, Sep. Purif. Technol., 2013, 112(0), 1–10 CrossRef PubMed.
- P. L. McCarty, J. Bae and J. Kim, Domestic wastewater treatment as a net energy producer–can this be achieved?, Environ. Sci. Technol., 2011, 45(17), 7100–7106 CrossRef CAS PubMed.
- Z. H. Liu, H. Yin, Z. Dang and Y. Liu, Dissolved Methane: A Hurdle for Anaerobic Treatment of Municipal Wastewater, Environ. Sci. Technol., 2013, 48(2), 889–890 CrossRef PubMed.
- Z. Ge, C. G. Dosoretz and Z. He, Effects of number of cell pairs on the performance of microbial desalination cells, Desalination, 2014, 341(0), 101–106 CrossRef CAS PubMed.
| This journal is © The Royal Society of Chemistry 2015 |


