
Measuring poly(acrylamide) flocculants in fresh water using inter-polymer complex formation†
Thomas
Swift
 a,
Linda
Swanson
a,
Andrew
Bretherick
b and
Stephen
Rimmer
*a
a,
Linda
Swanson
a,
Andrew
Bretherick
b and
Stephen
Rimmer
*a
aPolymer and Biomaterials Chemistry Laboratories, Department of Chemistry, Brook Hill, University of Sheffield, Sheffield, South Yorkshire S3 7HD, UK. E-mail: s.rimmer@sheffield.ac.uk; Fax: +44 (0)114 222 9346
bSNF (UK) Ltd, Solutions House, Ripley Close, Normanton WF6 1TB, West Yorkshire
First published on 20th February 2015
Abstract
A novel detection method for poly(acrylamide) flocculants was developed using interpolymer complexation between flocculants and a probe (poly(acrylic acid-co-acenaphthylene)). This detection method was tested in fresh water situations and found to be robust against a range of contaminants; additionally it was capable of detecting levels of flocculant dosing below 1 mg l−1. This method is remarkably fast and requires little sample modification compared to existing methods of detection.
Water impactThe lack of clear evidence surrounding the environmental leakage of poly(acrylamide) flocculants to the environment is resulting in confusing guidelines surrounding their use. The key barrier to their use is lack of a suitable detection mechanisms in freshwater situations. We have outlined the use of a detection method which can sense ppm concentrations of these polymers and shown it is suitable for examining flocculated wastewater streams in even highly contaminated wastewater. This sensoring technique could be used by a range of flocculant users to prove to regulators there is no environmental release of their product. The main advantage of this mechanism over historical work is that no chemical modification of the flocculant is required to detect. |
Introduction
There is no standard method for detecting dilute polyacrylamide in fresh water due to the multiple challenges inherent in gaining the required sensitivity necessary to distinguish the hydrophilic polymer against the multitude of other environmental impurities possible within such a sample. This is an issue because for many decades high molecular weight polyacrylamide has been used in the treatment of wastewater and many other purification processes.1 In the EU alone approximately 50![[thin space (1/6-em)]](https://www.rsc.org/images/entities/char_2009.gif) 000 tonnes of poly(acrylamide) are used per annum for effluent treatment, and the polymer also finds commercial uses in paper, pulp, mineral and crude oil processing, coating applications and soil/sand treatment.2 Due to its high usage, concerns regarding the release of the free monomer acrylamide (known to be highly toxic3) and concerns over the toxicity of anionic/cationic polymers to aquatic lifeforms,4–6 researchers have long been attempting to find new methods to determine the fate of the polymer after use.7–16 In practice the intrinsic toxicity of the polymer released to the environment is reduced by many factors17,18 so whilst these polyelectrolytes are not a priority for environmental control, our inability to trace these synthetic polymers and determine their spread through surface waters is a severe limiting factor to their future use. For this reason the UK Environment agency recommends a case specific approach for their approval.19
000 tonnes of poly(acrylamide) are used per annum for effluent treatment, and the polymer also finds commercial uses in paper, pulp, mineral and crude oil processing, coating applications and soil/sand treatment.2 Due to its high usage, concerns regarding the release of the free monomer acrylamide (known to be highly toxic3) and concerns over the toxicity of anionic/cationic polymers to aquatic lifeforms,4–6 researchers have long been attempting to find new methods to determine the fate of the polymer after use.7–16 In practice the intrinsic toxicity of the polymer released to the environment is reduced by many factors17,18 so whilst these polyelectrolytes are not a priority for environmental control, our inability to trace these synthetic polymers and determine their spread through surface waters is a severe limiting factor to their future use. For this reason the UK Environment agency recommends a case specific approach for their approval.19
Anionic and cationic polymer variants of copolymers of acrylamide are used in the flocculation of waste effluent.20 The polymers are added to wastewater to improve the settling and the subsequent removal of suspended particles, either by direct flocculation or by neutralising the suspended particles surface charge.18,21 Both polymers are toxic at very low concentrations to aquatic lifeforms,5 and whilst it is accepted that the cationic variant of the polymer is substantially more toxic than the anionic polymer both present a risk to the aquatic fauna.22
In a previous paper we demonstrated a technique to detect the formation of interpolymer complexes (IPC) between polyacrylamide (PAM) and poly(acrylic acid-co-acenaphthylene) (P(AA-co-ACE)) (henceforth referred to simply as a PAA probe) using time-resolved fluorescence anisotropy measurements (TRAMS) of the covalently bound fluorescent marker acenapthylene (ACE).23 Due to the formation of interpolymer complexes between the two polymer chains in acidic solutions, the segmental mobility of the polymer probe, and consequently the ACE molecules along the polymer chain, was restricted. This results in a dramatic increase in the correlation time (τc) of the fluorophore. Usually the correlation time of the PAA probe in acidic media will be 6 nanoseconds.24 However in the presence of polyacrylamide the correlation time was documented to rise as high as 180 nanoseconds because of the severe restriction on rotation due to formation of an IPC. It was suggested that this complex formation could form the basis of a method of detection of polyacrylamide as it was seen that the increase in correlation time rose almost linearly with sample concentration.
This is a relatively simple analytical procedure to acquire, despite the complex mathematics involved in determining the correlation time. It is an important advancement in the field as no standardised method has been adopted for directly determining trace concentrations of the polymer in water, despite interest from many government agencies.2,25 Though there are many methods that have been proposed to determine the concentration of polyacrylamide in solution, until recently, most methods suffered the drawback of being very involved. They required several preparation steps that would not be suitable for large scale industrial testing. A key issue in many of these methods is ensuring that dissolved organic matter does not interfere in the measurement, an issue that only recent advances in the sensitivity of the detectors have begun to overcome.16,26
Turbidometric analysis is possible if the polyacrylamide is hydrolysed with a quaternary ammonium cation.14 However to achieve detection at low concentrations it is necessary to pass the solution through a cation exchange resin following alkaline hydrolysis, which is then evaporated and subsequently collected in order to reveal concentrations lower than 1 mg l−1.13 This methodology has been automated to give accurate concentrations as low as 5 mg l−1, although the process can be affected by anions (such as alkylbenzene sulfonates and large fatty acids)27 and it is not suitable for non-anionic forms of acrylamide without additional precipitation by tannic acid.9 With all of these steps in place turbidometric measuring techniques were found to be accurate and reproducible to 1% at concentrations as low as 0.1 mg l−1. Additionally these techniques have often been found to have varying effectiveness depending on the charge density of the polyacrylamide flocculant.16
Spectrophotometrically it is possible to test a solution for amide and nitrile functionalities on the polymers.28 However, the methods highlighted the requirement for high temperature fusion with a highly concentrated alkali, liberating the nitrogen as either ammonia or an organic amine, and the analysis of each sample took over half an hour. Oxidation of the amide functional groups with bromine can produce an iodide ion which can be detected after the excess bromine is removed.11 This method is both sensitive, accurate and more rapid than its predecessors but still requires modification of the polymer prior to examination; further modifications are required to allow it to work in the presence of high chloride ion concentrations.29 In some heterogeneous samples it is necessary to separate the polymer from any other dissolved organic matter by size exclusion chromatography to improve accuracy of measurements, and by doing this a linear response is possible from 0.2 mg l−1.12 Alternatively irrigation water has been mixed with kaolin clay, and the suspended settling of flocculated suspensions can be used to measure concentrations low as 10 mg l−1.7 More modern detectors have improved accuracy yet still wastewater from sludge dewatering required centrifugation. With recent advancements an in line system was able to detect concentrations down to 1.3 mg l−1.26
Size exclusion chromatography is capable of detecting a denitro derivative formed via a Sanger's Reagent reaction with hydrolysed poly(acrylamide).10 However low concentration samples require concentrating under a nitrogen stream and so this is not suitable for large scale aqueous testing. Finally cationic dyes have also been shown to give a reasonable response to poly(acrylamide) in solutions as low as 4 mg l−1.18
For detecting the environmental spread of polyelectrolytes a common practice is to modify samples with a fluorescence marker.30 By incorporating a fluorescent tag into the polymer itself before its intended process (be it flocculation, grouting, suspension, etc.) simple search methods are employed, intending to detect the enclosed tag as opposed to the original polymer. This method is by nature expensive, it requires a modification of the engineering process which may be affected by the presence of the tag even at low concentrations. In contrast however a new method utilising complexation of a targeted analyte with fluorescent polymer probes requires no prior modification to the flocculant and could be carried out in any waterborne application provided the medium is translucent enough to permit the passage of light. This paper shows this method being transferred from the laboratory bench and it has been used on a range of fresh water samples of varying quality with the goal of demonstrating the applicability of this novel technique as a detection method for the spread of poly(acrylamide) in the environment.
Experimental
Materials and methods
The probe polymer was synthesised via free radical synthesis following the method outlined in our previous paper.23 Acrylic acid was mixed with 4,4′-azobis(4-cyanovaleric acid) and acenapthylene were dissolved in dioxane and heated to 60 °C in a degassed ampoule. Polymers were purified by repeated precipitation in diethyl ether and characterised by 1H NMR in D2O: (δ 2.35 (m CH) m (δ 1.75 CH2)).A range of non-ionic (FloPam FAXXX), anionic (FloPam ANXXX) and cationic (FloPam FOXXX) polyacrylamide flocculants were supplied by SNF.UK. A full list of SNF produced flocculants used in this study are attached in ESI.† All were stored dry and mixed for 3 hours stirring at 100 rpm prior to addition to samples. Most research was carried out on ultrapure water purified at the University of Sheffield Chemistry department, however work was also carried out on tap water from the department (sampled 24/02/2012) and sea water collected from Holes Bay, Poole Harbour, on the 03/07/2013. Three flocculations were carried out on fresh water samples. Y1, a sample of reservoir water pre-treatment, was collected on the 15/03/2012 (pH 7.00, raw turbidity 3.06 NTU). Y2, a sample of fresh water from a second reservoir, was collected on the 18/09/2012 (pH 7.01, raw turbidity 2.61). Soil Aggregates, SA, were delivered to the University of Sheffield on 4/04/2013. 200 g of the soil samples were filtered for stones into 10 litres of water (pH 4.69 and raw turbidity 15.35 NTU). Turbidity was measured on a Model 2100 P150 Portable turbidimeter, with a range of 0–1000 FNU and an accuracy of 2% of reading + 0.04 FNU. Floc size was estimated via visual comparison of sample to an industry standard reference chart supplied by SNF (UK) Ltd (see ESI†). Floc sizes were assigned into discrete ranges on the comparator and the variation in size of each size category is known. Inductively coupled mass spectroscopy (ICP) was carried out by acidifying samples with nitric acid and running down a Spectro Cirus Vision ICP Optical Emission Spectrograph giving results of mg l−1.
The detection method was tested in three environmentally sourced water samples. These three water sources were also analysed via ICP to reveal the elemental composition of all impurities in the water supply, in comparison with ultra-pure, deionised, tap and sea water (see ESI†).
Fluorescence measurements
Time resolved anisotropy measurements were recorded using an Edinburgh Instruments 199 Fluorescence Spectrometer at an excitation wavelength of 295 nm and the emission wavelength of 340 nm. Measurements were made across a 200 nanosecond time period broken into 512 channels. The profile of the laser beam was monitored using a silica prompt to scatter light at the excitation wavelength. All solutions were examined in quartz cuvettes with a path length of 10 mm (Fig. 1) and then the emitted light was passed through a polariser that rotated between two 90° angles every 30 seconds. | ||
| Fig. 1 Schematic diagram for measurement of fluorescence anisotropy. | ||
The extent of the difference between polarisations is described in terms of anisotropy (r), which arises from the relative intensities of the parallel (III) and crossed (I⊥) polarised emissions.

The change in the instrumentally measured anisotropy function, r(t), over time is then fitted to two scaling factors (A and B) and two correlation time components (τc1 and τc2). The fit (example given in Fig. 2) is carried out using Horiba Scientific Software Datastation using the following equation:
| r(t) = A exp(−t/τc1) + B exp(−t/τc2) |
 | ||
| Fig. 2 Anisotropy profile and best fit of uncomplexed (black) and complexed (dashed grey) probe solutions from Fig. 3, with accompanying residuals (std deviation of fit). | ||
From this equation the final correlation time, τc, is determined by the equation

This process is nearly automated requiring user input only to judge the quality of the fit of the decay, observable both by eye and indicated by the residual std. deviations and a χ2 quality of fit. For automation purposes both A and τc1 have been fixed to constant values to represent the uncomplexed probe polymer so B and τc2 are left variable to represent the contributions from complexing species.23 Error bars are given as the variability (standard deviation) of the single measurement gathered from at least 20000 data points. Full analytical details are contained within the ESI.†
Results and discussion
Testing FloPam polymers
The complexation between PAA and PAM demonstrated in our previous report used specifically synthesised polymers created within the laboratory.23 These polymers are much smaller than the commercial grades used in real world applications where large molar mass polymers are utilised for increased flocculation efficiency.31 Industrial flocculants are known to have extremely high molecular weights and contain a variety of copolymer blends designed to maximise the efficiency of the system. A full list of polymers supplied by SNF (UK ) Ltd used in this paper is provided in the ESI.†Non-ionic, anionic and cationic FloPam SNF (UK) LTD polymers
Mixtures were prepared of SNF (UK) LTD polymers FloPam FA920 (non-ionic), FloPam AN934 BPM (anionic – containing a sodium acrylate comonomer) and FloPam F04650 MPM (cationic – containing a dimethylaminoethyl methacrylate comonomer) at various pH values with the probe PAA (0.3 mg ml−1) (Fig. 2). The non-ionic FloPam FA920 binds to the probe below the critical pH (pHcrit) of 3.5 as demonstrated by the rise in correlation time. The anionic FloPam AN934 has a much lower pHcrit of 2.5 and the observed correlation time only rises to a maximum of 60 ns, suggesting that the anionic component of the polymer is weakening IPC formation. The cationic polymer FloPam FO4650 behaves differently, complexing in the pH range 2 to 5 and demonstrating no response below or above this region. This is likely due to electrostatic interaction between these two polymers as opposed to hydrogen bonding, and the attraction appears to have greater strength as the observed correlation time is nearly double that observed between the probe and the non-ionic polymer. At low pH there is no evidence of hydrogen bonding between the probe and the polymer, however whether this incapacity to hydrogen bond is due to reversible hydrolysis of the PAM or competition from bulky cationic groups on the polymer chain cannot be inferred from this result. | ||
| Fig. 3 Correlation time of probe polymer mixed 1:1 (1 mg ml−1) with FloPam polymers. Non-ionic FloPam FA920 black diamonds, anionic FloPam AN934BPM clear diamonds and cationic FloPam FO4650 MPM grey diamonds. Error bars represent standard deviations of fit. | ||
Concentration detectors
The sensitivity of this detection system can be modified by altering the concentration of probe polymer. A series of measurements were made with the concentration of PAA-ACE fixed at both 70 and 700 mg l−1, the pH adjusted to 2 and the concentration of FloPam FA920 was varied from 0 to 200 mg l−1 (Fig. 4). At 700 mg l−1 the probe polymer is sensitive down to 100 mg l−1 FloPam FA920 before the correlation time dropped below 100 nanoseconds. At 70 mg l−1 the probe was sensitive to 10 mg l−1 before the observed correlation time dropped. At pH 4 no interaction between 700 mg l−1 probe and the FloPam FA920 is visible. | ||
| Fig. 4 Correlation time of probe polymer with FloPam FA920 with 70 mg l−1 probe (black diamonds), 700 mg l−1 probe (clear diamonds) at pH 2 and 700 mg l−1 probe at pH 4. | ||
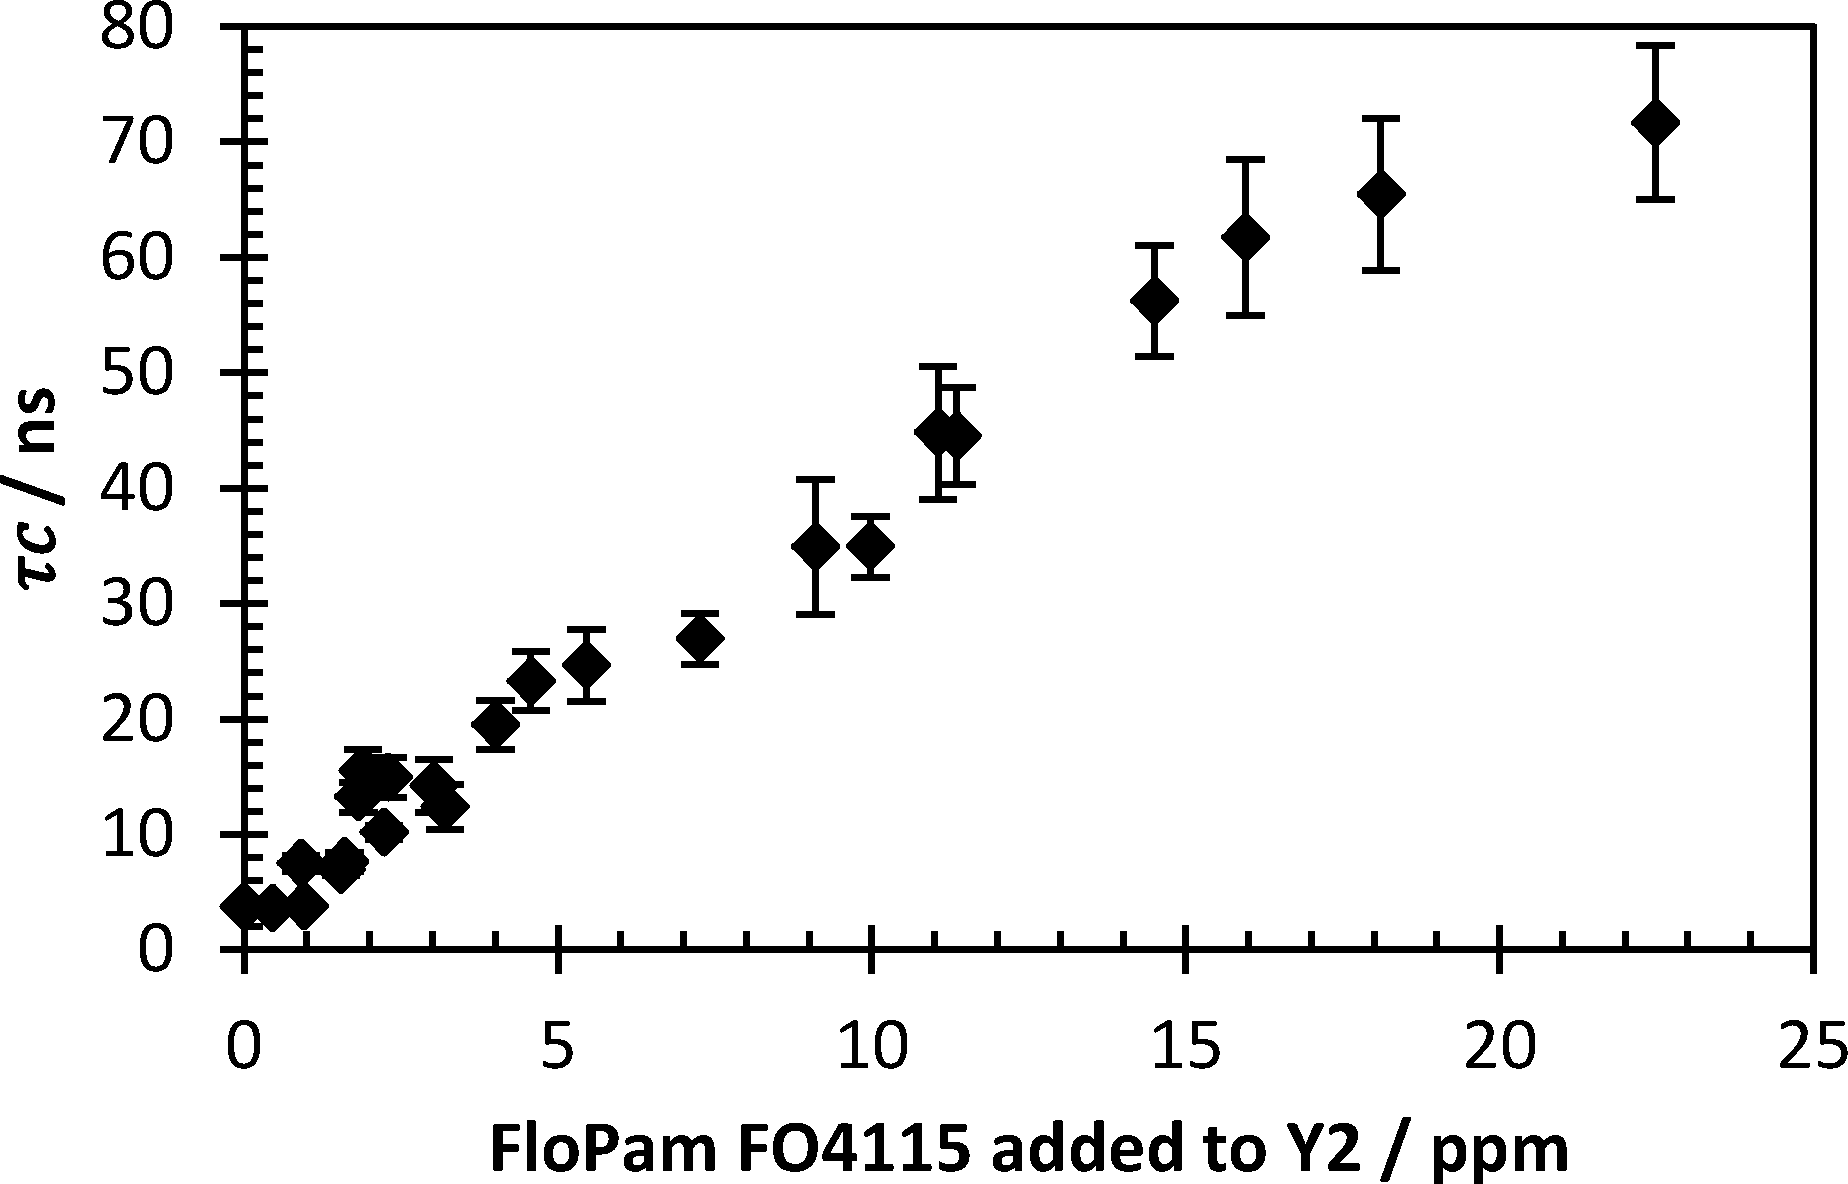
A series of solutions containing cationic polymer FloPam FO4115 (a polymer with less cationic charge density than FloPam FO4650 MPM so remains capable of forming an IPC at pH 2) were mixed with a fixed concentration of 113 mg ml−1 probe at pH 2 (Fig. 5). This was carried out to determine the limits of detection of this polymer. Peak correlation time (>120 nanoseconds) was achieved at concentrations as low as 30 mg per litre, below which the correlation time falls rapidly as the ratio of complexed/uncomplexed PAA probe diminishes.
 | ||
| Fig. 5 Lower concentration limit of FloPam FO4115 by 0.113 mg ml−1 probe at pH 2. Error bars represent standard deviations of fit. | ||
The lower detection limit of this study was indicated by the fact that PAA probe in the absence of flocculant demonstrated a τc below 8.8 nanoseconds (considering all samples below pH 3 the mean was 5.4 ns with a standard deviation of 2.2 ns). From this it can be concluded that complexed polymers with correlation times above 10 ns are significantly different from the uncomplexed polymer (confirmed by unpaired t test of replicate data, P < 0.001). Therefore the limit of detection shown from the data in Fig. 5 was 0.8 mg l−1 (τc = 15.7 ns, standard deviation 2.0 ns). The lower limit of detection from Fig. 4 is higher (3.3 mg l−1).
Testing water impurities
The detection method has previously been demonstrated on dilute polymer samples in ultra-pure water. In order to prove the system's robustness in fresh water samples the probe polymer was dissolved in both tap and sea water and studied across the full pH range. This was then compared with samples in the presence of FloPam FA920 which demonstrated clear complexation at pH < 3 in both tap and sea water (Fig. 6). IPC formation is evident in both impure aqueous samples although pHcrit was diminished in the sea water sample to 2.5, suggesting the high ionic strength of the solution may inhibit IPC interactions. A more thorough investigation of salt impurities was carried out and it was found that 0.1 M concentrations of ammonia, sodium phosphate, sodium chloride or calcium chloride had no impact on reducing the observed correlation time. The only tested salt impurity that prevented IPC formation at the 0.1 M concentration was magnesium sulphate. However IPC formation was restored by lowering the concentration down to 0.01 M (see ESI†). Although this is not a comprehensive test of salt impurities it does show that the agreed method is robust against many potential freshwater contaminants.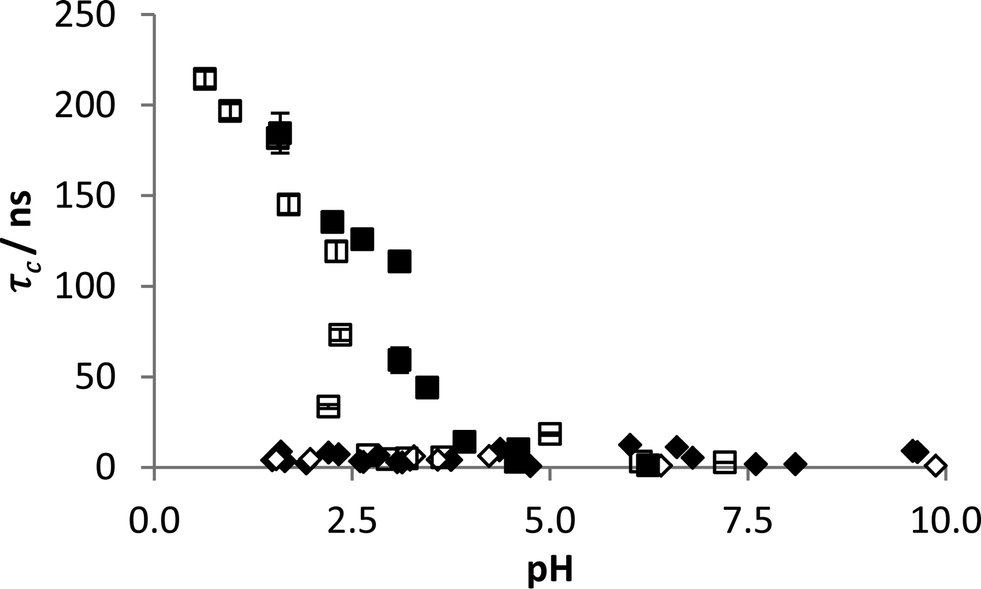 | ||
| Fig. 6 Correlation time of probe polymer in tap (black) and sea water (clear) with (blocks) and without (diamonds) FloPam FA920 with varying pH. Error bars represent standard deviations of fit. | ||
Detection of flocculated samples
 | ||
| Fig. 7 Visual comparison between U. P. water and Y1 sample. | ||
To ensure the impurities of the system do not impede the detection system, PAA-ACE was added to a sample of Y1 water and no increase in correlation time was observed with pH, indicating a lack of flocculant in the raw water. The sample was spiked with an excess of FloPam FA920, with no mixing to induce flocculation, and correlation time rose at low pH showing an increase in flocculent concentration (Fig. 8).
 | ||
| Fig. 8 Correlation time of probe polymer (0.5 mg ml−1) in Y1 water (clear diamonds) and Y1 water spiked with (0.5 mg ml−1) FA920 (black diamonds). Error bars represent standard deviations of fit. | ||
In order to simulate the flocculation that occurs in a water treatment plant a litre of the sample was mixed with FeSO4 and pH corrected to 4 with lime. These mixtures were stirred at 200 rpm for 5 minutes, then 30 rpm for 10 minutes, and then left for ten minutes to settle. This action simulates the action of a flash mixer and conditioning time at an industrial plant. After settling a sample of the supernatant liquid was examined by turbidity and a visual inspection was made of the flocculate sizes (Fig. 9). From this inspection it became apparent that 70 mg l−1 of iron sulphate per litre offered the greatest improvement to sample turbidity, and whilst it did not create the largest flocs they were sufficiently large enough to allow for filtering.
 | ||
| Fig. 9 Turbidity (bars) and floc size (lines) of flash mixing of 1 litre of Y1 water with 40–80 mg l−1 of FeSO4. Error bars (turbidity) are associated error of device, floc size error bars show range (max/min) of particle sizes of floc category. | ||
Another series was created with polymer (0.5 mg l−1, of varying anionic and cationic doses) was added in addition to aqueous FeSO4 (70 mg l−1). To create this 70 mg l−1 of FeSO4 was added to Y1 Water (1 litre) and corrected to pH 4 with lime. The samples were stirred for 5 minutes at 200 rpm, then turned down to 30 rpm and left for ten minutes to settle. To these samples FloPam (0.5 mg in 5 ml) was added before they were flash mixed at 300 rpm for a further 1 minute, for 5 minutes at 30 rpm and then left ten minutes to settle. After this the turbidity of each sample and the floc size was assessed (Fig. 10).
 | ||
| Fig. 10 Turbidity (bars) and floc size (line) of polymer augmented flocculation. Error bars (turbidity) are associated error of device, floc size error bars show range of particle sizes of floc category. | ||
FloPam AN910 (containing a 10% anionic charge) gave the highest increase in aggregation density The polymer also gave a greater reduction in turbidity compared to cationic FO4190. This is a clear improvement over polymers FloPam AN905, AN913 and AN923 which all gave less efficient flocculation and failed to settle within ten minutes (Fig. 11).
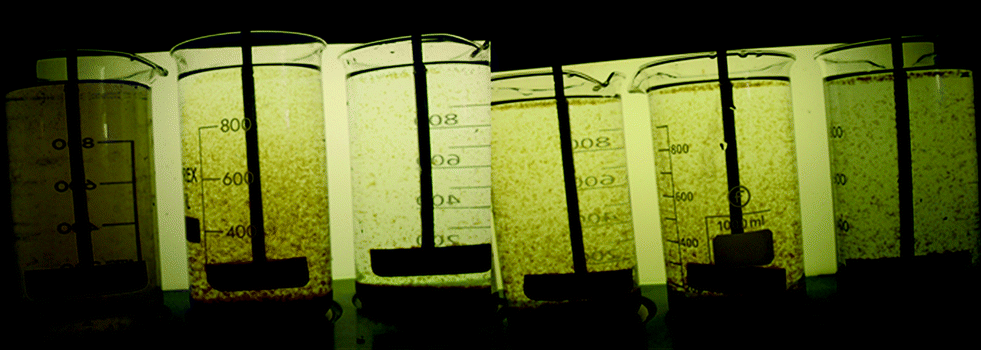 | ||
| Fig. 11 State of reaction vessels after ten minute settling period. Vessels from left to right: reference beaker, FloPam AN905, AN910, AN913, AN923 and FO4190. | ||
The samples containing FloPam AN910 and FO4190 were the most efficient flocculants. Samples of these reaction vessels were retained for fluorescence analysis. PAA-ACE was added to 20 ml of each sample and the correlation times were measured at a variety of pHs. No increase of correlation time was detected at low pH, indicating no significant quantity of FloPam remained solvated in the liquid following flocculation. However, to insure that this was not a false reading the flocculation was repeated, overdosing with 280 mg l−1 FloPam polymer. These samples demonstrate the desired increase in anisotropy (Fig. 12). Interestingly in these conditions polymer FloPam AN910 gave a large increase in correlation time (>100 ns) whereas in ultrapure water an increase of only 60 ns was observed (Fig. 3). Whether this is a concentration effect or due to the ionic strength of solution is unknown.
 | ||
| Fig. 12 Correlation time of flocculated Y1 liquid with 0.3 mg ml−1 PAA-ACE with standard (clear boxes) and overdosed (black boxes) FloPam flocculent. Error bars represent standard deviations of fit. | ||
This demonstrates a reliable test for the presence of polyacrylamide after flocculation, suggesting that unless the system is overloaded the majority of the polyelectrolyte will be removed via permanent sorption to solid matter. These tests show that there is no detectible residual polymer left in these samples when dosed with the required amount of polymer for peak flocculation and that the detection process is not affected by the impurities of the raw water when the system is overdosed with an excess of flocculent.
Water treatment plant Y2
On the 18/09/2012 a sample of water entering the second South Yorkshire water processing plant was collected for analysis (pH 7.1, turbidity 2.61 NTU). A one litre sample was dosed with 8.5 ml FeSO4, 0.05 ml lime solution (to pH 4.5), flash mixed for 30 seconds then stirred at 250 rpm for 2 minutes. 0.2 mg l−1 polymer was added before flash mixing for a further 30 seconds and then stirring at 250 rpm for 12 minutes. Floc size was noted and samples were allowed to settle for fifteen minutes. A selection of cationic (FO) and anionic (AN) polymers were used and it was shown that FO4140 left the lowest turbidity in dewatered solution whilst AN905 resulted in the largest floc size (Fig. 13). However, due to the current successful usage of FO4115 on this particular plant, FO4140 offered negligible benefit following cost analysis of changing plant protocol. | ||
| Fig. 13 Turbidity (columns) and floc size (line) of polymer treated Y2 water. Error bars show known variability arising from visual reference standards. Error bars (turbidity) are associated error of device, floc size error bars show range of particle sizes of floc category. | ||
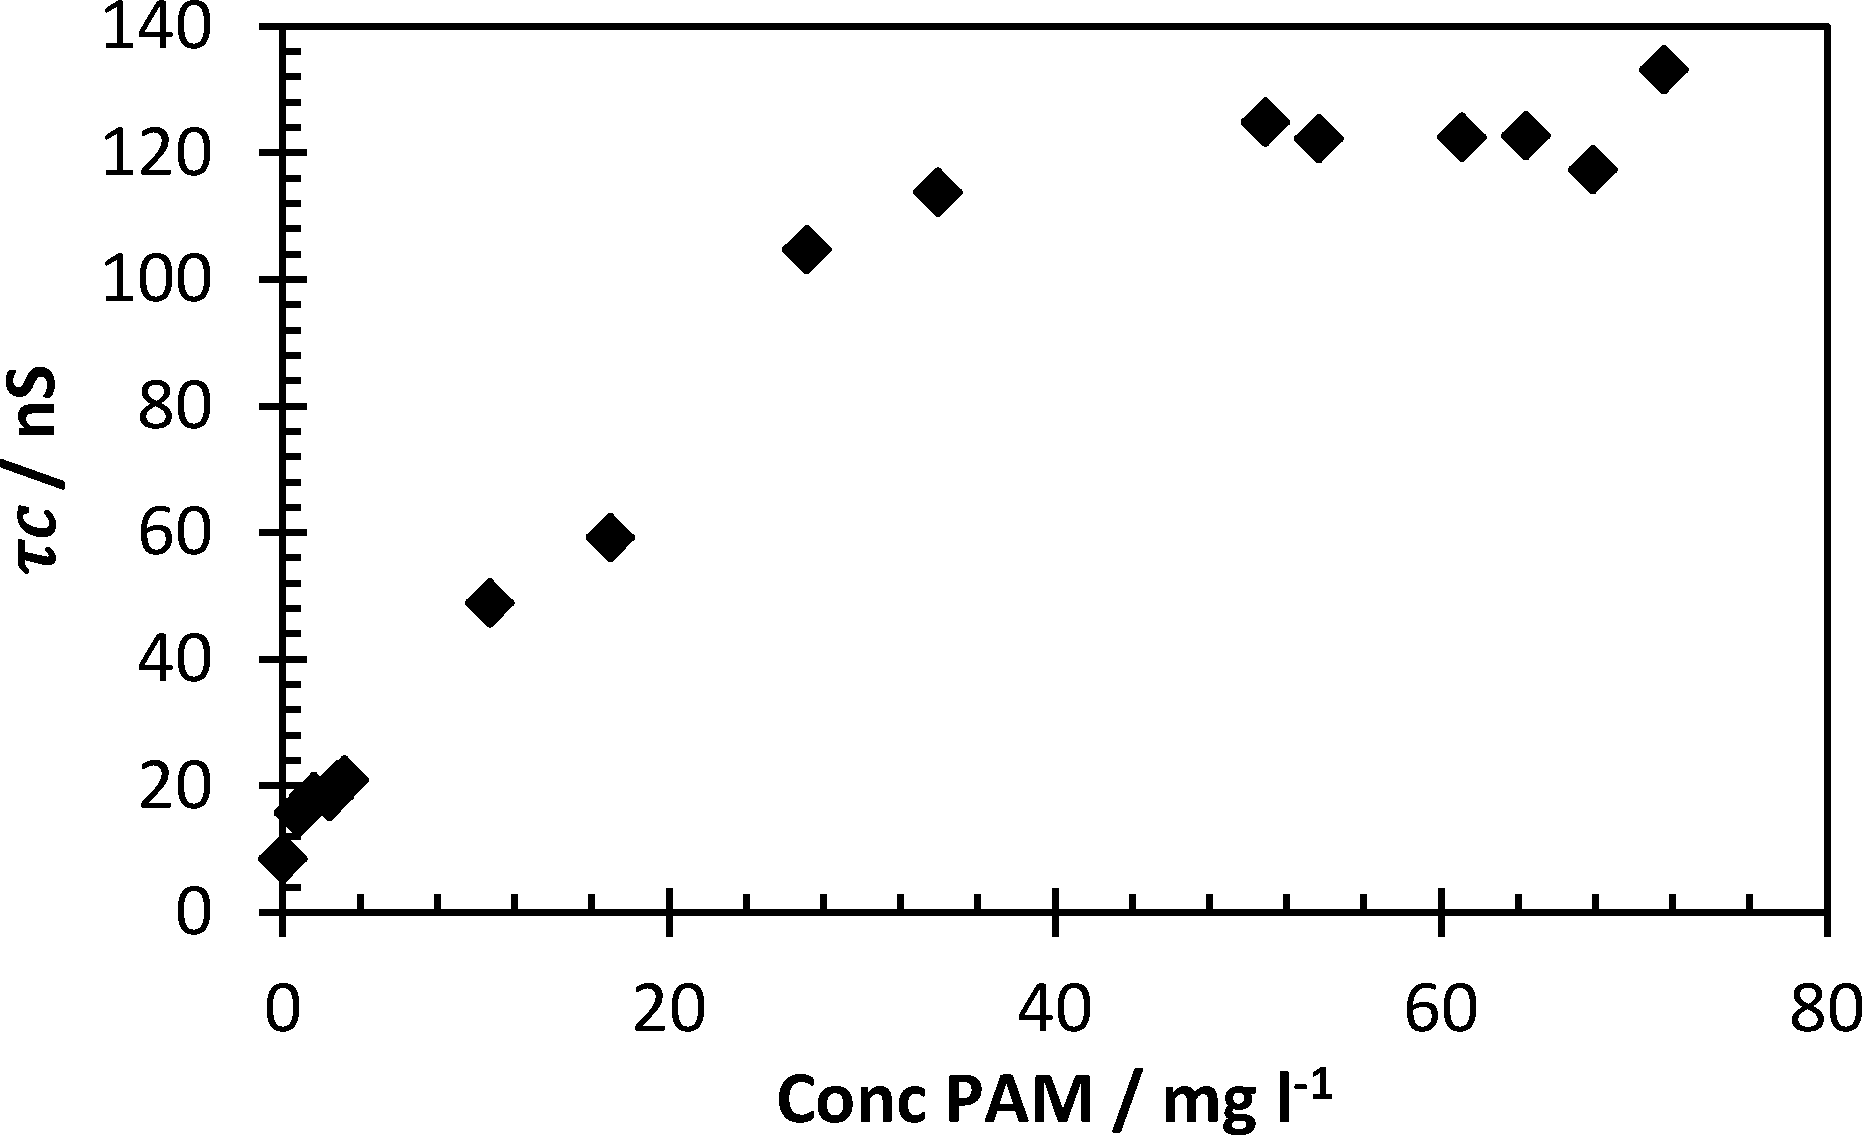
To match plant protocol 500 ml Y2 water was stirred with 9 mg FeSO4, brought down to pH 4.5 with lime solution before being mixed with varying concentrations of FloPam FO4115. 2 ml of the supernatant following flocculation was extracted and mixed with probe polymer and studied via anisotropy at pH 0.80 (Fig. 14). A clear correlation between the concentration of PAM used as a flocculent and the correlation time were observed at very low concentrations, with the system detecting complex formation occurring as low as 1.5 mg per litre.
 | ||
| Fig. 14 Correlation time of flocculated Y2 water with varying polymer dosage. Error bars represent standard deviations of fit. | ||
Comparing the detection limits of this polymer after flocculation with the detection limits determined by sampling Y2 and adding the flocculant with no mixing it is possible to demonstrate the amount of polymer that is consumed by the flocculation process, and to view the efficiency of polymer aggregation (Fig. 15). The correlation times are in broad agreement above 10 mg l−1. However at very low concentrations (0.8 mg l−1) the correlation time of the laboratory based sample showed a small response whilst the flocculated sample shows no definite response until approx. 1.8 mg l−1 polymer dosage has been reached. This suggests that 0.5 mg of polymer was consumed in the flocculation of 500 ml Y2 reservoir water and additional polymer dosage above this level plays no role in the aggregation of dissolved organic matter (expanded spectra attached in the ESI†).
 | ||
| Fig. 15 Detector response of PAM in Y2 water (with no flocculation). Error bars represent standard deviations of fit. | ||
Testing was also carried out on anionic FloPam AN905. 600 ml of Y2 reservoir water was flocculated with the polymer and after settling 20 ml of the wastewater was mixed with 3 mg probe and tested via anisotropy (Table 1), resulting in a clear signal at extreme overdosing of PAM. This shows that the detection method is equally suitable for anionic and cationic flocculants.
| PAM conc./mg l−1 | T c/ns | Std. dev./ns |
|---|---|---|
| 980 | 160.0 | 5.5 |
| 670 | 176.0 | 8.4 |
| 20 | 1.8 | 0.5 |
Soil aggregates
On the 4/04/2013 a sample, SA, of recycled soil was delivered to Sheffield University. This sample was analysed by elemental analysis before 10 g was dissolved in 10 litres of water to give a turbidity of 15.35 NTU and this was then tested by ICP MS (Table SI3†) which showed that the raw effluent contained more than 1 mg l−1 of Al, Ca, Fe, K, Mg, Mn, Na, P, S, Si and Ti.Samples were flocculated by direct addition of FloPam AN910 into 250 ml sample and stirring for twenty minutes. Efficiency of flocculation was measured by turbidity (Fig. 16) and ICP MS (Full elemental breakdown is included in the ESI†) and both suggest 20 mg l−1 of polymer resulted in most efficient removal of dissolved organic matter.
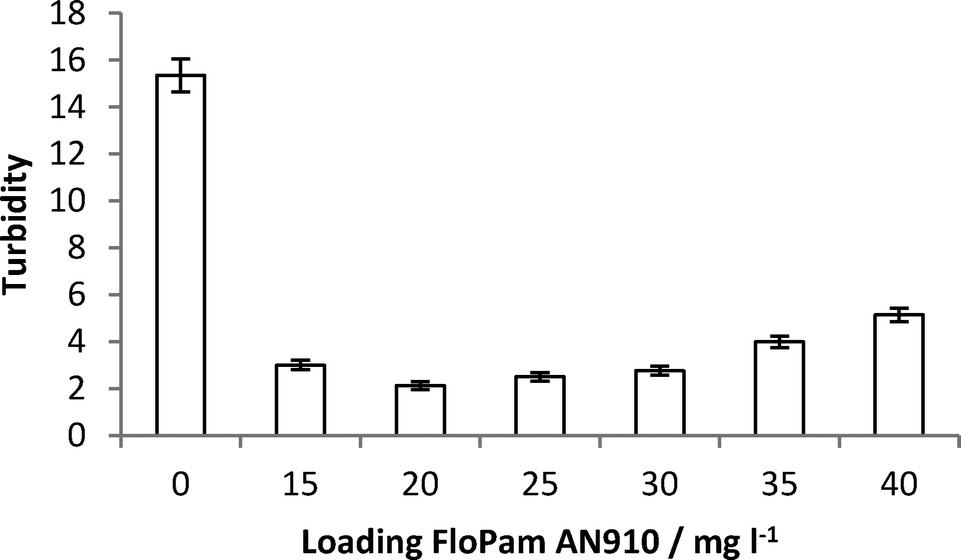 | ||
| Fig. 16 Turbidity of raw and flocculated SA samples with increasing loading of FloPam AN910 polymer. | ||
Flocculated water from these samples was then tested for the presence of residual flocculent (Fig. 17). A clear increase in anisotropic response due to complex formation is visible by 30 mg l−1, growing exponentially to 40 mg l−1, clearly showing an overdose of polyelectrolyte. It was not possible to measure the anisotropy of the probe in raw SA aggregate samples prior to the addition of flocculent as the sample's high turbidity prevents passage of the light beam and it is also possible that the signal at 40 mg l−1 was also hindered by high amounts of scattered light, accounting for the unusually high error in the measurement (see ESI†). Despite that the fast rise in correlation time after the ideal flocculant loading has been added (20–25 mg l−1) shows that this technique is capable of sensing any overdosing of flocculant and the resultant runoff in wastewater following the dewatering process.
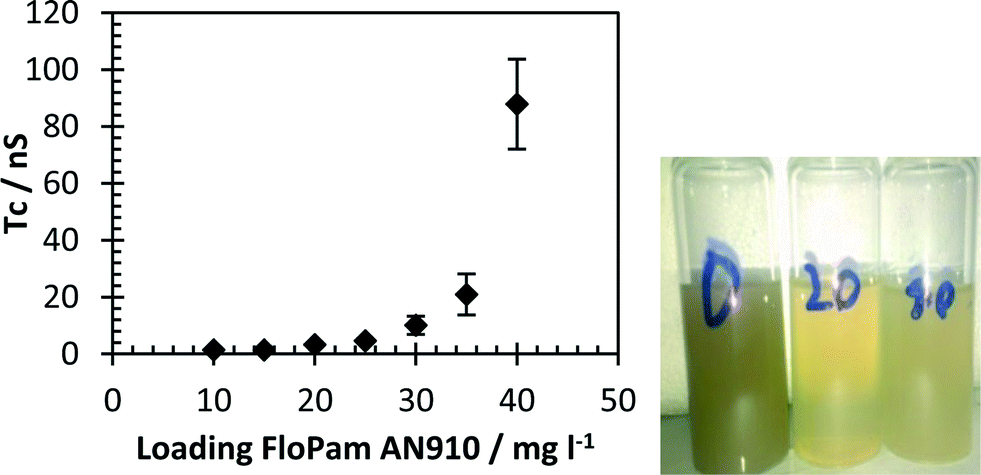 | ||
| Fig. 17 Left: correlation time of flocculated SA aggregates with varying FloPam dosage. Error bars represent standard deviations of fit. Right: visual comparison of turbidity of SA aggregates at 0, 20 and 40 mg l−1 FloPam dosage. | ||
Conclusions
Several fresh water flocculation procedures were tested to see if residual poly(acrylamide) flocculant was detectible following aggregation of dissolved organic matter using a proposed detection method involving the anisotropy of an IPC forming fluorophore containing polymer probe. No runoff was observed at standard levels of dosing but artificially increasing the flocculant dose gave recognisable increases in the probe correlation time.The detection method has been shown to be robust enough to withstand many salt impurities which are liable to be found in a fresh water supply post flocculation, with opacity of the sample being our main concern. One major benefit of this proposed method is its acceptability towards different degrees of polyelectrolyte charge density, accommodating both anionic and cationic samples as long as consideration is made to the pHcrit necessary for IPC formation. Currently the lowest limit of detection demonstrated in this paper is 0.8 mg l−1. The main inhibiting factor to the level of detection is the concentration of polymer probe, current results have differentiated on the mg l−1 scale, and whilst lower concentrations of probe are possible it results in an increased timescale of detection. As the concept of detection via complexation has been proven further work will now be required to calibrate detection limits in order to implement a full concentration detector.
This system shows potential as a clear indicator of correct dosing levels for polymer addition to effluent treatment processes, the main benefit of this method being that it is both fast, appears not to be effected by the presence of dissolved organic matter and requires no modification of the sample prior to analysis besides setting the pH and addition of the probe polymer.
Acknowledgements
This work was carried out as part of an EPSRC CASE funded PhD studentship at the University of Sheffield, sponsored by SNF (UK) Ltd. It was carried out with the assistance of the staff at SNF (UK) Limited who donated a range of poly(acrylamide) FloPam samples and assisted in sample collection at freshwater sites across the United Kingdom. The sites from which samples Y1, Y2 and the soil aggregates were collected have been requested to remain anonymous for commercially sensitive reasons.Notes and references
- B. Bolto and J. Gregory, Water Res., 2007, 41, 2301–2324 CrossRef CAS PubMed.
- European Union Risk Assessment Report: Acrylamide, Office For Official Publications of the European Communities, 2002 Search PubMed.
- E. A. Smith and F. W. Oehme, Rev. Environ. Health, 1991, 9, 215–228 CAS.
- K. E. Biesinger and G. N. Stokes, J. - Water Pollut. Control Fed., 1986, 58, 207–213 CAS.
- A. J. Harford, A. C. Hogan, D. R. Jones and R. A. van Dam, Water Res., 2011, 45, 6393–6402 CrossRef CAS PubMed.
- R. Costa, J. L. Pereira, J. Gomes, F. Gonçalves, D. Hunkeler and M. G. Rasteiro, Chemosphere, 2014, 112, 177–184 CrossRef CAS PubMed.
- R. D. Lentz, R. E. Sojka and J. A. Foerster, J. Environ. Qual., 1996, 25, 1015–1024 CrossRef CAS.
- F. A. Chmilenko, I. V. Korobova and S. V. Nazarenko, J. Anal. Chem., 2004, 59, 124–128 CrossRef CAS.
- Y. A. Attia and J. Rubio, Br. Polym. J., 1975, 7, 135–138 CrossRef CAS.
- G. G. Hawn and C. P. Talley, Anal. Chem., 1981, 53, 731–732 CrossRef CAS.
- M. W. Scoggins and J. W. Miller, Anal. Chem., 1975, 47, 152–154 CrossRef CAS.
- J. Lu, L. Wu and J. Gan, J. Environ. Qual., 2003, 32, 1922–1926 CrossRef CAS.
- E. R. Hendrickson and R. D. Neuman, Anal. Chem., 1984, 56, 354–357 CrossRef CAS.
- A. S. Michaels and O. Morelos, Ind. Eng. Chem., 1955, 47, 1801–1809 CrossRef CAS.
- J. H. Lu and L. Wu, J. Agric. Food Chem., 2001, 49, 4177–4182 CrossRef CAS PubMed.
- J. Kang, T. D. Sowers, O. W. Duckworth, A. Amoozegar, J. L. Heitman and R. A. McLaughlin, J. Environ. Qual., 2013, 42, 1902–1907 CrossRef CAS PubMed.
- C. S. Murgatroyd, A review of polyelectrolytes to identify priorities for EQS development, Environment Agency; Water Research Centre Foundation for Water Research, Almondsbury, Bristol., 1996 Search PubMed.
- K. Liber, L. Weber and C. Lévesque, Chemosphere, 2005, 61, 1123–1133 CrossRef CAS PubMed.
- Water Discharge and Groundwater (from point source) Activity Permits (EPR 7.01) v3, Environment Agency, 2012 Search PubMed.
- M. I. Aguilar, J. Sáez, M. Lloréns, A. Soler and J. F. Ortuño, Water Res., 2002, 36, 2910–2919 CrossRef CAS.
- W. Sun, G. Zhang, L. Pan, H. Li and A. Shi, Int. J. Polym. Sci., 2013, 2013, 10 Search PubMed.
- J. L. Kerr, J. S. Lumsden, S. K. Russell, E. J. Jasinska and G. G. Goss, Environ. Toxicol. Chem., 2014, 33, 1552–1562 CrossRef CAS PubMed.
- T. Swift, L. Swanson and S. Rimmer, RSC Adv., 2014, 4, 57991–57995 RSC.
- J. R. Ebdon, B. J. Hunt, D. M. Lucas, I. Soutar, L. Swanson and A. R. Lane, Can. J. Chem., 1995, 73, 1982–1994 CrossRef CAS.
- C. G. Daughton, Quantitation of Acrylamide (and Polyacrylamide): Critical Review of Methods for Trace Determination/Formulation Analysis & Future-Research Recommendations, Final Report No. CGD-02/88, The California Public Health Foundation, Subcontract No. 84-84571 (also available as NTIS PB89-121685/AS), 1988 Search PubMed.
- F. A. Al Momani and B. Örmeci, J. Environ. Chem. Eng., 2014, 2, 765–772 CrossRef CAS PubMed.
- J. W. Wimberley and D. E. Jordan, Anal. Chim. Acta, 1971, 56, 308–312 CrossRef CAS.
- S. P. Frankoski and S. Siggia, Anal. Chem., 1972, 44, 2078–2080 CrossRef CAS.
- M. W. Scoggins and J. W. Miller, Soc. Pet. Eng. J., 1979, 19, 151 CrossRef CAS PubMed.
- N. S. C. Becker, D. M. Bennett, B. A. Bolto, D. R. Dixon, R. J. Eldridge, N. P. Le and C. S. Rye, React. Funct. Polym., 2004, 60, 183–193 CrossRef CAS PubMed.
- G. A. Mun, Z. S. Nurkeeva, V. V. Khutoryanskiy, G. S. Sarybayeva and A. V. Dubolazov, Eur. Polym. J., 2003, 39, 1687–1691 CrossRef CAS.
Footnote |
| † Electronic supplementary information (ESI) available: Including IPC mass spec of all water sources, a list of SNF (UK) LTD documented polymers, additional correlation time data and photographic comparison between reference and flocculated beakers. See DOI: 10.1039/c4ew00092g |
| This journal is © The Royal Society of Chemistry 2015 |