Phosphate removal using modified Bayoxide® E33 adsorption media†‡
Jacob
Lalley
ab,
Changseok
Han
ac,
Gayathri Ram
Mohan
c,
Dionysios D.
Dionysiou
b,
Thomas F.
Speth
a,
Jay
Garland
d and
Mallikarjuna N.
Nadagouda
*a
aThe U.S. Environmental Protection Agency, ORD, NRMRL, WSWRD, WQMB, 26 W. Martin Luther King Jr. Drive, Cincinnati, OH 45268, USA. E-mail: Nadagouda.mallikarjuna@epa.gov; Fax: +1 (513) 569 7172; Tel: +1 (513) 569 7232
bEnvironmental Engineering and Science Program, Department of Biomedical, Chemical and Environmental Engineering (DBCEE), University of Cincinnati, OH 45221, USA
cPegasus Technical Services Inc., 46 E Hollister St, Cincinnati, OH 45219, USA
dThe U.S. Environmental Protection Agency, ORD, NERL, MCEARD, 26 W. Martin Luther King Jr. Drive, Cincinnati, OH 45268, USA
First published on 10th November 2014
Abstract
The adsorption of phosphate onto modified Bayoxide® E33 (E33) and underlying mechanisms were comparatively investigated by batch kinetics, sorption isotherms, rapid small-scale column tests, and material characterization. Synthesis of modified E33 was conducted by the addition of manganese and silver nanoparticles on the surface of the goethite (α-FeOOH)-based E33. Upon successful adsorbent synthesis, the materials were characterized using SEM, TEM, XRD, EDX, HR-TEM, and BET surface area analysis. The adsorption kinetics is described by a fast initial adsorption stage followed by a slow adsorption stage, complying with pseudo second-order kinetics and Elovich kinetics. Sorption isotherms revealed that the equilibrium capacity of one of the modified adsorbents (E33/AgII) exceeded that of unmodified E33 likely due to its increased BET surface area. Column experiments confirmed the results for adsorption kinetics and equilibrium of phosphate sorption onto E33 and modified E33. This suggests that media modification has the potential to improve phosphate removal properties.
Water impactAs a limiting nutrient in the environment, increased loads of phosphates can result in accelerated eutrophication or excessive growth of algae, leading to increased treatment costs and reduced recreational value. Therefore, phosphate removal from wastewater has become an area of emerging concern. In this study, the removal of phosphate using newly surface-modified Bayoxide® E33 was thoroughly examined. Underlying mechanisms were comparatively investigated by batch kinetics, sorption isotherms, rapid small-scale column tests, and material characterization. The adsorption kinetics is well described by a fast initial adsorption stage followed by a slow adsorption stage, complying with pseudo second-order kinetics and Elovich kinetics. The results showed potential for practical applications of the modified material for phosphate removal. |
1. Introduction
Phosphates are one of the common mineral nutrients found in wastewaters.1 Both natural and anthropogenic sources such as agricultural runoffs2,3 and urban4 and industrial wastes5,6 act as major sources of phosphate in surface water bodies. In aquatic systems, phosphates occur in various forms, particulate, organically bound, or dissolved,7 of which orthophosphates (PO43−) are found to be predominant.8 While it is an essential nutrient, higher concentrations of phosphate in water bodies can be detrimental to aquatic life, human health, and the environment.9 As a limiting nutrient in the environment, increased loads of phosphates can result in accelerated eutrophication or excessive growth of algae, leading to increased treatment costs and reduced recreational value.10 Therefore, phosphate removal from wastewaters has become an area of emerging concern.Conventional methods for phosphate removal include physical, chemical, and biological processes; of which, chemical precipitation11 and enhanced biological phosphate removal (EBPR)12,13 are commonly used. However, due to a number of factors including cost, sludge production, required energy, and issues of reliability and stability,14,15 other methods are currently being explored. The quickest, easiest, and most economically known method for the removal of phosphate ions is adsorption.16 To date, a number of different adsorbents have been investigated for phosphate removal including metal oxides,16–22 red mud,23–25 steel slag,26–28 and fly ash.29,30Table 1 shows different phosphate adsorbents and their reported adsorption capacity at different parameters. Adsorption also has the benefits of applicability at low concentrations, little to no sludge production, and potential for both batch and continuous processes, and the potential for adsorbent regeneration that could reduce wastes and costs.31
| Adsorbent | Capacity (PO43− mg g−1) | pH | Temperature (°C) | Reference |
|---|---|---|---|---|
| Metal oxides synthesized from manganese ore tailing | 26.3 | 6.0 | 25 | 16 |
| Titanium ion doped ordered mesoporous silica | 4.5 | 7.0 | 21 | 17 |
| Magnetic iron oxide nanoparticles | 3.7 | 3.0 | 15 | 18 |
| Zinc–aluminum layered double hydroxides | 30.0 | 9.0 | 20 | 19 |
| Iron oxide-coated crushed brick | 1.8 | 5.0 | 20 | 20 |
| Lithium-intercalated gibbsite | 0.3 | 4.5 | 25 | 21 |
| Fe-loaded biomass char | 35.4 | 3.0 | 25 | 22 |
| HCl-treated red mud | 0.6 | 5.5 | 40 | 23 |
| Red mud granular adsorbents | 9.8 | 9.2 | 37 | 24 |
| Red mud | 0.5 | 4.0 | 25 | 25 |
| Modified steel slag | 11.1 | 8.0 | 25 | 26 |
| Steel slag | 5.3 | 5.5 | 25 | 27 |
| Electric arc furnace (EAF) steel slag | 2.2 | 6.0 | 23 | 28 |
| Iron oxide/fly ash | 27.4 | 3.0 | 25 | 29 |
| Fly ash | 18.9 | 3.0 | 25 | 29 |
| Nanshi-modified fly ash | 40.7 | 4.0 | 21 | 30 |
| Nanshi-modified zeolite | 47.2 | 4.0 | 21 | 30 |
| E33 | 26.8 | 7.0 | 21 | This study |
| E33/Mn | 17.8 | 7.0 | 21 | This study |
| E33/AgI | 19.3 | 7.0 | 21 | This study |
| E33/AgII | 28.0 | 7.0 | 21 | This study |
One such highly adsorptive material for phosphate removal is the iron oxide goethite (iron(III) oxide-hydroxide).32–35 The affinity of phosphate adsorption on iron(III) oxide-hydroxide is dependent on phosphate's complexing capacity by ligand exchange as well as electrostatic interactions with the surface.36 This process involves replacement of a phosphate ion with one or more surface hydroxyl groups, releasing surface structural OH2 and/or OH− into the bulk solution,37 in which stoichiometric changes in the amount of phosphate adsorbed and OH− released can provide clues on the type of adsorption mechanism.38 Iron(III) oxide-hydroxide adsorption initially occurs rapidly, followed by a slow stage,39 attributed to micro/mesopore diffusion40 or particle aggregation,41 which is generally dependent on the crystallinity of samples.42 Phosphate adsorption onto iron oxides involves a ligand exchange mechanism,43 yet the exact mode of phosphate interaction is not known. IR studies revealed that each adsorbed phosphate ion replaces two, singly coordinated OH surface groups, indicating a bridging, binuclear complex.44,45 However, other studies have suggested that monodentate surface complexes could exist at low adsorbate concentrations.46 Using a combination of surface complexes to model adsorption on iron oxides, Geelhoed et al.47 concluded that the bidentate surface complex was most abundant at low to intermediate values of pH.
Goethite (α-FeOOH) is one of the most thermodynamically stable forms of iron oxide and thus is available in abundant quantities.48 Due to its affinity for ion adsorption, AdEdge Technologies Inc. (USA) has produced Bayoxide® E33 media (E33), a commercially available goethite-based adsorbent for environmental remediation. Although originally designed for arsenic removal,49,50 E33 has been shown to adsorb a range of ions including phosphates. While several studies have shown that E33 adsorption is an effective technique for phosphate removal,51–53 surface modifications of E33 can enhance overall adsorption. As adsorption is a surface-based phenomenon dependent on electrostatic interactions and covalent bonding, the addition of di- and tri-valent metals to the surface of E33 should correlate with increased phosphate adsorption.
In this study, the surface of E33 media was modified with manganese and silver. For the removal of phosphate, the adsorptive properties of modified E33 were investigated and then compared to those of the unmodified E33.
2. Experimental
2.1 Materials
The E33 used to study PO43− removal was obtained from AdEdge Technologies Inc. (USA). Analytical grade sodium phosphate monohydrate (NaH2PO4·(H2O)) was obtained from Fisher Scientific and used as a stock solution. A stock phosphate solution at a concentration of ≈80 mg L−1 was prepared by dissolving 1 g of NaH2PO4·(H2O) in 10 L of Milli-Q water. The pH of the stock phosphate solution was maintained constant at 6, 7 and 9, using 2-(N-morpholino) ethanesulfonic acid (MES), 3-(N-morpholino) propanesulfonic acid (MOPS), and N-tris (hydroxymethyl) methyl-3-aminopropanesulfonic acid (TAPS), respectively, all obtained from Sigma Aldrich. Reagent grade silver nitrate (AgNO3), sodium borohydride (NaBH4), and manganese acetate tetrahydrate (Mn(CH3COO)2·4H2O) were obtained from Sigma Aldrich and used as received.2.2 Synthesis of modified E33
For the synthesis of silver-modified E33, an initial mixture of 10 g of E33 and 35 mL of Milli-Q water was prepared in a 100 mL conical flask. Then, 2 mL of 0.1 N AgNO3 was added to the flask and shaken by hand for 2 min to ensure thorough mixing. To this initial mixture, two different adsorbents were prepared, one using NaBH4 and the other using tea extract, denoted respectively as (E33/AgI)50 and (E33/AgII)50. For E33/AgI, 10 mL of 0.1 N NaBH4 was added to the initial mixture, hand shaken for 2 min and allowed to react overnight at room temperature. For E33/AgII, 2 g of tea powder (Red Label, India) was boiled in 100 mL of Milli-Q water and the solution was filtered through a 0.20 μm PTFE filter. Then, 20 mL of the tea extract solution was added to the initial mixture, shaken by hand for 2 min, and allowed to react overnight at room temperature. Following the overnight incubation, samples were twice washed with Milli-Q water and air-dried at room temperature prior to characterization and analysis.50For the synthesis of manganese-coated E33 (E33/Mn), 50 g of E33 was mixed with 20 mL of Milli-Q water in a china crucible. Then, 10 g of manganese acetate tetrahydrate (Mn(CH3COO)2·4H2O, Aldrich product) was added to the crucible and the solution was hand-mixed with a spatula for 5 min to ensure proper mixing. After mixing was complete, the sample was heated at 310 °C for 1 h in a china crucible and then stored for later analysis and characterization.
2.3 Sample characterization
X-ray diffraction (XRD) analysis was performed using a PANalytical (X'pert) 2-theta diffractometer (PANalytical, Almelo, the Netherlands) in the 2-theta range of 2–90° under CuKα radiation and a wavelength of 1.54 μm in order to determine the adsorbent's crystal structure. An environmental scanning electron microscope (ESEM, model Philips XL 30 ESEM-FEG) at an accelerating voltage of 30 kV was used to characterize the surface morphology of the adsorbents. An energy-dispersive X-ray spectrophotometer (EDX) installed in the ESEM was used to detect the distribution of elemental phosphorus as well as the percent of phosphate adsorbed. For transmission electron microscopy (TEM), a FEI CM20 TEM operated at 200 kV was employed. High-resolution TEM (HR-TEM, JEM-2010F (JEOL)) with a field emission gun at 200 kV was also employed for the characterization of the prepared surface-modified adsorbents. Free software (ImageJ, National Institutes of Health, USA) was used for HR-TEM image analysis. Adsorbent samples were prepared by ultrasonication (2510R-DH Bransonic) for 20 min in isopropyl alcohol (99.8%, Pharmco), and then a drop of the supernatant was fixed on a carbon-coated copper grid (FCF400-Cu, EMS) and dried at room temperature. A Tristar 3000 porosimeter analyzer (Micromeritics) was used to determine the adsorbent's BET surface area, total pore volume, and porosity. Samples were first purged with nitrogen gas at 150 °C for 2 h using Micromeritics FlowPrep 060.2.4 Adsorption studies
To determine various adsorption parameters of the surface-modified adsorbent, both batch and flow-through column experiments were employed. Batch adsorption kinetic studies were carried out to determine the amount of phosphate adsorbed with respect to time. Experiments were conducted in 250 mL Nalgene polypropylene bottles given the following conditions: (i) temperature: 20–25 °C, (ii) adsorbent amount: 5 g L−1, (iii) pH: 6, 7, and 9, (iv) influent phosphate concentration: ≈80 mg L−1. A constant pH in the batch reactor was maintained using 5 mM MES, MOPS, and TAPS buffer (for pH 6, 7, and 9, respectively) and was continually mixed at a constant speed of 150 rpm (G10 Gyrotary shaker, New Brunswick Scientific Co. Inc., USA). At higher mixing speed, E33 samples started breaking down. Grab samples were collected at various predetermined intervals (e.g. after 5, 10, 15, 30, 45 min and 1, 2, 3, 4, 5 h) and filtered using a Whatman 0.45 μm nylon syringe filter. Experiments were conducted in duplicate while each grab sample was a single measurement.Rapid small scale column tests were performed in Harvel plastic columns 80 cm high and 1.9 cm in diameter. One gram of adsorbent media with a fixed height of 1.27 cm, with sand and gravel above and below, was placed in the columns with a stainless steel sieve at the bottom end of the column to prevent washout. Using a Thermo Scientific™ FH100M Series Peristaltic pump, the phosphate solution was passed through the column at a rate of 2 mL min−1 at room temperature. Similar to the kinetic study, solution pH was adjusted initially and buffered to remain constant using 5 mM MES, MOPS, and TAPS. The column effluent samples were collected and analyzed for phosphate concentration at various time periods and run until complete breakthrough (i.e. saturation). Flow through experiments were conducted in duplicate while each grab sample was a single measurement.
Variable-dose isotherm adsorption studies were conducted. Different amounts of adsorbent (ranging from 100 to 600 mg) were placed in 250 mL Nalgene polypropylene bottles. One hundred milliliters of the same 80 mg L−1 phosphate solution was then added to the bottles. Buffers (5 mM MES, MOPS, and TAPS) were used to maintain constant pH conditions to evaluate adsorption characteristics at varying pH values. The sealed bottles were placed on a tabletop rotating shaker and shaken at a constant 150 rpm at 21 ± 1 °C for 2 weeks, which preliminary test results revealed was sufficient time for equilibrium to be reached. The phosphate concentration in all experiments was analyzed by a colorimetric measurement technique in which ammonium molybdate and potassium antimonyl tartrate react in an acidic solution with orthophosphate to form phosphomopydbic acid which can be reduced by ascorbic acid to form an intense blue color.54 The absorbance due to the blue complex was monitored at 880 nm using UV-Vis spectrophotometry (Hach model number DR 2700). Experiments were conducted once and samples were measured in triplicate and averaged.
3. Results
3.1 Adsorbent characterization
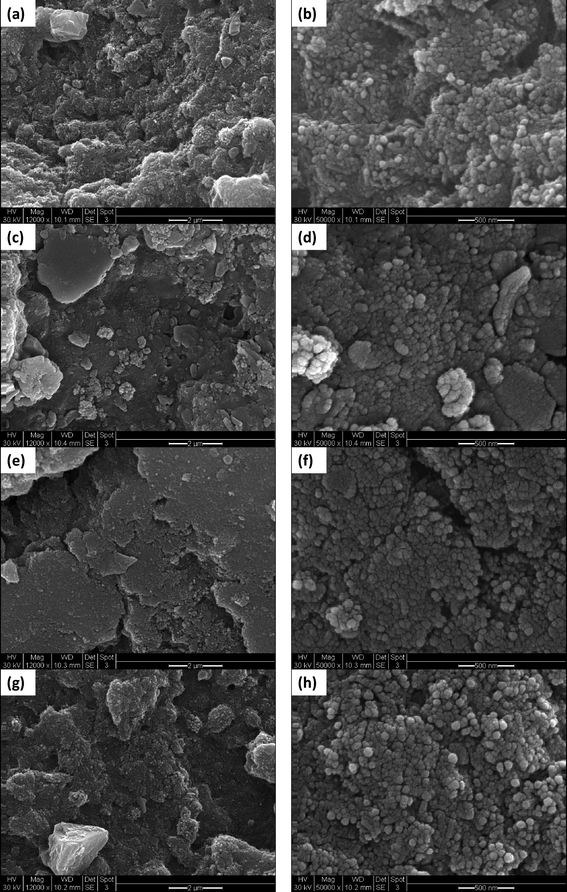
Table 2 summarizes the physical characteristics of E33 and modified E33 samples. The BET surface area of E33 exceeded that of the modified samples except for E33/AgII, which had a slightly higher BET surface area (142.0 m2 g−1 compared to 140.4 m2 g−1). The manganese-coated E33 had a significantly reduced BET surface area (102.8 m2 g−1) compared to E33. This suggests that at least a portion of the manganese oxide nanoparticles occupied the pore structure of E33. This table also summarizes structural characteristics of the adsorbent prior to and after phosphate adsorption. Fig. S1 (a) and (b)‡ show N2 adsorption and desorption isotherms for all samples before and after using for phosphate removal. They present typical Type IV adsorption isotherms, indicating the formation of mesoporous materials.55| Sample | Before adsorption | After adsorption | ||||
|---|---|---|---|---|---|---|
| S BET (m2 g−1) | Total pore volume (cm3 g−1) | Porosity (%) | S BET (m2 g−1) | Total pore volume (cm3 g−1) | Porosity (%) | |
| E33 | 140.4 | 0.583 | 16.2 | 145.0 | 0.637 | 15.0 |
| E33/AgI | 124.6 | 0.456 | 12.6 | 136.8 | 0.449 | 11.1 |
| E33/AgII | 142.0 | 0.553 | 15.4 | 143.1 | 0.618 | 14.7 |
| E33/Mn | 102.8 | 0.441 | 12.3 | 99.5 | 0.623 | 14.8 |
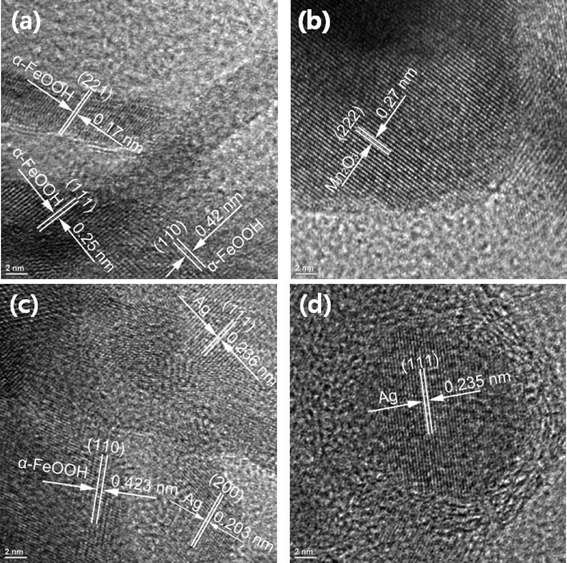
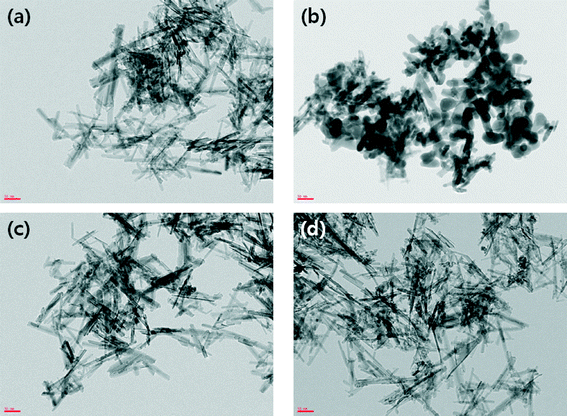 | ||
| Fig. 3 TEM images at 100k magnification of adsorbent media (a) E33, (b) E33/Mn, (c) E33/AgI, and (d) E33/AgII. (All scale bars: 50 nm.) | ||
3.2 Adsorption studies
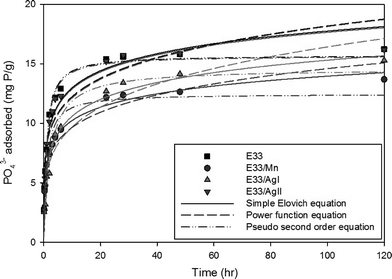 | ||
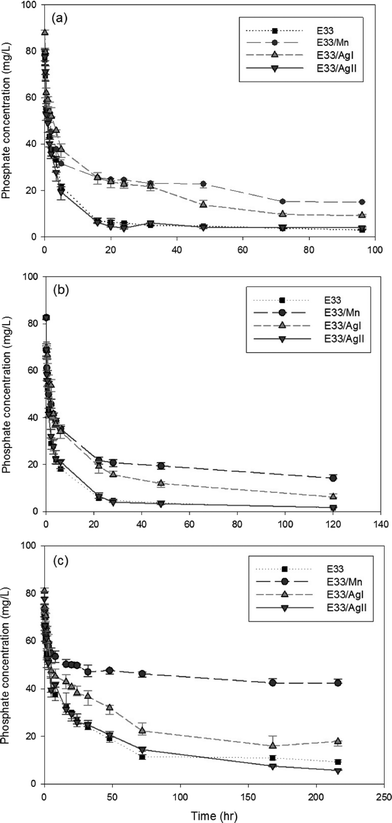
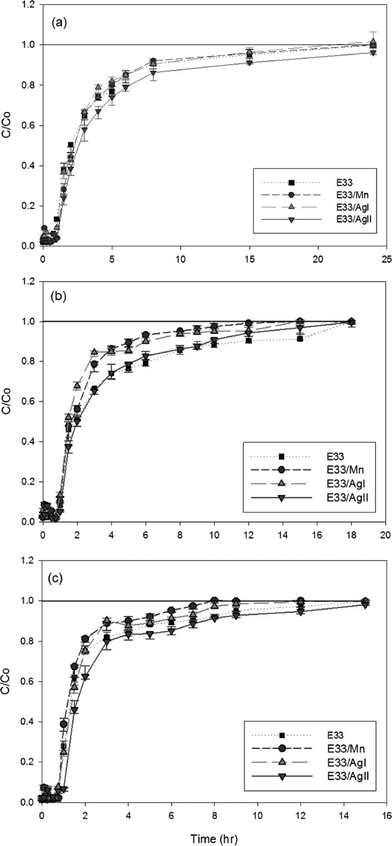
| Fig. 6 Phosphate adsorption kinetic data for E33 and modified E33 at 20 °C, pH 7, and an influent concentration of 83 mg P L−1. | ||
The kinetic data for phosphate adsorption seen in Fig. 6 were fitted to several kinetic models including the pseudo-second-order equation and the simple Elovich equation by non-linear regression using SigmaPlot software. The kinetic equations used and their estimated parameters, with the correlation coefficient R2, are illustrated in Table 3. Based on the values of R2, the kinetics of phosphate adsorption on E33 and modified E33 can be satisfactorily described by both the pseudo-second-order equation and the simple Elovich equation; thus, Fig. 6 has both equations plotted also. The apparent applicability of the Elovich equation, which was originally developed to describe chemisorption of gases on heterogeneous solid surfaces,61 suggests that the sorption sites involved in phosphate sorption are also of a heterogeneous nature. Obtained results were generally in agreement with other results from the literature and can properly explain the kinetics of phosphate adsorption onto commonly found soil minerals such as goethite.62–64
| Power function equation (q = atb) | |||
| a | b | R 2 | |
| E33 | 8.259 | 0.1715 | 0.8718 |
| E33/Mn | 6.396 | 0.1793 | 0.9464 |
| E33/AgI | 5.728 | 0.2288 | 0.9343 |
| E33/AgII | 8.139 | 0.1742 | 0.8817 |
Simple Elovich equation (q = a + b![[thin space (1/6-em)]](https://www.rsc.org/images/entities/char_2009.gif) ln ln![[thin space (1/6-em)]](https://www.rsc.org/images/entities/char_2009.gif) t) t) |
|||
| a | b | R 2 | |
| E33 | 8.228 | 2.071 | 0.9600 |
| E33/Mn | 6.513 | 1.619 | 0.9894 |
| E33/AgI | 5.895 | 2.045 | 0.9645 |
| E33/AgII | 8.130 | 2.070 | 0.9645 |
| Pseudo second-order equation (qt = k2qe2t/1 + k2qet) | |||
| q e,cal | k 2 (g mg−1 min−1) | R 2 | |
| E33 | 16.34 | 0.0641 | 0.9725 |
| E33/Mn | 13.74 | 0.0645 | 0.9021 |
| E33/AgI | 15.46 | 0.0272 | 0.9547 |
| E33/AgII | 16.31 | 0.0616 | 0.9639 |
where c0 is the initial concentration (mg L−1), c* is the equilibrium concentration (mg L−1), V is the solution volume (L), and m is the adsorbent mass in grams. Table 1 illustrates the phosphate adsorption capacity of a wide range of adsorbents including metal oxides, red mud, steel slag, and fly ash, as well as E33 and modified E33. The most efficient adsorbents were the Nanshi-modified zeolite, the Nanshi-modified fly ash, and Fe-loaded biomass char. However, the stock solution influent pH for these adsorbents was maintained atypically low (pH 3 and 4) to promote enhanced adsorption. At neutral pH, E33/AgII had a phosphate adsorption capacity of 28.0 mg PO43− g−1. This was slightly higher than that of the unmodified E33 (26.3 mg PO43− g−1), likely due to the increased BET surface area of the E33/AgII sample. The capacities from this study compare favorably with the capacities of other adsorbents as reported in literature.
Adsorption isotherms are used to relate the bulk adsorbate concentration and the amount adsorbed at the surface interface. The isotherm results were analyzed using the Langmuir and Freundlich isotherms. The Langmuir isotherm model, which assumes monolayer saturation with no lateral interaction between adsorbed particles, has previously been employed in similar adsorption experiments.62–64 The Langmuir adsorption model is mathematically expressed by:
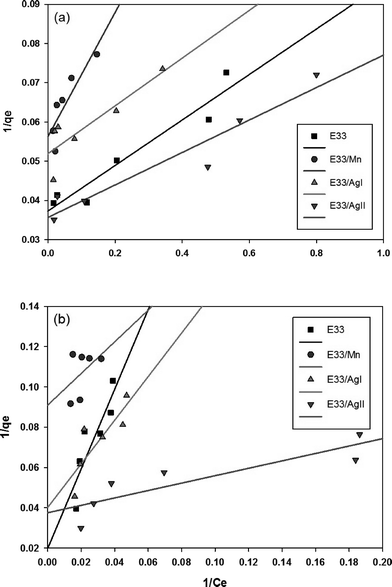
The linear plot of the above equation (Fig. 8) yields essential specifications of the system. The slope and intercept of the plot were used to determine the Langmuir constants Qmax and KL, which are presented in Table 4.
| Sample | Langmuir isotherm constants | Freundlich isotherm constants | ||||
|---|---|---|---|---|---|---|
| Q max (mg g−1) | K L (dm3 mg−1) | R 2 | K F | 1/n | R 2 | |
| E33 | 25.71 | 0.82 | 0.9999 | 14.72 | 0.15 | 0.7389 |
| E33/Mn | 18.73 | 0.24 | 0.9836 | 9.59 | 0.15 | 0.8133 |
| E33/AgI | 20.58 | 0.36 | 0.9642 | 12.87 | 0.10 | 0.6718 |
| E33/AgII | 28.01 | 0.69 | 0.9917 | 15.75 | 0.15 | 0.7893 |
Essential characteristics of the Langmuir isotherm model can be expressed in terms of a constant dimensionless separation factor, RL, given by the equation:
The Freundlich isotherm is an empirical equation used to explain heterogeneous systems. The Freundlich equation is given by:
| qe = KF(Ce)1/n |
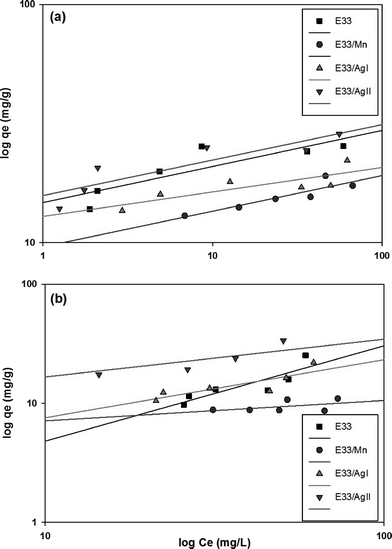
Values of KF and n can be determined from the intercept and slope of the plot for the linearized Freundlich equation. The linearized Freundlich isotherm plots for phosphate adsorption onto E33 and modified E33 are presented in Fig. 9. The Freundlich isotherm constants, KF and 1/n, were determined by linear regression (Table 4).
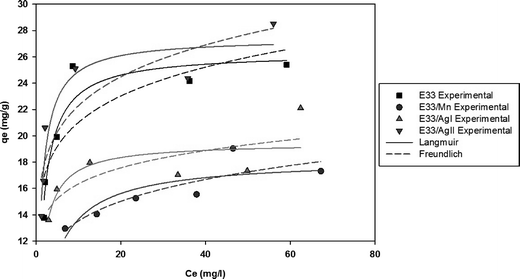
Fig. 10 shows phosphate adsorption isotherms for E33 and modified E33 under identical conditions, i.e. DI water at pH 7. The results show that E33/AgII had the highest capacity of phosphate adsorption for the modified adsorbents as well as unmodified E33. This is in accordance with BET surface area analysis, which revealed that E33/AgII had the highest specific surface area. Likewise, E33/Mn, which had the lowest phosphate adsorption capacity, also had the lowest BET surface area. Isotherm results were evaluated using both Langmuir and Freundlich isotherm equations. The determined isotherm constants for both models are summarized in Table 4. As can be seen from the coefficients of determination, the Langmuir isotherm appears better suited to explain the adsorption equilibrium data.
4. Conclusion
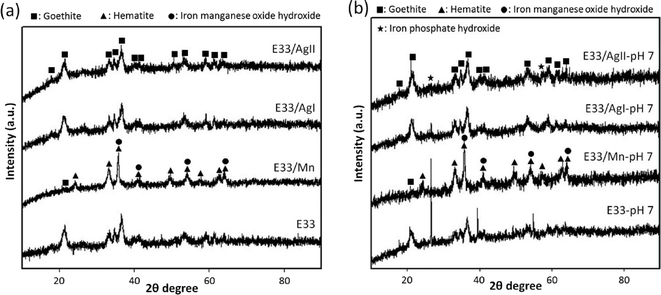
Three modified adsorbents, based on the commercially available E33 adsorptive medium, were successfully synthesized and characterized using SEM, TEM, XRD, porosimetry analysis and EDX. The adsorption capacity of the synthesized samples was investigated for the removal of phosphate. The results of the characterization of synthesized samples indicated that the surface of E33 was successfully modified with nanostructured Ag and manganese. In particular, for Ag-modified E33, the phase of E33 was not affected by Ag modification while the transformation of goethite to hematite was observed in Mn-modified E33.Batch and column experiments were conducted to determine the adsorbents' capacity for phosphate adsorption. The phosphate removal was influenced by the pH of solutions. As the solution pH decreased, the amount of phosphate adsorbed increased, presumably because the surface charge of E33 is pH dependent, thus lower pH values correlate to a more positive surface charge on the E33, thus promoting increased PO43− adsorption. Of the modified adsorbents synthesized, Ag-modified E33 using tea extract (E33/AgII) had a slightly higher phosphate adsorption capacity compared to unmodified E33. This increase in adsorptive capacity is likely due to an increased BET surface area for E33/AgII. Although Mn-modified E33 (E33/Mn) was believed to promote increased adsorption, a reduction in BET surface area (likely caused by the aggregation of particles resulting in a spherical shape for the E33/Mn particles as revealed by TEM) resulted in a pore blockage and lower phosphate adsorption capacity when compared to unmodified E33. The increased adsorption for E33/AgII suggests the potential for improving the performance of commercially available adsorbents for phosphate removal.
References
- E. Metcalf, Wastewater engineering: treatment, disposal and reuse, McGraw-Hill, New York, 1991 Search PubMed.
- H. L. Golterman, Water Res., 1973, 7, 3–17 CrossRef.
- J. J. Schröder, A. L. Smit, D. Cordell and A. Rosemarin, Chemosphere, 2011, 84, 822–831 CrossRef PubMed.
- A. Sendrowski and T. H. Boyer, Desalination, 2013, 322, 104–112 CrossRef CAS PubMed.
- Y. Liu, G. Villalba, R. U. Ayres and H. Schroder, J. Ind. Ecol., 2008, 12, 229–247 CrossRef CAS PubMed.
- G. Villalba, Y. Liu, H. Schroder and R. U. Ayres, J. Ind. Ecol., 2008, 12, 557–569 CrossRef PubMed.
- M. Meybeck, Am. J. Sci., 1982, 282, 401–450 CrossRef CAS.
- H. Holtan, L. Kamp-Nielsen and A. O. Stuanes, Hydrobiologia, 1988, 170, 19–34 CrossRef CAS.
- Phosphorus in environmental technologies: Principles and applications, ed. E. Valsami-Jones, IWA Publishing, London, UK, 2004 Search PubMed.
- S. Pitois, M. H. Jackson and B. J. Wood, J. Environ. Health, 2001, 64, 25–32 CAS.
- G. R. Mohan, S. Gadekar and P. Pullammanappallil, Florida Water Resources Journal, 2011, 17–22 Search PubMed.
- G. R. Mohan, P. Dube, A. MacFarlene and P. Pullammanappallill, in Materials challenges in alternative and renewable energy II: Ceramic transactions, ed. G. Wicks, J. Simon, R. Zidan, R. Brigmon, G. Fischman, S. Arepalli, A. Norris and M. McCluer, John Wiley & Sons, Inc., Hoboken, New Jersey, 2013, vol. 242, pp. 47–58 Search PubMed.
- J. Hrenovic, M. Rozic, L. Sekovanic and A. Anic-Vucinic, J. Hazard. Mater., 2008, 156, 576–582 CrossRef CAS PubMed.
- A. Drews, H. Evenblij and S. Rosenberger, Environ. Prog., 2005, 24, 426–433 CrossRef CAS.
- K. Karageorgiou, M. Paschalis and G. N. Anastassakis, J. Hazard. Mater., 2007, 139, 447–452 CrossRef CAS PubMed.
- T. Liu, K. Wu and L. Zeng, J. Hazard. Mater., 2012, 217, 29–35 CrossRef PubMed.
- P. Delaney, C. McManamon, J. P. Hanrahan, M. P. Copley, J. D. Holmes and M. A. Morris, J. Hazard. Mater., 2011, 185, 382–391 CrossRef CAS PubMed.
- S. Y. Yoon, C. G. Lee, J. A. Park, J. H. Kim, S. B. Kim, S. H. Lee and J. W. Choi, Chem. Eng. J., 2014, 236, 341–347 CrossRef CAS PubMed.
- X. Cheng, X. Huang, X. Wang, B. Zhao, A. Chen and D. Sun, J. Hazard. Mater., 2009, 169, 958–964 CrossRef CAS PubMed.
- N. Boujelben, J. Bouzid, Z. Elouear, M. Feki, F. Jamoussi and A. Montiel, J. Hazard. Mater., 2008, 151, 103–110 CrossRef CAS PubMed.
- S. L. Wang, C. Y. Cheng, Y. M. Tzou, R. B. Liaw, T. W. Chang and J. H. Chen, J. Hazard. Mater., 2007, 147, 205–212 CrossRef CAS PubMed.
- H. Zhou, Z. Jiang and S. Wei, Journal of Chemistry, 2013, 2013, 649868 Search PubMed.
- A. Bhatnagar, V. J. Vilar, C. M. Botelho and R. A. Boaventura, Environ. Technol., 2011, 32, 231–249 CrossRef CAS PubMed.
- Q. Yue, Y. Zhao, Q. Li, W. Li, B. Gao, S. Han and H. Yu, J. Hazard. Mater., 2010, 176, 741–748 CrossRef CAS PubMed.
- P. Castaldi, M. Silvetti, G. Garau and S. Deiana, J. Hazard. Mater., 2010, 182, 266–272 CrossRef CAS PubMed.
- Y. Li, Y. Liu and G. Du, Proceedings of Bioinformatics and biomedical engineering (iCBBE), 4th International Conference, Chengdu, 2010 Search PubMed.
- J. Xiong, Z. He, Q. Mahmood, D. Liu, X. Yang and E. Islam, J. Hazard. Mater., 2008, 152, 211–215 CrossRef CAS PubMed.
- A. Drizo, C. Forget, R. P. Chapuis and Y. Comeau, Water Res., 2006, 40, 1547–1554 CrossRef CAS PubMed.
- S. Yao, J. Li and Z. Shi, Adsorpt. Sci. Technol., 2009, 27, 603–614 CrossRef CAS PubMed.
- J. Chen, H. Kong, D. Wu, Z. Hu, Z. Wang and Y. Wang, J. Colloid Interface Sci., 2006, 300, 491–497 CrossRef CAS PubMed.
- K. Mohanty, D. Das and M. N. Biswas, Adsorption, 2006, 12, 119–132 CrossRef CAS PubMed.
- W. Jiang, J. Lv, L. Luo, K. Yang, Y. Lin, F. Hu and S. Zhang, J. Hazard. Mater., 2013, 262, 55–63 CrossRef CAS PubMed.
- H. Liu, T. Chen, X. Zou, Q. Xie, C. Qing, D. Chen and R. L. Frost, Chem. Eng. J., 2013, 234, 80–87 CrossRef PubMed.
- J. Xi and M. He, Water Qual. Res. J. Can., 2013, 48, 223–231 CrossRef CAS.
- S. Aredes, B. Klein and M. Pawlik, J. Cleaner Prod., 2012, 29, 208–213 CrossRef PubMed.
- W. Stumm, in Chemistry of the solid-water interface: processes at the mineral-water and particle-water interface in natural systems, John Wiley & Son Inc., 1992, p. 428 Search PubMed.
- A. Jain, K. P. Raven and R. H. Loeppert, Environ. Sci. Technol., 1999, 33, 1179–1184 CrossRef CAS.
- B. Zhong, R. Stanforth, S. Wu and J. P. Chen, J. Colloid Interface Sci., 2007, 308, 40–48 CrossRef CAS PubMed.
- J. Torrent, V. Barron and U. Schwertmann, Soil Sci. Soc. Am. J., 1990, 54, 1007–1012 CrossRef.
- R. Strauss, G. W. Brümmer and N. J. Barrow, Eur. J. Soil Sci., 1997, 48, 101–114 CrossRef CAS PubMed.
- I. R. Willett, C. J. Chartres and T. T. Nguyen, J. Soil Sci., 1988, 39, 275–282 CrossRef CAS PubMed.
- R. Strauss, G. W. Brümmer and N. J. Barrow, Eur. J. Soil Sci., 1997, 48, 87–99 CrossRef CAS PubMed.
- L. Sigg and W. Stumm, Colloids Surf., 1981, 2, 101–117 CrossRef CAS.
- R. L. Parfitt, R. J. Atkinson and R. S. C. Smart, Soil Sci. Soc. Am. J., 1975, 39, 837–841 CrossRef CAS.
- M. Nanzyo, Soil Sci. Plant Nutr., 1986, 32, 51–58 CrossRef CAS.
- T. Hiemstra and W. H. Van Riemsdijk, J. Colloid Interface Sci., 1996, 179, 488–508 CrossRef CAS.
- J. S. Geelhoed, T. Hiemstra and W. H. Riemsdijk, Environ. Sci. Technol., 1998, 32, 2119–2123 CrossRef CAS.
- J. R. Rustad, A. R. Felmy and B. P. Hay, Geochim. Cosmochim. Acta, 1996, 60, 1563–1576 CrossRef CAS.
- M. N. Nadagouda and D. A. Lytle, J. Nanotechnol., 2011, 2011 DOI:10.1155/2011/972486.
- M. N. Nadagouda, C. Bennett-Stamper, C. White and D. A. Lytle, RSC Adv., 2012, 2, 4198–4204 RSC.
- M. Kanematsu, T. M. Young, K. Fukushi, P. G. Green and J. L. Darby, Environ. Sci. Technol., 2010, 44, 3388–3394 CrossRef CAS PubMed.
- M. Kanematsu, T. M. Young, K. Fukushi, D. A. Sverjensky, P. G. Green and J. L. Darby, Environ. Sci. Technol., 2010, 45, 561–568 CrossRef PubMed.
- A. Sperlich, Ph. D. Thesis, University of Berlin, 2010 Search PubMed.
- J. Murphy and J. P. Riley, Anal. Chim. Acta, 1962, 27, 31–36 CrossRef CAS.
- C. Han, V. Likodimos, J. A. Khan, M. N. Nadagouda, J. Anderson, P. Falaras, P. Rosales-Lombardi and D. D. Dionysiou, Environ. Sci. Pollut. Res., 2014, 21, 11781–11793 CrossRef CAS PubMed.
- J. Akai, K. Akai, M. Ito, S. Nakano, Y. Maki and I. Sasagawa, Am. Mineral., 1999, 84, 171–182 CAS.
- J. N. Park, J. K. Shon, M. Jin, S. H. Hwang, G. O. Park, J. H. Boo, T. H. Han and J. M. Kim, Chem. Lett., 2010, 39, 93–495 CrossRef.
- Q. Javed, F. P. Wang, M. Y. Rafique, A. M. Toufiq, Q. S. Li, H. Mahmood and W. Khan, Nanotechnology, 2012, 23, 415603 CrossRef CAS PubMed.
- G. Yang, W. Yan, J. Wang and H. Yang, CrystEngComm, 2014, 16, 6907–6913 RSC (ESI).
- P. Asanithi, S. Chaiyakun and P. Limsuwan, J. Nanomater., 2012, 2012, 79 CrossRef PubMed.
- M. J. D. Low, Chem. Rev., 1960, 60, 267–312 CrossRef CAS.
- L. Zeng, X. Li and J. Liu, Water Res., 2004, 38, 1318–1326 CrossRef CAS PubMed.
- X. Wang, F. Liu, W. Tan, W. Li, X. Feng and D. L. Sparks, Soil Sci., 2013, 178, 1–11 CrossRef CAS.
- O. K. Borggaard, J. Soil Sci., 1983, 34, 333–341 CrossRef CAS PubMed.
Footnotes |
| † The U.S. Environmental Protection Agency, through its Office of Research and Development, funded and managed, or partially funded and collaborated in, the research described herein. It has been subjected to the Agency's administrative review and has been approved for external publication. Any opinions expressed in this paper are those of the author(s) and do not necessarily reflect the views of the Agency, therefore, no official endorsement should be inferred. Any mention of trade names or commercial products does not constitute endorsement or recommendation for use. |
| ‡ Electronic supplementary information (ESI) available. See DOI: 10.1039/c4ew00020j |
| This journal is © The Royal Society of Chemistry 2015 |

