
Atmospheric 210Pb as a tracer for soil organic carbon transport in a coniferous forest
Mengistu T.
Teramage
*ab,
Yuichi
Onda
a,
Yoshifumi
Wakiyama
c,
Hiroaki
Kato
a,
Takashi
Kanda
d and
Kenji
Tamura
d
aGraduate School of Life and Environmental Sciences, Department of integrative environmental science, University of Tsukuba, 305-8572, Ibaraki, Japan. E-mail: teramaget@yahoo.com
bHawassa University, College of Agriculture, P.O.Box 5, Hawassa, Ethiopia
cTerrestrial Environment Research Centre, University of Tsukuba, 305-8577, Ibaraki, Japan
dGraduate School of Life and Environmental Sciences, Department of Environmental soil chemistry, University of Tsukuba, 305-8577, Ibaraki, Japan
First published on 11th November 2014
Abstract
Core soils and falling litter samples were collected in a Japanese cypress forest (Chamaecyparis obtusa) to determine the litter-fed 210Pbex and organic carbon transfer from the forest canopy to soil and their subsequent distribution. Of the canopy residing 210Pbex pool, litterfall annually transports 53% to the forest floor while it adds 117 g m−2 per year of organic carbon to the forest soil, implying that litterfall dynamics can influence the distribution of 210Pbex and soil organic carbon (SOC). 210Pbex and SOC showed identical profile shapes and strong correlation in spatial as well as along the soil depth, indicating that both are affected by a similar process. Given the ubiquitous natural source of 210Pbex, it is plausible to infer that radiolead can be a possible tracer to study the SOC redistribution at regional and global scales.
Environmental impactThe comparable distribution of SOC and 210Pbex throughout the observed hillslope demonstrates that both are affected by similar processes, such as erosion. Erosion is therefore an important process that could affect the equilibrium of both SOC and 210Pbex distribution. Hence, the ubiquitous tracer, 210Pbex, ratio could feasibly provide information that helps to identify the contamination load and intensity of litter-fed 210Pbex on valuable resources in the downstream. Such information can aid in developing mechanisms to minimize the likely effects of soil erosion driven contaminants on downstream resources, specifically, on water resources given that most of the world's forests are located in mountainous and hillslope areas. |
1. Introduction
Lead-210 (210Pb) is a naturally occurring radionuclide with a half-life (t1/2) of 22.3 years and a mean nuclear lifetime (t1/2/ln![[thin space (1/6-em)]](https://www.rsc.org/images/entities/char_2009.gif) 2) of 32.2 years. 210Pb is a direct α-decay progeny of 222Rn (t1/2 = 3.8 days) that is formed in the 238U (t1/2 = 4.5 × 10⁹ years) decay chain, which is found in almost all soils.1–3 When 222Rn decays to a series of short-lived (t1/2 = 104 μs − 26.8 min) progenies, it eventually produces the long-lived isotope of 210Pb through α-decay. 210Pb is produced in situ in the soil pores and ex situ in the atmosphere when 222Rn is released from solid soil particles through α-recoil and diffusion along concentration gradients. To differentiate atmospheric 210Pb from its terrigenous species (also called “supported 210Pb”), the term “unsupported 210Pb” or 210Pb in excess (hereafter expressed as 210Pbex or radiolead unless stated otherwise) is used. Because 210Pbex rapidly attaches to aerosols, it immediately participates in mixing and transport processes in the atmosphere. It is then re-deposited with tagged aerosols to the soil surface by dry and wet deposition within 5 to 10 days.2,4
2) of 32.2 years. 210Pb is a direct α-decay progeny of 222Rn (t1/2 = 3.8 days) that is formed in the 238U (t1/2 = 4.5 × 10⁹ years) decay chain, which is found in almost all soils.1–3 When 222Rn decays to a series of short-lived (t1/2 = 104 μs − 26.8 min) progenies, it eventually produces the long-lived isotope of 210Pb through α-decay. 210Pb is produced in situ in the soil pores and ex situ in the atmosphere when 222Rn is released from solid soil particles through α-recoil and diffusion along concentration gradients. To differentiate atmospheric 210Pb from its terrigenous species (also called “supported 210Pb”), the term “unsupported 210Pb” or 210Pb in excess (hereafter expressed as 210Pbex or radiolead unless stated otherwise) is used. Because 210Pbex rapidly attaches to aerosols, it immediately participates in mixing and transport processes in the atmosphere. It is then re-deposited with tagged aerosols to the soil surface by dry and wet deposition within 5 to 10 days.2,4
In forested environments, 210Pbex can reach the forest floor directly through litterfall, rainwater (throughfall and stemflow) and dry deposition between canopy openings, similar to other land use systems. However, Dorr2 found that the 210Pb inventory in the forest is approximately six times higher than in meadow sites. This may be due to the large interception areas provided by leaves, twigs and branches, which deem forests an important sink and removal zone of atmospheric aerosols (210Pbex in particular). For example, Stankwitz et al.5 demonstrated that canopy scavenging (particularly coniferous canopy) of radiolead from cloud water is large; the process becomes especially efficient and significant at high elevations. This suggests that the forest canopy intercepts and retains most atmospheric 210Pbex deposition for a short time (short stay) and transfers it to the ground surface through litterfall. This unique process directs most radionuclide-based studies to agricultural areas, which involve simple land use systems.6 Few studies have explored the transfer, behavior and deposition of 210Pbex and other atmospheric radionuclides in coniferous, broadleaved forests and grasslands, which focus on wet (rain water) deposition mechanisms.3,7,8 However, little is known about the contribution of the litterfall pathway.
Deposition of the forest litter and its subsequent complex biogeochemical processes determine the chemical capital and quality of the forest soil. It is also the primary aboveground input source of soil organic carbon (SOC) and numerous other chemical elements (nutrients and contaminants) that are closely related to atmospheric carbon dioxide levels (climate change), soil quality (productivity) and environmental health (sanitation). Therefore, litterfall could function as a primary mechanism of canopy-trapped 210Pbex deposition to the forest soil. In soil, as several studies have shown, 210Pbex has a strong association with organic matter for which the litter input is the main source. Lewis9 showed that the atmospheric flux of 210Pbex is efficiently scavenged by organic-rich horizons of soil and is only lost from the system by soil erosion. Other studies found a dependence of 210Pbex movement on organic matter, which acts as a physical carrier.2,10–12 Vaaramaa et al.13 confirmed that the association of 210Pbex with humic substances in Scots pine dominated the forest soil in Finland. Apparently, soil organic matter (SOM) itself is a mixture of various chemical compounds that are dominated by organo-carbon functional groups to which 210Pbex and other organo-metallic complexes are more likely fixed on. However, little is known about radiolead deposition, redistribution and its relationship with SOC in a forested environment.
Soil erosion from hillslopes can adversely affect onsite and offsite resources.14 Using the 137Cs technique, Ritchie et al.15 have shown that SOC tends to accumulate in soils of depositional areas (e.g., concave slopes and bottom slopes), and it decreases as the gradient slope increases. This implies that, besides on-site effects, soil erosion can transport a considerable amount of eroded materials, including SOC and radiolead, which could damage waterways, reservoirs, rivers, streams, lakes, riparian zones and estuarine, aquatic and marine environments that may add to the cost of water treatment.16,17 The problem is more likely pronounced in those water networks that are close enough to steep slopes with poor surface cover landforms, such as those of the study site. However, soil erosion as an atmospheric carbon sink or source is still unsolved. For example, some studies reported erosion as a carbon sink that can somewhat offset fuel carbon emission19 while other studies reject both notions.20 This implies that the existing state of knowledge is not adequate and requires further research. In line with this, there is an increasing demand by many international environmental programs18 to accurately assess the unsolved dilemma of soil erosion as carbon sinks or sources which in turn urges for more appropriate tools and approaches. Recently, Teramage et al.21 demonstrated a stronger affinity between SOC and 210Pbex than between SOC and 137Cs during surface soil erosion in a forested hillslope environment. Therefore, we hypothesized that understanding the behavior and distribution of radiolead can be used as a possible diagnostic tool to study the SOC dynamics on forested hillslopes at various scales.
Thus, this study (1) investigated the role of litter continuum in transferring atmospheric radiolead to the coniferous forest soil and (2) determined the depth distribution behavior of 210Pbex and quantified its relationship with SOC in the soil matrix.
2. Materials and methods
2.1. Site description
Samples were collected downstream of the Tsuzura River sub-basin in Kochi prefecture, southern Japan (33°10′N, 132°57′E) (Fig. 1) in 2010. The climate of the area is classified as temperate monsoon humid. The mean annual rainfall is 2735 mm and the temperature is 14.6 °C. The elevation of the watershed ranges from 175 m to 560 m asl. Brown forest soil is dominant in the watershed, which was formed in situ from sedimentary rock and alternate mudstone and sandstone layers. The bedrock mainly consists of sedimentary rocks from the Shimanto belt. The forest consists of Japanese cypress species (Chamaecyparis obtusa Sieb. Et Zucc.) planted between 1965 and 1969. The stand density was estimated to be 1400–2750 stems per ha, and the forest floor was lightly covered by undergrowth during the study period.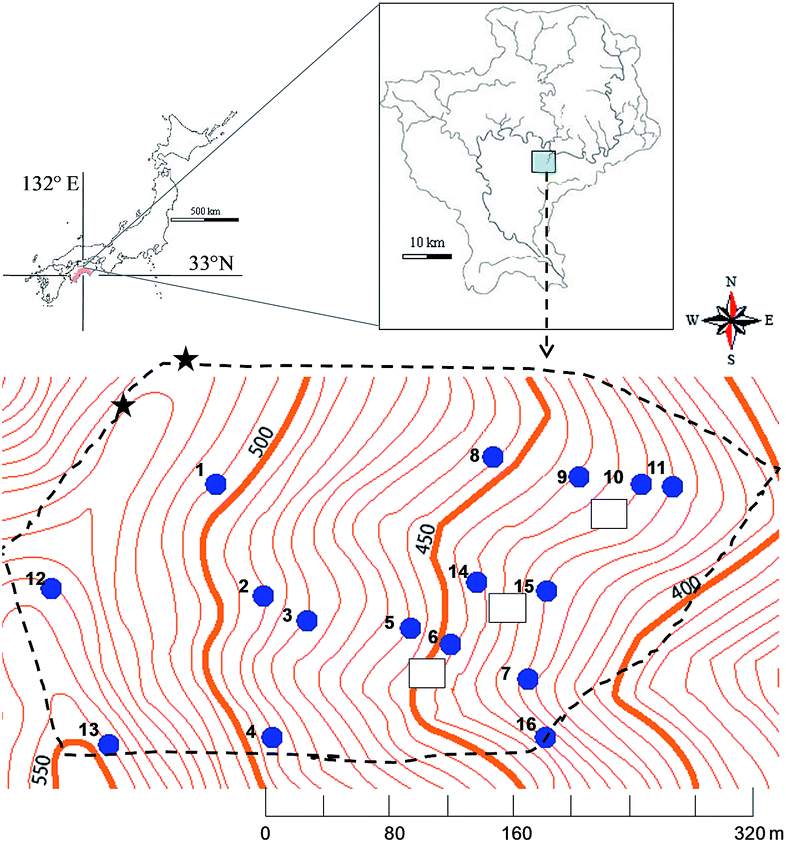 | ||
| Fig. 1 Map of the study site and the position of the sampling points (filled circles), litter traps (squares) and location of reference sites (filled stars). | ||
2.2. Data collection and analysis
Three litter traps (1 m2 each) were suspended one meter above the ground in representative regions of the catchment to monitor annual litterfall. The 210Pbex and organic carbon proportions in litter were measured to estimate 210Pbex and carbon input into the forest soil by the falling litter. To determine the vertical soil profiles of 210Pbex and SOC in the study catchment, 16 composited core soil samples were collected (i.e., three cores per sampling point were collected to account for spatial variability, which totaled 48 cores). Many studies have used a 30 cm depth to fully describe the 210Pbex depth distribution.6,22,23 In this study, therefore the core samples were collected using the manual percussion of a steel core tube (with an internal diameter of 5 cm and a length of 30 cm) vertical to the ground. The cores were sliced in incremental depth classes of 0–2, 2–5, 5–10 and 10–30 cm to examine the vertical distributions of 210Pbex and SOC. The three replicate cores that were taken from each sampling point were mixed together at the same depth classes to form a better representation of the sampling points.The soil samples were oven dried at 110 °C for 24 h, gently grinded to disaggregate the soil and passed through a 2 mm sieve. A representative soil fraction from a less than 2 mm soil portion of each sample was then placed in a plastic bin, sealed and stored for 21 days prior to the assay to achieve equilibrium between 226Ra and its daughter 222Rn to measure 214Pb. Corrections were then made for the in situ produced 210Pb by subtracting the 214Pb from the total 210Pb to quantify the atmospheric 210Pbex. The analysis was conducted in the laboratory of the University of Tsukuba, which was authorized for independent calibration checks during the worldwide open proficiency test in 2006 (IAEA/AL/171) that was prepared by the International Atomic Energy Agency (IAEA). The activities were determined by gamma ray spectrometry using a high purity n-type germanium coaxial gamma ray detector (EGC 25-195-R, Canberra-Eurisys, Meriden, USA) connected to an amplifier (PSC822, Canberra, Meriden, USA) and a multichannel impulse separator (DSA1000, Canberra, Meriden, USA). The absolute counting efficiency of the detector and self-absorption of the sample itself were calibrated and corrected using various weights of IAEA-2006-03 standard soil samples with background corrections. The specific activities (Becquerel per kilogram, Bq kg−1) were obtained based on their gamma radiation at 46.5 keV (210Pb), 351.9 keV (214Pb) and 609.3 keV (214Bi) using n-type coaxial low-energy HPGe gamma detectors with an efficiency of 30% at the University of Tsukuba (Tsukuba City, Japan). The counting times for each packed soil sample were between 43200 and 86400 s to obtain a better accuracy (∼±10%). The measured activities (Bq kg−1) were converted to inventories (Bq m−2) using the dry mass depths (kg m−2) of the <2 mm soil samples from each sampling layer.
Radioactivity in the litter was computed by converting the litter to ash under gradually increasing temperatures (120 °C for 16 h, 200 °C for 1 h, 300 °C for 30 minutes and steady at 450 °C for 4 h) using a fully automatic muffle electric furnace (Ikeda, Scientific Co. LTD). The black ash was then pulverized using a mortar and pestle, put into a plastic bin, and gently compacted to increase its stability and density prior to the assay. The activities were directly performed using similar procedures as described above, except they were not stored for 21 days as that of the soil samples.
The corresponding SOC for each soil sample and litter was measured directly under high-temperature combustion using a fully automatic high sensitivity nitrogen–carbon (NC) analyzer (SumGraph NC-900). Acetanilide (C8H9NO), which is composed of 71.09% (C), 11.84% (O), 10.36% (N) and 6.71% (H), was used as the standard to calibrate the instrument. The total soil carbon was considered to be the SOC because the soil pH value is considerably less than 7. Hence, free carbonate was not expected to be found in the soil, and therefore the soil was not pre-treated with acid.
2.3. Local reference inventory of 210Pbex and its annual flux
The inventory (Irefe) from an undisturbed flat site (where 210Pbex deposition is preserved) was adopted from the literature23 which has been measured and analysed in the similar manner as of our samples (see Section 2.2). As indicated there, the reference samples were collected on the ridge top of the study watershed (Fig. 1) and used to determine the annual 210Pbex flux (a) deposited on the forest canopy (see below). In a closed forest canopy, we assumed that all atmospheric 210Pbex flux (a) was deposited on the forest canopy, reduced by decay, transferred and reached the soil through depositional mechanisms (wet, dry and litterfall). We assumed that this process was conserved over extended periods of time and that the canopy accumulated radiolead for a specific amount of time, which is referred to as the mean residence time (MRT).3. Results and discussion
3.1. Inverted U-shaped bi-box compartment model
An inverted U-shape represents the general concept that 222Rn is diffused from the soil to the soil-atmosphere interface, lifted and mixed up (depending on the aerodynamic momentum), subject to a series of decay processes to yield 210Pbex and then falls back to the soil at any length of scale. The direction of the arrows indicates the shape of the flows but they do not only reflect the direction specified in the model sketch. Rather it indicates a single flow path which exists among innumerable complex directions to yield the simplest and most perceivable model representation. This local fallout model could be affected by the long distance movement of 210Pbexvia wind across the specific study site. However, we assumed that the inflow and outflow of atmospheric 210Pbex from the study site are counterbalanced to maintain the local equilibrium.
In the soil, radiolead is typically lost through physical decay and/or is displaced mechanically by erosion. The process is still represented as an inverted-U shape because it does not form a complete cycle; plant roots rarely absorb 210Pbex as indicated in some studies. For example, Osaki et al.7 reported that 210Pbex is not found in the xylem tissue of cedar trees because it is a heavy metal that is tightly fixed to soil particles, unlike 137Cs. Therefore, the absorption of 210Pb by trees is almost negligible, which the inverted U-shaped model accurately explains.
The second component of the model is the bi-box compartment. To determine the input of 210Pbex through the litter to the forest soil, we created two ideal (but practically inseparable) transfer boxes. These transfer boxes allowed us to follow a step-wise pattern to estimate each subsequent depositional flux. Initially, the atmosphere was considered the feeder, and the canopy was considered the receiver. In the second step, the canopy was considered the feeder, and the forest floor was considered the receiver. Over longer periods of time, these depositional groups achieved their own respective equilibrium. The schematic diagram of the conceptual model is illustrated in Fig. 2.
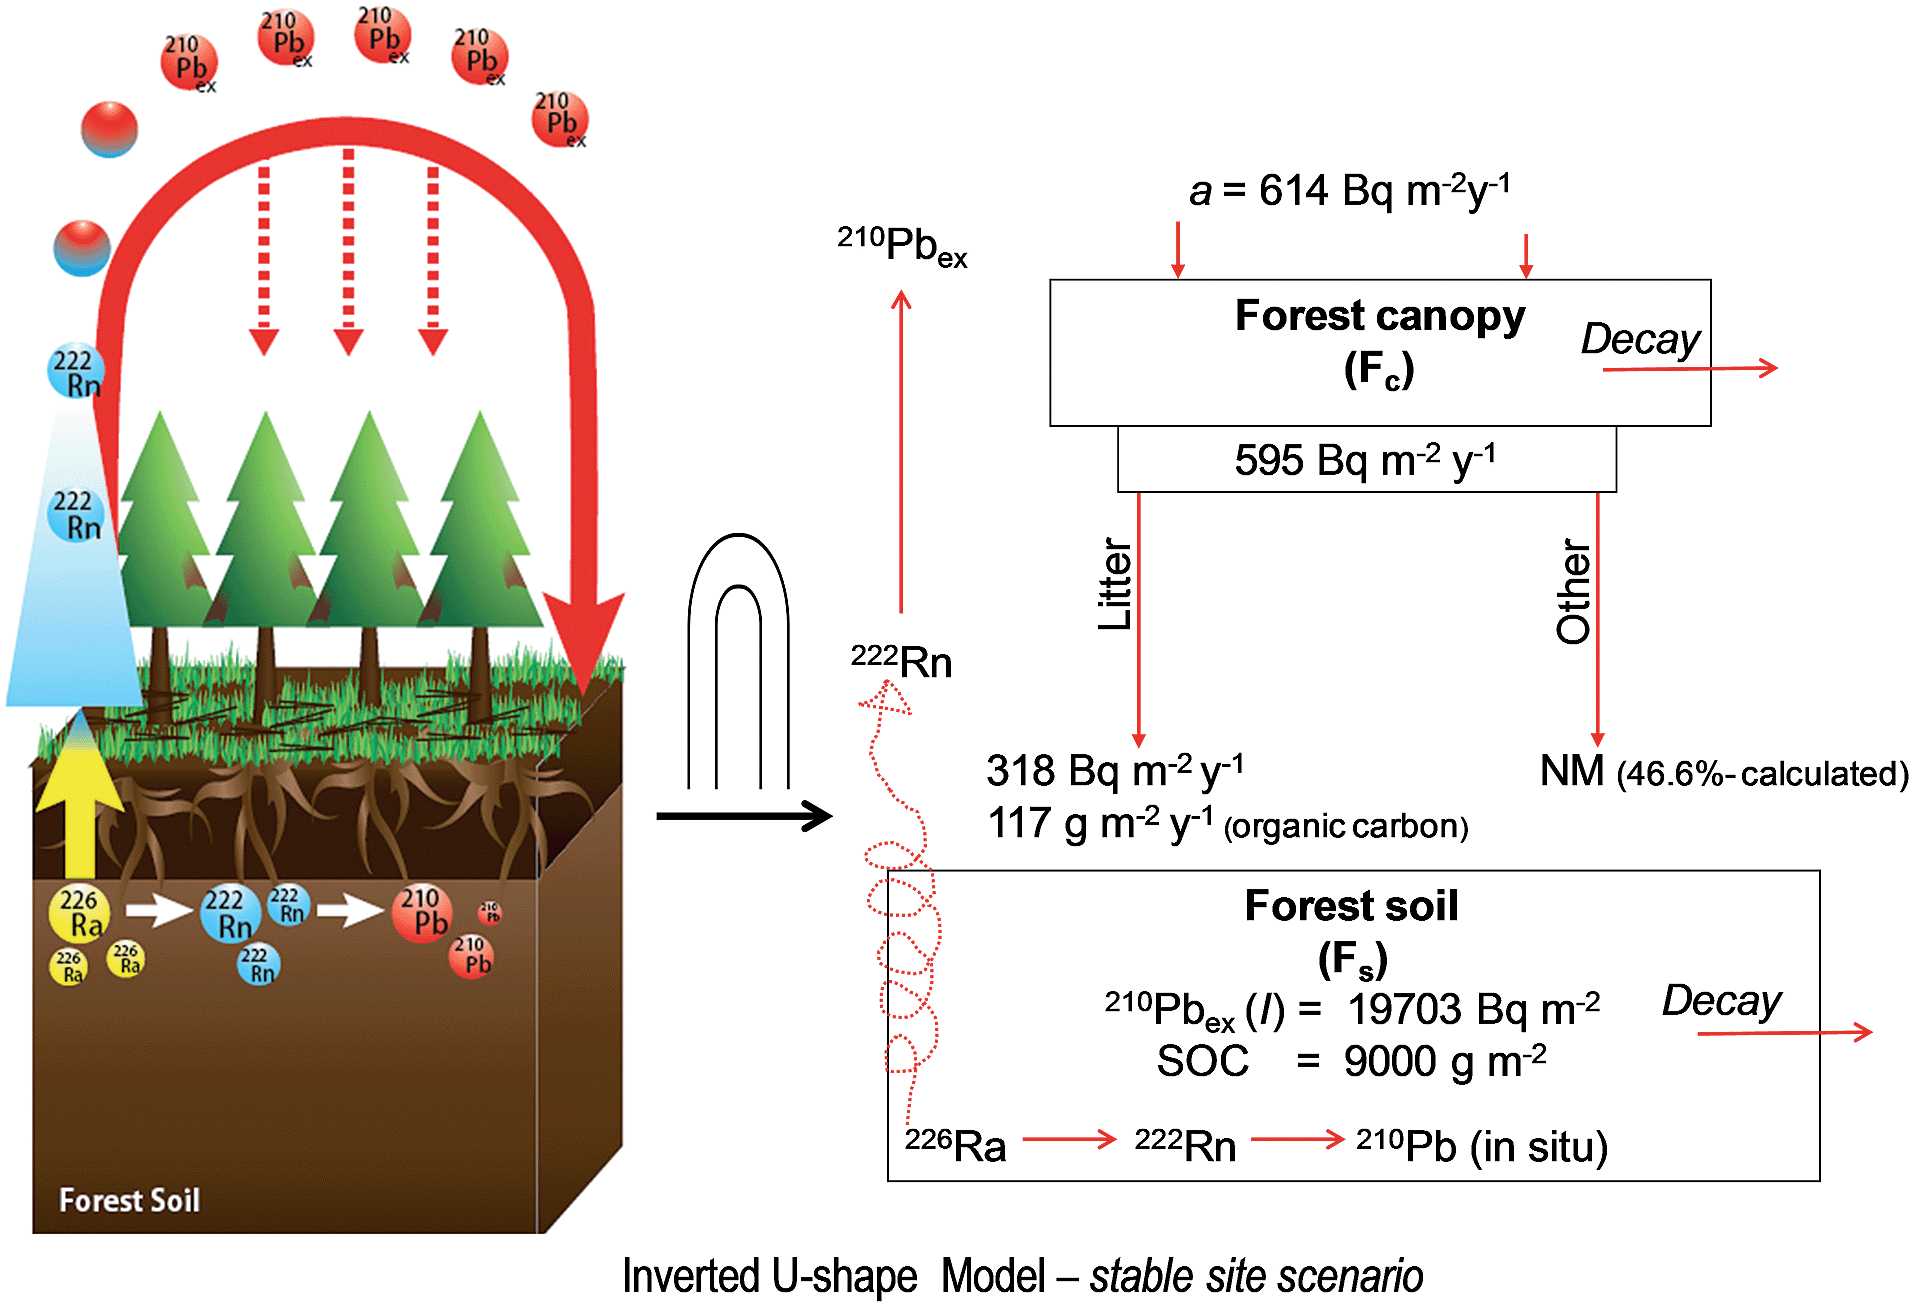 | ||
| Fig. 2 Inverted U-shaped 210Pbex model for the stable site scenario. The model illustrates the pathways and the fates of atmospheric 210Pbex in the reference site. The simplified framework of the model is shown in the right side and the indicated values are calculated based on the assumption discussed in the text. | ||
703 ± 5517 Bq m−2 to study the soil erosion process for the same Japanese cypress forest hillslope. It was calculated from the area-weighted mean of 15 core samples (19.6 cm2 each) and 2 scraper (450 cm−2 each) soil samples to account for the sampling area difference between the core and scraper samplers. The coefficient of variation for the core samples was 28%. The authors stated that the reference sites were located on flat ridge top of the watershed (Fig. 1) under matured coniferous tree canopies. The ground was covered with litter and the vegetation was dominated by old and large diameter (up to 30 cm) trees, which indicates that the site was not recently disturbed by humans (i.e., an ideal reference site). It was approximately located less than 100 meters from the nearest sampling points. Hence, the 210Pbex fallout factors (wind speed, rainfall, turbulence, etc.) are assumed to be very similar to those at the study hillslope. We adopted the reference value (19703 Bq m−2) for the purpose of this study and the annual atmospheric 210Pbex flux (steady state) into the forest canopy; the portion that reaches the forest floor was determined as:| a = Irefeλ | (1) |
| ac = a − aλ = a(1 − λ) | (2) |
2/t1/2 = (0.03114 per year) is the decay constant of 210Pbex.
The first equation has been used in several studies,4,24 but the second equation was generated to determine the contribution of the litterfall path in delivering 210Pbex to the soil. Accordingly, the annual atmospheric (a) and canopy (ac) fluxes of 210Pbex were estimated to be approximately 614 ± 148 and 595 ± 143 Bq m−2 per year, respectively. In previous studies, the reported annual 210Pbex deposition ranged from 135 to 267 Bq m−2 in Central Japan,6 which was significantly lower than the range in this study. Aside from the local orographic variations, the study area receives a higher annual rainfall (2735 mm per year) than cities in Central Japan, such as Mie (2069 mm per year, 267 Bq m−2 per year), Tokyo (1466 mm per year, 200 Bq m−2 per year) and Osaka (1306 mm per year, 135 Bq m−2 per year). Stankwitz et al.5 have identified elevations 800 m and 934 m as threshold increases of 210Pbex deposition. They also clearly pointed out that the coniferous forest at higher elevation provides a higher leaf surface area and canopy density for more cloudwater impaction, leading to a higher 210Pbex deposition. However, the elevation range in our study site (175–560 m) is far lower than the threshold elevation for canopy-cloudwater impaction reported by Stankwitz et al.,5 indicating that this process has a little effect on the 210Pbex deposition in our study site. Therefore, the higher rainfall in the study area should be responsible for the larger depositional flux. Over longer periods of time, this depositional pattern is assumed to be fairly similar at all the sampling points in the study catchment, which the subsequent calculation and explanation are based on.
The net 210Pbex output from the forest canopy (FcPb, Bq m−2) box is transported to the forest soil (FsPb, Bq m−2) box as an input. In the “No soil erosion” scenario, radioactive decay is the only output from FsPb. Thus, the transported amount of 210Pbex from FcPb at a constant transport rate (τ) and the radioactive decay loss rate (λ, per year) from FsPb should be equivalent at a given time point:
| τFcPb = λFsPb | (3) |
Next, the MRT (1/τ, per year) of 210Pbex in the forest canopy (Fc) is calculated assuming a stationary state using eqn (3). Accordingly, the MRT of 210Pbex in the Japanese cypress forest canopy was estimated to be approximately 354 days, which accounts for only 3% of its mean nuclear lifetime (32.2 years). Compared with the MRT of 210Pbex in the Japanese cedar forest (730 and 1010 days) reported by Osaki et al.,7210Pbex has a shorter residence time in the Japanese cypress tree canopy by more than a factor of 2. This finding is most likely observed due to differences between the sites and the nature of the species. For example, Nagakura et al.25 showed that the Japanese cypress tree has higher water saving tendencies than the Japanese cedar tree. This could be directly related to differences in leaf abscission and designs that exist between the two species, which in turn could affect the residence time of 210Pbex. Therefore, canopy architecture, stand density, leaf abscission amounts and rates, and specific physiological setups of the species may contribute to the indicated variation.
3.2. Litter-fed 210Pbex and organic carbon input
The seasonal distribution of litter, organic carbon (OC) and the associated 210Pbex input in the study site is shown in Table 1. The values represent the mean and standard deviation of three litter traps (1 m2 each); one litter trap was damaged during the winter. The data indicated that the annual litterfall rate of 220 ± 9 g m−2 deposited 117 ± 5 g m−2 of organic carbon and 318 ± 30 Bq m−2 of 210Pbex to the forest soil. The temporal variability of litterfall deposition ranged from 18 ± 1.7 g m−2 to 119 ± 4.4 g m−2 while on average the litter deposition spatially varied by ∼4% among the litter traps, indicating that the litter traps efficiently captured the spatial variation in the study hillslope.| Season | Dry matter (g m−2) | OCc (g m−2) | 210Pbex | |
|---|---|---|---|---|
| (Bq kg−1) | Bq m−2 | |||
| a ± is the error of 1σ among three litter traps. Values in the parentheses are the proportions of litter-fed 210Pbex input (%) for each season. b Calculated from only two litter traps as the third was found damaged by strong wind. c Organic carbon (OC). | ||||
| Summer | 18 ± 1.7 | 10 ± 0.9 | 1548 ± 825 | 28 ± 15(8.8) |
| Fall | 119 ± 4.4 | 63 ± 2 | 1333 ± 309 | 159 ± 31(50) |
| Winter | 36 ± 21b | 19 ± 11 | 1325 ± 280 | 47 ± 38(14.8) |
| Spring | 47 ± 7.3 | 25 ± 4 | 1778 ± 817 | 84 ± 35(26.4) |
| Annual | 220 ± 9 | 117 ± 5 | 1496 ± 558 | 318 ± 30 |
A simple bi-box compartment model was used to estimate the contribution of litterfall to the soil 210Pbex inventory. To use the bi-box model, the following two assumptions were made. First, in an equilibrium state, the input and output of 210Pbex in a closed forest canopy (as a radiolead transit box) are equal. Second, the distribution of 210Pbex in a closed forest canopy via rainwater could cause lodging and dislodging of the radionuclide on its way to the ground due to the larger catchment area for rainwater. The canopy intercepts a considerable amount of rainwater that evaporates back from the canopy surface before it reaches the ground.8 The remaining portion tends to migrate downward following the architecture of the canopy, which possibly minimizes the chance of direct rain drops reaching the forest floor. This roughly supports the assumption used in eqn (1) and (2) that the annual radiolead flux first goes to the canopy and reduces by decay. However, this complex transport system is beyond the scope of the study. For simplicity, it is reasonable to classify the depositional pathways into two broad categories: litter-fed and other (including wet pathways).
Our observations indicated that litterfall transports approximately 318 ± 30 Bq m−2 per year (53.4% of the net canopy pool) of 210Pbex to the forest floor. Based on a simple balance-budget calculation, other mechanisms collectively account for 46.6%. This result demonstrated that litterfall tends to be a robust transporter of 210Pbex in a congested forest canopy. Tree phytomass, via seasonal climate interactions, results in different litterfall yields and determines the 210Pbex depositional flux. According to the seasonal litterfall pattern (see Table 1), half of the annual litter-fed 210Pbex deposition occurred during the fall (50%), followed by spring (26%), winter (15%) and summer (9%). Over longer periods of time, this depositional pattern may influence the vertical distributions of 210Pbex and SOC in the soil profile. Along with seasonal climatic variables, the patterns may affect the ability of decomposing biological communities to turnover 210Pbex containing litters. This process demands its own time scale and was not explored in this study.
3.3. The distribution of 210Pbex inventory, SOC density and erosion coefficient
The inventories of 210Pbex and the corresponding SOC density for the upper 30 cm of soil at 16 sampling points (SPs) were measured (Table 2). 210Pbex inventories range from 5310 Bq m−2 at sampling point 4 to 16413 Bq m−2 at sampling point 8. The mean values of radiolead concentration and inventories were 191 ± 79 Bq kg−1 and 10953 ± 3094 Bq m−2, respectively (Table 2). Most importantly, the 210Pbex inventory at each sampling point across the study watershed was lower than the local reference inventory (19703 ± 5517 Bq m−2). However, the radiolead inventory observed at the three sampling points (SP 8, 10 and 14) fallen in a statistically indistinguishable range of the spatial distribution at the reference site. This implies that the difference can be accommodated by the spatial uncertainty of the radiolead inventory and the probability of erosion effect at these sampling points could be less. At the rest of sampling points, however, the observed radiolead inventories were out of the range of a reference inventory frame. Specifically at SP-4, the radiolead inventory was even lower (by about 4%) than the magnitude of the spatial heterogeneity observed at the reference site (±5517 Bq m−2), indicating that the variation is generated beyond the influence of the spatial sampling uncertainty and this qualitatively suggests the likelihood of the occurrence of severe erosion.
| Sampling points | 210Pbex activity (Bq kg−1) | 210Pbex inventory (Bq m−2) | SOC (%) | SOC (g m−2) | Radiolead displacement factor (RDF)a |
|---|---|---|---|---|---|
| a RDF = 1 − Iith/Irefe, where RDF stands for radiolead displacement factor that represents erosion coefficient; Irefe = radiolead inventory at the reference site; Iith = radiolead inventory at the ith sampling point. According to the RDF value, the following three qualitative scenarios can be identified as: RDF = 0: stable (neither erosion nor deposition), RDF = +value: eroding point, RDF = −value: depositing point. | |||||
| 1 | 220 | 12292 |
8 | 7267 | 0.38 |
| 2 | 192 | 13272 |
9 | 7473 | 0.33 |
| 3 | 129 | 11525 |
5 | 6964 | 0.41 |
| 4 | 86 | 5310 | 6 | 7848 | 0.73 |
| 5 | 110 | 10013 |
7 | 8018 | 0.49 |
| 6 | 241 | 10191 |
12 | 7404 | 0.48 |
| 7 | 197 | 9021 | 10 | 7980 | 0.54 |
| 8 | 429 | 16413 |
18 | 10251 |
0.17 |
| 9 | 211 | 8595 | 10 | 8802 | 0.56 |
| 10 | 236 | 14234 |
11 | 11419 |
0.28 |
| 11 | 126 | 7247 | 7 | 7507 | 0.63 |
| 12 | 231 | 13330 |
13 | 9851 | 0.32 |
| 13 | 185 | 10261 |
9 | 7416 | 0.48 |
| 14 | 157 | 15288 |
6 | 6735 | 0.22 |
| 15 | 165 | 11082 |
8 | 8885 | 0.44 |
| 16 | 139 | 7176 | 7 | 6640 | 0.64 |
| Mean | 191 | 10953 |
9 | 8154 | 0.4 |
| Maximum | 429 | 16413 |
18 | 11419 |
0.7 |
| Minimum | 86 | 5310 | 5 | 6640 | 0.2 |
| CV (%) | 42 | 28 | 35 | 17 | 35 |
Despite a constant 210Pbex flow from the forest canopy, erosion disrupted the equilibrium of 210Pbex in the soil box at the hillslope. In addition to decay loss, the erosion process shifts the state of equilibrium assumed at the reference site to a disequilibrium state. Therefore, we removed the “No erosion” scenario assumption that was applied at the reference site and included the erosion component as an additional outlet in eqn (3) for the hillslope conditions as:
 | (4) |
Table 2 also summarizes the values of Radiolead Displacement Factor (RDF) for each sampling point. RDF is defined as the inventory ratio of the differences of radiolead inventories between the reference site and a sampling point (EPbi) divided by the reference value. Roughly these values can be used to demonstrate the spatial strength of soil erosion across the study hillslope and more or less approximated to be equivalent to net erosion coefficient (q) in eqn (4) given that radiolead deposition from the forest canopy and loss via decay are constant.
Accordingly, the RDF values ranged from 0.7 at a highly eroded point (SP 4) to 0.2 at a less eroded point (SP 8) with the mean value of 0.4 ± 0.2 (Table 2). From this result, erosion is very likely to be generated shortly after rain in a heterogeneous pattern aided by the poor ground cover and the steep slope conditions of the study site that removed about 20–70% of the expected radiolead budget at the sampling points.
Likewise, Onda et al.26 reported that most hillslope Japanese forests are left unattended, which results in high density and poor ground cover that is threatened by erosion. Specifically, Wakiyama et al.23 and Teramage et al.21 have demonstrated high erosion rates (>8 t ha−1 per year) at this study site. These provide evidence to our findings that qualitatively most sampling points are eroded spots given the magnitude of the spatial heterogeneity at the reference site (discussed above). And the differences among them could quantitatively represent the spatial variability of soil erosion across the hillslope and the strength of the variation among the sampling points can be partially explained by differences in their RDF values. As indicated, litterfall is the main route of radiolead transfer from the forest canopy into the forest soil. Hence, a smaller RDF value (less eroded point) could be interpreted as litter-fed 210Pbex remains at that sampling point longer, and vice versa. Therefore, using the value of RDF, it is possible to estimate the litter-fed based erosion factor for a given study site. This can be used as an indicator of the intensity of the litter-fed 210Pbex contamination load on vulnerable resources in the downstream of the watershed, such as water bodies.
The modified conceptual model of the 210Pbex inverted U-shaped pathways that include erosion as an outlet for the hillslope site scenarios is illustrated in Fig. 3. Although the flow of the litter and its associated inputs (210Pbex and OC) from the canopy to the forest soil is assumed to be uniform, erosion removes and alters their respective proportions in the soil compartment. This is clearly illustrated in the conceptual models (Fig. 2 and 3) for the reference and hillslope scenarios. On the basis of the overall average of our observations, erosion removed approximately 9.2% of the SOC capital and 44.4% of the 210Pbex budget of the hillslope soil compared to the reference site.
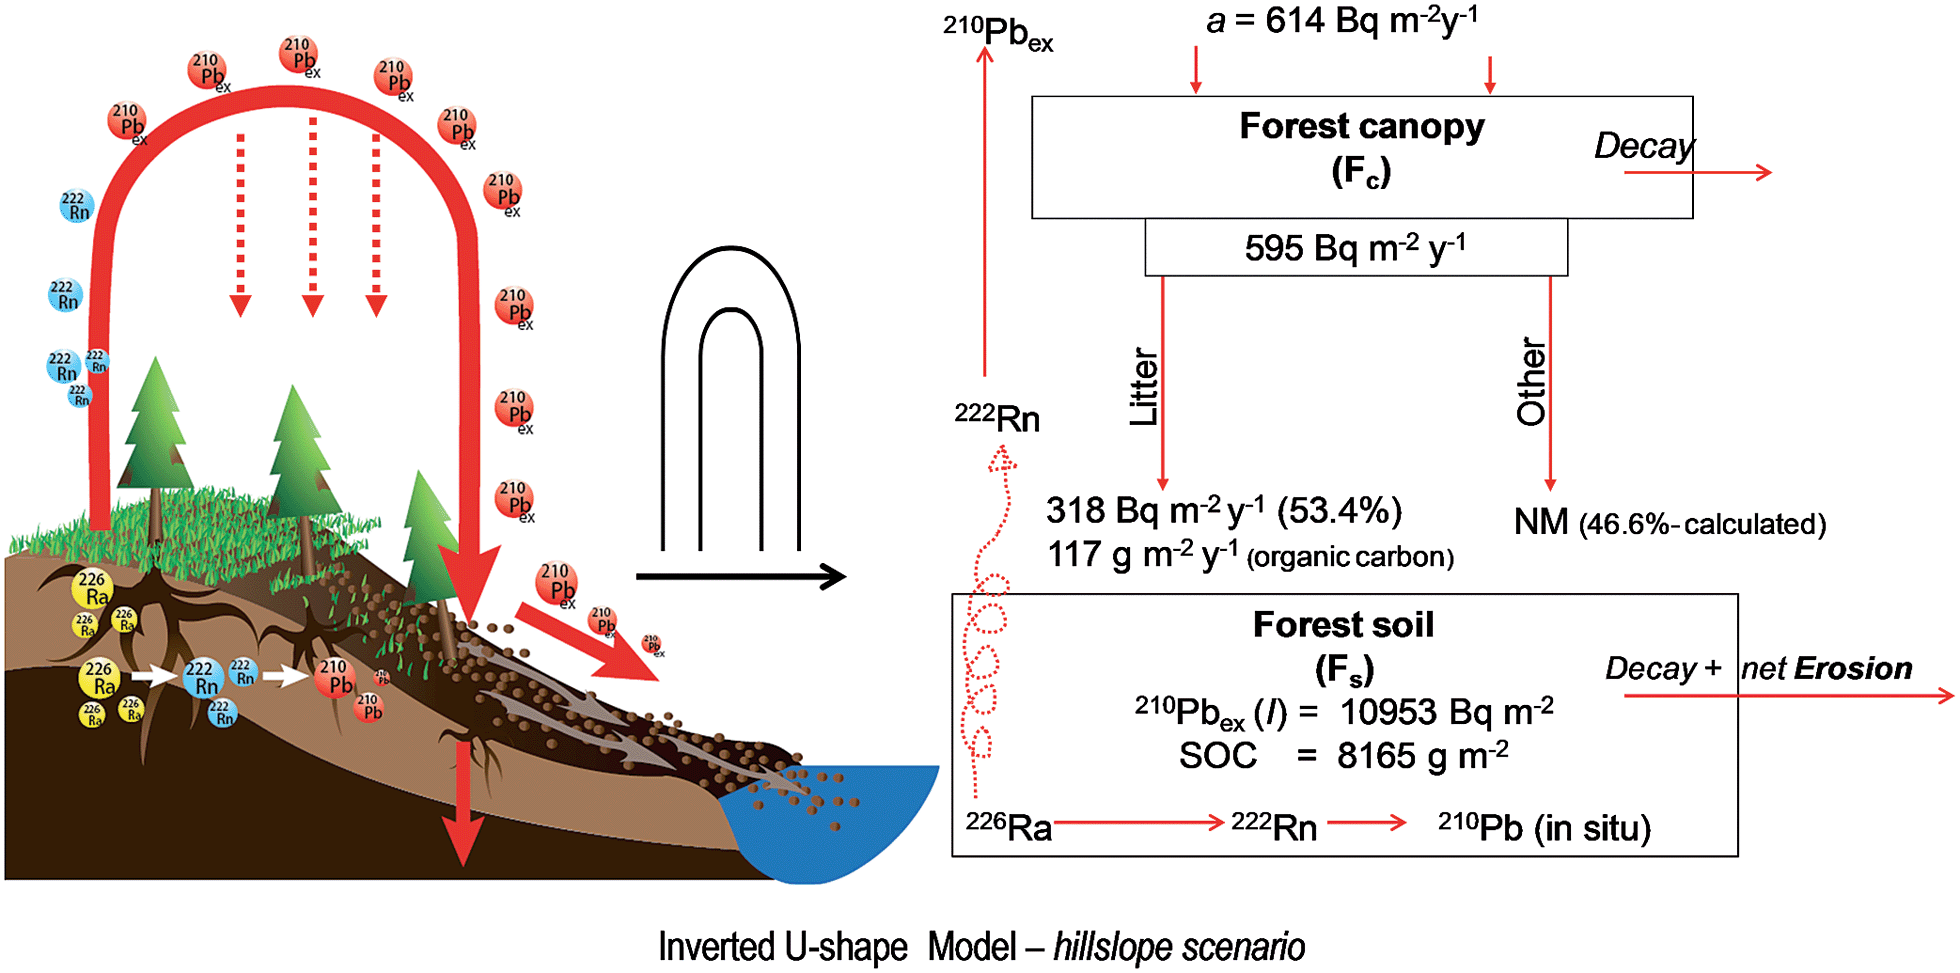 | ||
| Fig. 3 Schematic diagram of the 210Pbex inverted U-shaped flow path in the erosion prone hillslope scenario. It represents the situation that erosion dislocates the flow of both 210Pbex and SOC and affects the state of equilibrium unlike the reference site. The simplified framework of the model is shown in the right side that includes net erosion as one outlet for both 210Pbex and SOC from the system under consideration. | ||
3.4. Depth distribution profiles of 210Pbex and SOC
At the reference sites, 210Pbex (Bq kg−1) and SOC (%) are concentrated in the upper soil horizon where they are continuously replenished from their natural sources, mainly via litterfall, and decreased exponentially along the soil depth (Fig. 4a and b). The relaxation depth ratio of 210Pbex to SOC (1.2) demonstrated that both have similar surface concentration reduction momentums (e−1) at similar depths in undisturbed soil. This provides evidence that 210Pbex and SOC have very comparable depth distribution patterns.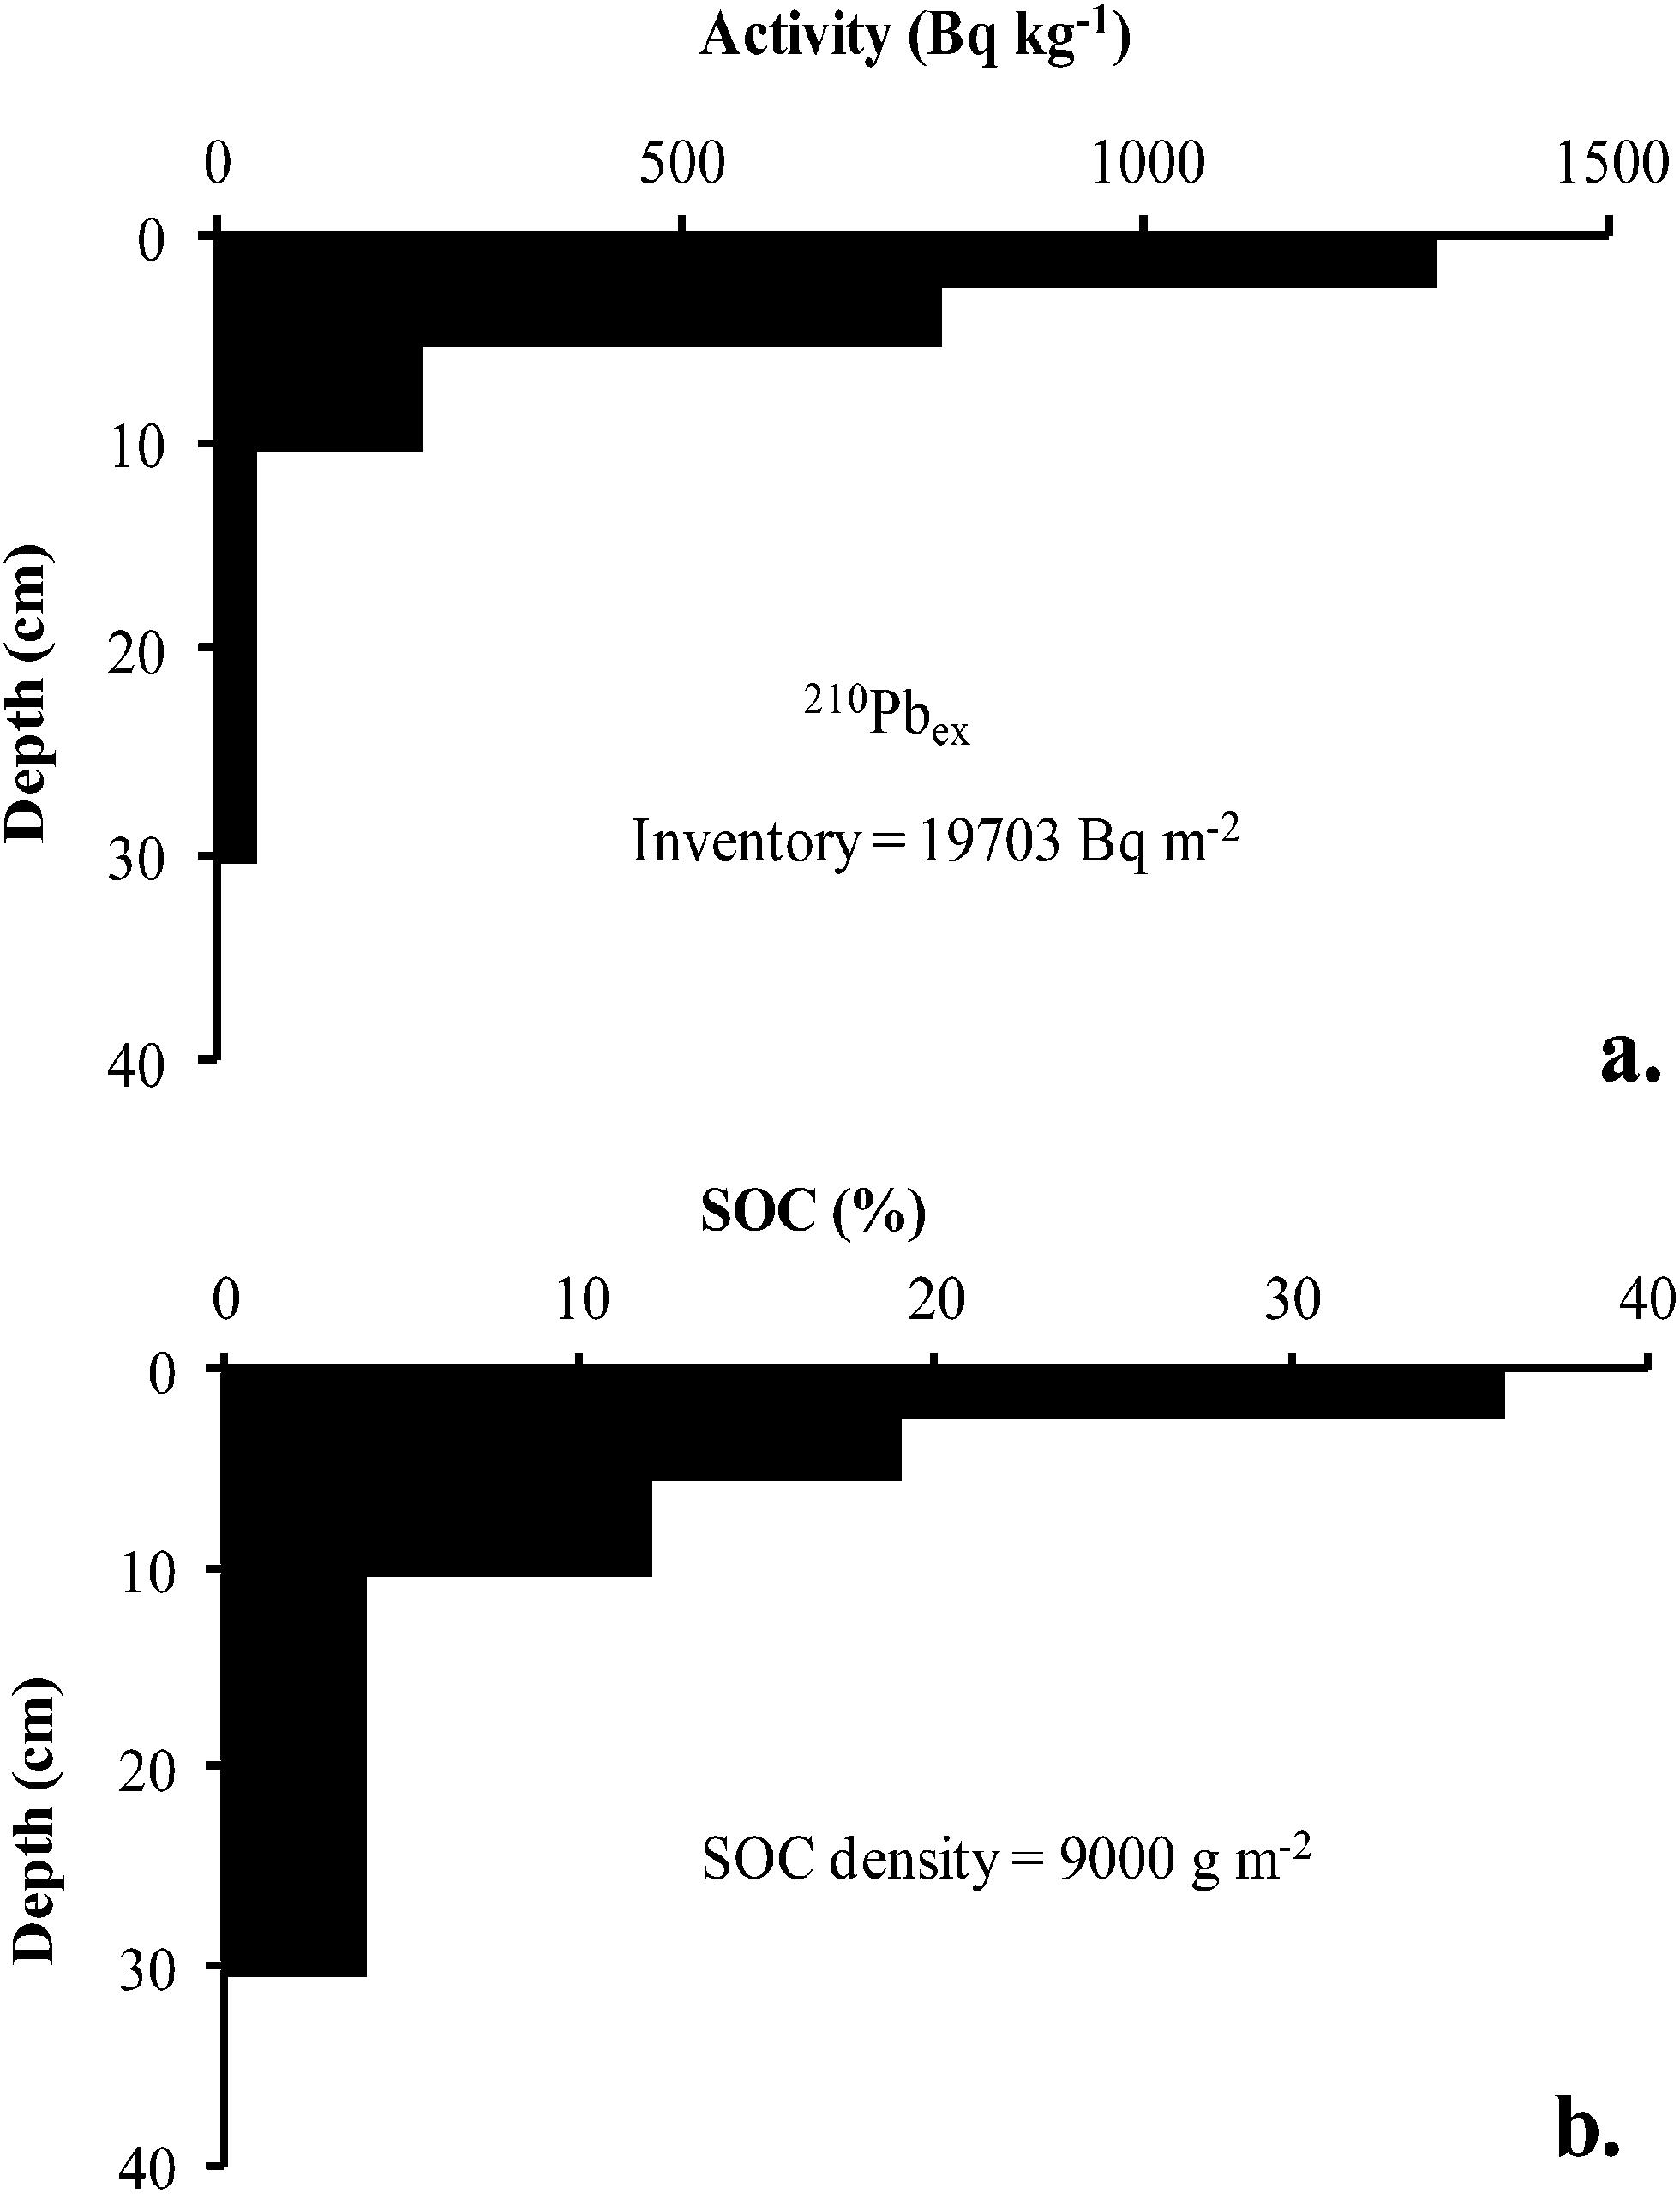 | ||
| Fig. 4 The depth distribution profiles of (a) radiolead and (b) SOC concentrations at the reference site. The calculated relaxation depth (Ẑ) ratio of SOC:210Pbex is 1.2, i.e. the depth at which the concentration of SOC decreases to e−1 of its concentration at the soil surface is 1.2 times of that of 210Pbex. This implies that both possess a similar depth migration pattern in the vertical soil shelf under undisturbed soil conditions. Thus, knowing the concentration of 210Pbex and its relaxation depth in such an environment can give a hint on the SOC content. | ||
The values of the 210Pbex inventories and SOC contents did not differ significantly among the sampling points. However, SOC (CV = 35%; range: 5–18%) exhibited a relatively larger spatial variability than 210Pbex (CV = 28%; range: 5310–15288 Bq m−2). The maximum SOC value was 4 orders higher than the minimum value, whereas 210Pbex was 3-fold higher (Table 1), which implies that SOC is relatively more variable than 210Pbex.
After the deposition of litter and radiolead, the migration and redistribution of 210Pbex and SOC depend on the speed of the litter integration into the soil column. The depth distribution profiles of 210Pbex and SOC at each sampling point during the study period are illustrated in Fig. 5 and 6, respectively. Among the depth profiles of 210Pbex (Fig. 5), four sampling points (SP 4, 7, 9 and 11) had lower profile tails that declined to zero around a 10 cm depth, which indicates that a 30 cm depth is adequate to fully estimate the 210Pbex inventory at the study site.
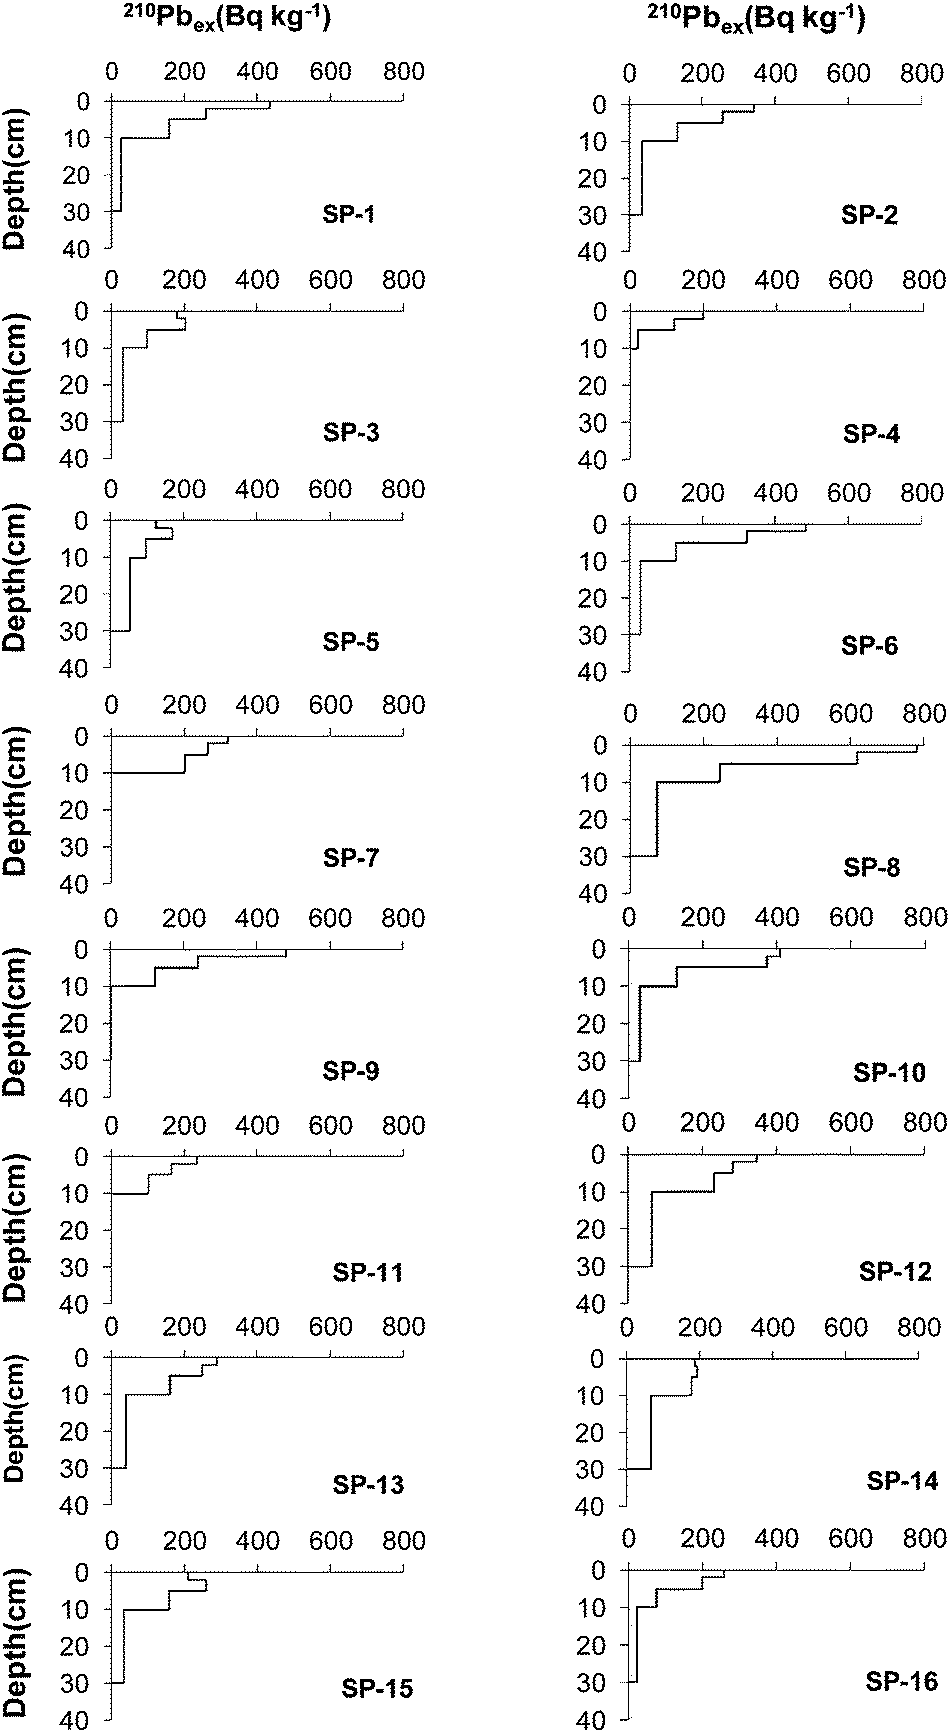 | ||
| Fig. 5 The depth distribution profiles of radiolead at each sampling point (SP-i's) in the study watershed. | ||
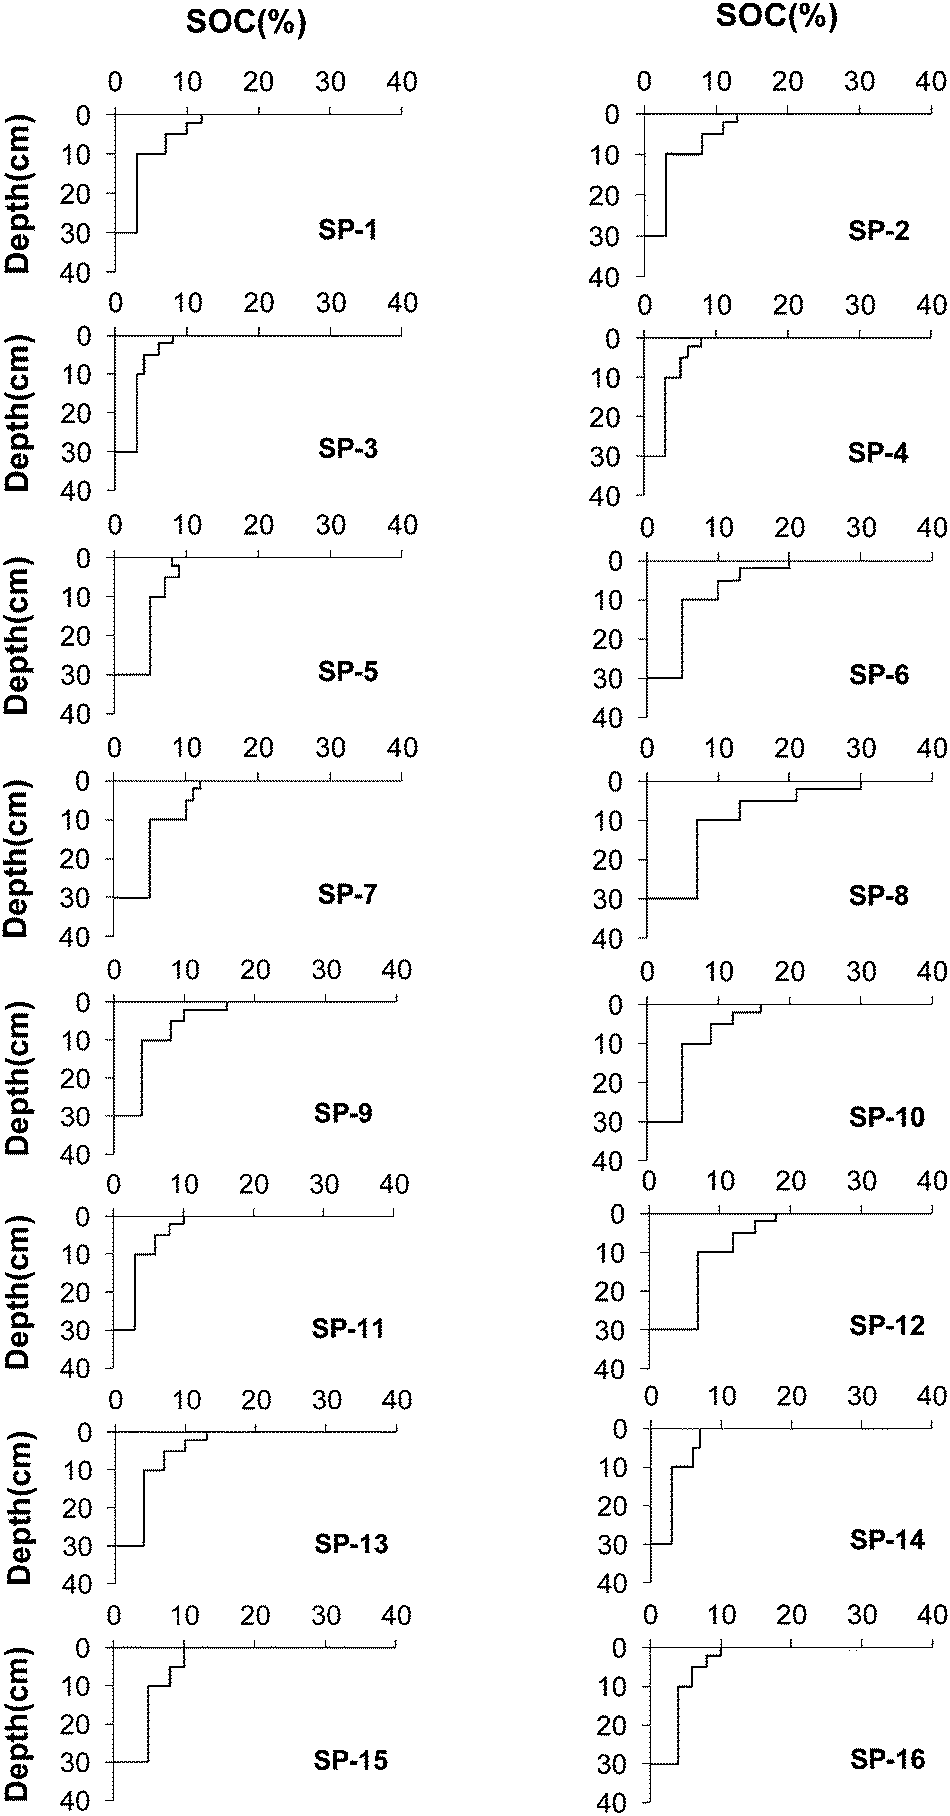 | ||
| Fig. 6 The depth distribution profile of SOC at each sampling point (SP-i's) in the study watershed. The depth profile shapes of both 210Pbex (as indicated in Fig. 5) and SOC are almost similar at a given sampling point which implies that both are moving in a similar pattern by a similar driving mechanism both in the lateral (mainly driven by erosion) and vertical (governed by sedimentation of the surface material to the lower horizon by decomposition, bio-mixing, gravity, pipe-like conduction and gradient difference based diffusion like processes) direction. | ||
Unlike the reference site, 19% of the sampling points (SP 3, 14 and 15) exhibited minor differences in the shapes of their depth distribution profiles. Otherwise, most (>80%) points had fairly similar shapes that revealed high concentration in the topsoil and exponential decline with depth; however, SOC and 210Pbex have different disintegration patterns. SOC depends on a suite of biological decomposition complexes, whereas 210Pbex depends on a constant physical decay. Regardless of this difference, we observed a strong relationship between the measured SOC and 210Pbex along the depth profile. Fig. 7a shows the relationship between SOC and 210Pbex depth distributions at the reference site. Although the variability was high in the upper soil layers and lesser in the deeper layers, they were strongly correlated along the vertical soil profile (R2 = 0.96, n = 4, P < 0.05), which implies an interdependence during their downward movements in the soil column. Similarly, we plotted the measured values of SOC (%) and 210Pbex (Bq kg−1) for all the sampling points that were obtained from the study hillslope (Fig. 7b) to evaluate the combined effects of spatial and depth distributions; and the result demonstrated the presence of a strong relationship between SOC (%) and 210Pbex (Bq kg−1) (R2 = 0.90, n = 64, P < 0.01). This provides additional evidence that both variables are equally affected by similar mechanisms and have very similar distribution patterns.
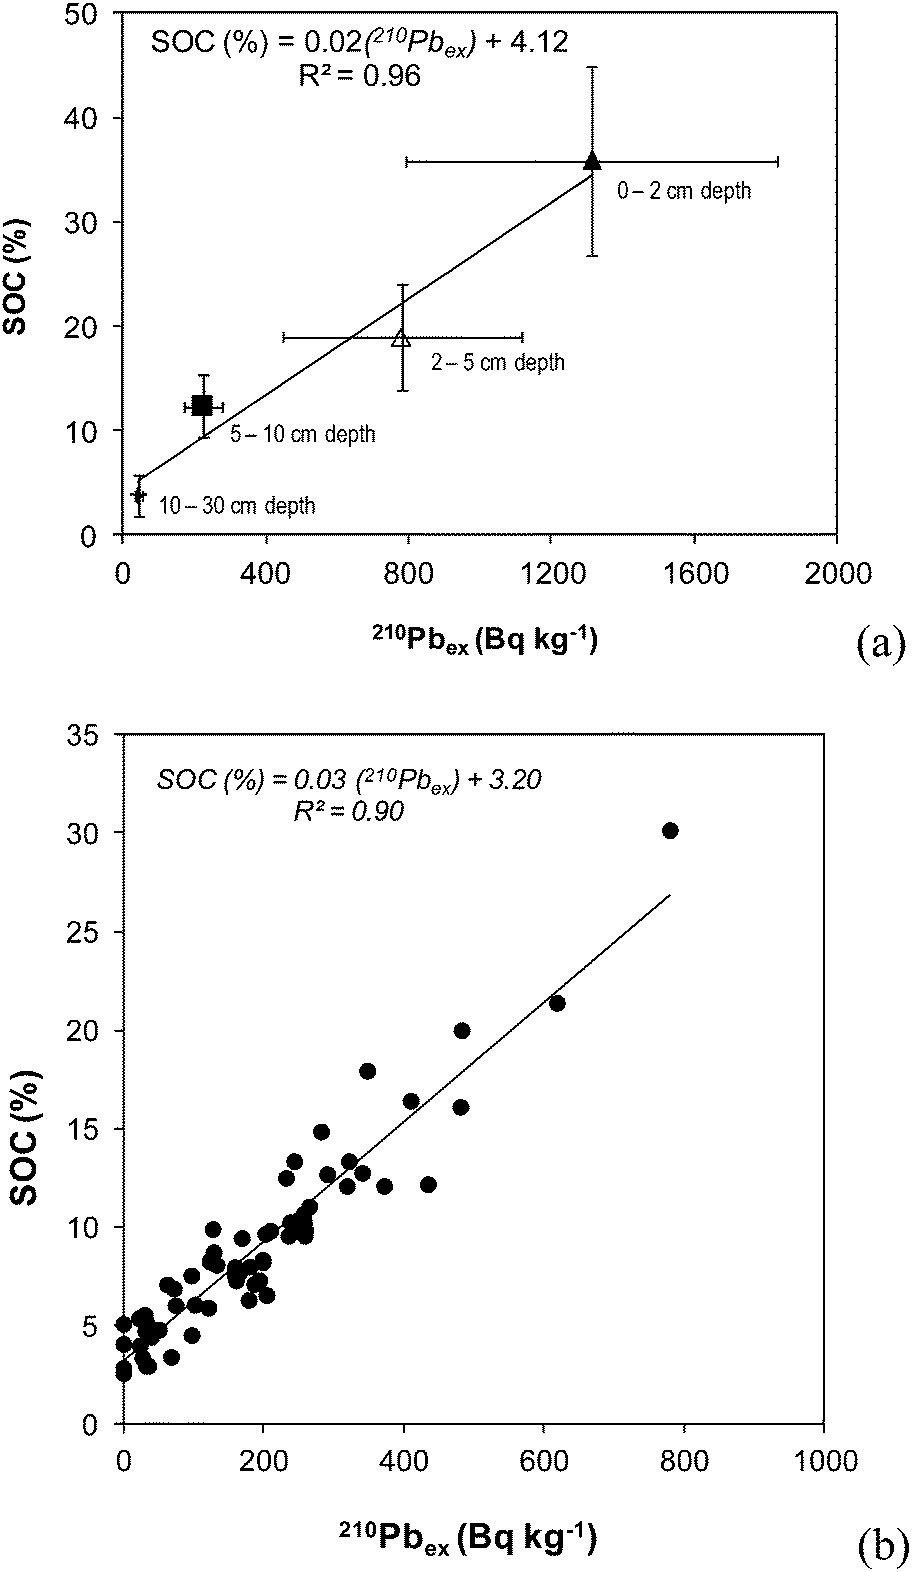 | ||
| Fig. 7 The relationship between 210Pbex and SOC at the (a) reference site and (b) study hillslope. | ||
The similar vertical and lateral distributions of SOC and 210Pbex may be partly explained by the role of decomposition processes as follows: the annually renewed litter layer thickness on the forest floor decreases when SOC is produced by biological decay. When microbes attempt to obtain fresh litter from the renewed layer, stable SOC forms (often called recalcitrant carbon) and partially decomposed organic materials mix and move down the soil column. When the 210Pbex-containing litter begins to breakdown during the various stages of decomposition, 210Pbex shifts the position from a mechanically external attachment at the surface of litter materials to a chemically internal attachment, where it is permanently fixed by strong bonds with chains of organic carbon compounds and substances released during the process. Dorr2 and Dorr and Munnich11 suggested that radiolead is immobile, and its vertical migration is predominantly “passive” (i.e., it moves with its carrier without being mobilized in the liquid phase). Likewise, the similar observed depth profile distributions of SOC and 210Pbex (see Fig. 7a and b) in our study may be associated with passive migration for which the momentum could be “bio-accelerated” (i.e., the movement mediated by the role of soil fauna).
The comparable distributions of SOC and 210Pbex throughout the watershed demonstrate that they are affected by similar surface processes, such as erosion. The analogous bi-directional movement (in the vertical soil shelf and on the lateral soil surface) of SOC and 210Pbex could allow us to understand SOC transport based on 210Pbex in a forested environment.
Since the mid-1990s, global warming has dominated environmental agendas,27 and many climate change conventions are rapidly developing as the world community recognition of the issue increases.17 In this context, our findings offer possible paths and storage locations of SOC across various environments, which may help to develop management systems that enhance carbon sequestration to mitigate global warming. The findings can also generate valuable statistics that can be interpreted and used to reduce soil erosion induced pollutants in environmental units, such as downstream water resource networks.
4. Conclusions
Previous studies have indicated that 210Pbex movement in the forest soil is related to the movement of organic matter. However, organic matter is a mixture of thousands of chemical compounds, primarily organic carbon chains. Our results suggest that 210Pbex and SOC in the forest soil have a strong affinity and identical migration patterns. Thus, the 210Pbex distribution pattern may provide information about SOC and may be used to monitor and quantify the transport and distribution of SOC in the forest soil. The strong relationship between SOC and 210Pbex also suggests the possibility of developing models to predict SOC redistribution and provide guidance for management systems that encourage carbon sequestration.Due to morphological and physiological differences, the MRT of 210Pbex in Japanese cypress canopies is shorter than in Japanese cedar, indicating a higher accumulation of radiolead in the Japanese cypress forest floor. However, after reaching the forest floor, erosion processes tend to influence the 210Pbex under forested hillslope conditions. This implies that the transport of litter-fed 210Pbex by erosion is a potential source of contamination of valuable natural resources located downstream of the hillslope and RDF could help to identify the load and intensity of litter-fed 210Pbex contamination. Such information can aid in developing mechanisms to minimize the likely effects of soil erosion driven contaminants on downstream resources, specifically, on water resources. Given that most of the world's forests are located in mountainous and hillslope areas, the ubiquitous tracer, 210Pbex, could feasibly provide information for enhancing the carbon sequestration capacity of forests at local, regional and global scales. However, the application of 210Pbex as a tracer is under research and pre-mature stage that requires further studies.
Acknowledgements
This study is supported by the Core Research for Evolutional Science and Technology (CREST) research project. We are grateful to Mrs Tebeyien Negashe for her support in reading and correcting the manuscript.References
- F. EI-Daushy, A summary on the lead-210 cycle in nature and related applications in Scandinavia, Environ. Int., 1988, 14, 305–319 CrossRef.
- H. Dorr, Application of 210Pb in soils, Paleolimnology, 1995, 13, 157–168 CrossRef.
- A. S. Likuku, Atmospheric transfer and deposition mechanisms of 210Pb aerosols on to forest soils, Water, Air, Soil Pollut., 2009, 9, 179–184 CrossRef CAS.
- D. Fowler, R. Mourne and D. Branford, The application of 210Pb inventories in soil to measure long-term average wet deposition of pollutants in a complex terrain, Water, Air, Soil Pollut., 1995, 85, 2113–2118 CrossRef CAS.
- C. Stankwitz, J. M. Kaste and A. J. Friedland, Threshold increases in soil lead and mercury from tropospheric deposition across an elevation gradient, Environ. Sci. Technol., 2012, 46, 8061–8068 CrossRef CAS PubMed.
- T. Fukuyama, Y. Onda, C. Takenaka and D. Walling, Investigating erosion rates within a Japanese cypress plantation using 137Cs and 210Pbex measurements, J. Geophys. Res., 2008, 113, F02007, DOI:10.1029/2006jf000657.
- S. Osaki, Y. Tagawa, S. Sugihara, Y. Maeda and Y. Inokura, Transfer of 7Be, 210Pb and 210Po in a forest canopy of Japanese cedar, J. Radioanal. Nucl. Chem., 2003, 255(2), 449–454 CrossRef CAS.
- S. Osaki, S. Sugihara, Y. Maeda and T. Osaki, Behavior of 7Be and 210Pb deposited via rainwater on coniferous forest, a broad-leaved forest, and grassland, J. Radioanal. Nucl. Chem., 2007, 272(1), 147–152 CrossRef CAS.
- D. Lewis, The use of 210Pb as a heavy metal tracer in the Susquehanna River system, Geochim. Cosmochim. Acta, 1977, 41(11), 1557–1564 CrossRef CAS.
- H. Dorr and O. K. Munnich, Downward movement of soil organic matter and its influence on trace-element transport (210Pb, 137Cs) in the soil, Radiocarbon, 1989, 31(3), 655–663 Search PubMed.
- H. Dorr and O. K. Munnich, Lead and Cesium transport in European Forest soils, Water, Water, Air, Soil Pollut., 1991, 57/58, 809–818 CrossRef.
- J. M. Kaste, B. C. Bostick, A. M. Heimsath, E. Steinnes and A. J. Friedland, Using atmospheric fallout to date organic horizon layers and quantify metal dynamics during decomposition, Geochim. Cosmochim. Acta, 2011, 75, 1642–1661 CrossRef CAS PubMed.
- K. Vaaramaa, A. Lasse, D. Solatie and J. Lehto, Distribution of 210Pb and 210Po in boreal forest soil, Sci. Total Environ., 2010, 408, 6165–6171 CrossRef CAS PubMed.
- N. G. Pricope, Assessment of spatial patterns of sediment transport and delivery for soil and water conservation programs, J. Spatial. Hydrol., 2009, 9(1), 21–46 Search PubMed.
- C. Ritchie, G. McCarty, E. Venteris and T. Kaspar, Soil and soil organic carbon redistribution on the landscape, Geomorphology, 2007, 89, 163–171 CrossRef PubMed.
- R. Lal, Soil erosion impact on agronomic productivity and environmental quality, Crit. Rev. Plant Sci., 1998, 17(4), 319–464 CrossRef.
- R. Lal, Soil erosion and the global carbon budget, Environ. Int., 2003, 29, 437–450 CrossRef CAS.
- Intergovernmental Panel on Climate Change [IPCC], Good practices guidance for land use, land-use change and forestry, Institute for Global Environmental Strategies (IGES), 2003, Japan.
- A. A. Berhe, J. Harte, J. W. Harden and M. S. Torn, The significance of the erosion-induced terrestrial carbon sink, BioScience, 2007, 57(4), 337–346 CrossRef.
- K. Van Oost, T. Quine, G. Govers and S. De Gryze, et al. The impact of agricultural soil erosion on the global carbon cycle, Science, 2007, 318, 626–629 CrossRef CAS PubMed.
- M. T. Teramage, Y. Onda, H. Kato, Y. Wakiyama, S. Mizugaki and S. Hiramatsu, The relationship of soil organic carbon to 210Pbex and 137Cs during surface soil erosion in hillslope forested environment, Geoderma, 2013, 192, 59–67 CrossRef CAS PubMed.
- H. Kato, Y. Onda and Y. Tanaka, Using 137Cs and 210Pbex measurements to estimate soil redistribution rates on semi-arid grassland in Mongolia, Geomorphology, 2010, 114, 508–519 CrossRef PubMed.
- Y. Wakiyama, Y. Onda, S. Mizugaki and S. Asai Hiramatsu, Soil erosion rates on forested mountain hillslopes estimated using 137Cs and 210Pbex, Geoderma, 2010, 159, 39–52 CrossRef PubMed.
- D. Branford, D. Fowler and M. V. Moghaddam, Study of aerosol deposition at a wind exposed forest edge using 210Pb and 137Cs soil inventories, Water, Air, Soil Pollut., 2004, 157, 107–116 CrossRef CAS.
- J. Nagakura, H. Shigenaga, A. Akama and M. Takahashi, Growth and transpiration of Japanese cedar (Cryptomeria japonica) and Hinoki cypress (Chamaecyparis obtusa) seedlings in response to soil water content, Tree Physiol., 2004, 24, 1203–1208 CrossRef.
- Y. Onda, T. Gomi, S. Mizugaki, T. Nonoda and R. Sidle, An overview of the field and modeling studies on effects of forest devastation on flooding and environmental issues, Hydrol. Processes, 2010, 24, 527–534 CrossRef.
- P. J. Mol, Carbon flows, financial markets and climate change mitigation, Environmental Development, 2012, 1, 10–24 CrossRef PubMed.
| This journal is © The Royal Society of Chemistry 2015 |