The sludge loading rate regulates the growth and release of heterotrophic bacteria resistant to six types of antibiotics in wastewater activated sludge†
Qing-bin
Yuan
a,
Mei-ting
Guo
*ab and
Jian
Yang
a
aState Key Laboratory of Pollution Control and Resources Reuse, College of Environmental Science and Engineering, Tongji University, 200092, Shanghai, China. E-mail: guomeiting@tongji.edu.cn; Fax: +86-21-6598-4275; Tel: +86-21-6598-4275
bState Environmental Protection Key Laboratory of Microorganism Application and Risk Control (MARC), Tsinghua University, 100084, Beijing, China
First published on 2nd December 2014
Abstract
Wastewater treatment plants are considered as hot reservoirs of antimicrobial resistance. However, the fates of antibiotic-resistant bacteria during biological treatment processes and relevant influencing factors have not been fully understood. This study evaluated the effects of the sludge loading rate on the growth and release of six kinds of antibiotic-resistant bacteria in an activated sludge system. The results indicated that higher sludge loading rates amplified the growth of all six types of antibiotic resistant bacteria. The release of most antibiotic-resistant bacteria through both the effluent and biosolids was amplified with increased sludge loading rate. Biosolids were the main pattern for all antibiotic-resistant bacteria release in an activated sludge system, which was determined primarily by their growth in the activated sludge. A higher sludge loading rate reactor tended to retain more antibiotic resistance. An activated sludge system with lower sludge loading rates was considered more conducive to the control of antibiotic resistance.
Environmental impactThis study evaluated the effects of the sludge loading rate on the growth and release of six kinds of antibiotic-resistant bacteria in an activated sludge system. The results indicated that the release of most antibiotic-resistant bacteria through both the effluent and biosolids was amplified with increased sludge loading rates. Biosolids were the main pattern for all antibiotic-resistant bacteria release in an activated sludge system, which was determined primarily by their growth in the activated sludge. An activated sludge system with lower sludge loading rates was considered more conducive to the control of antibiotic resistance. These results may provide implications in assessing the fate of antimicrobial resistance in wastewater treatment systems. |
1. Introduction
Wastewater treatment plants (WWTPs) are considered as hot reservoirs of antimicrobial resistance, an emerging pollutant source imposing a significant threat to public health. Even after treatment by biological processes or disinfection technologies, high amounts of antibiotic-resistant bacteria (ARB) are still frequently detected in the effluents of WWTPs and/or subsequent aquatic environments. Munir et al. reported that more than 1011 CFU per day of tetracycline- and 1012 CFU per day of sulfonamide-resistant heterotrophic bacteria were discharged through WWTP effluents.1 Furthermore, even higher release loads of bacteria showing resistance in biosolids (compared to effluents) have also been demonstrated,1,2 making WWTPs potentially the most significant emission source of antimicrobial resistance.The fate of ARB during wastewater treatment is at the epicenter of the concerns of microbiologists and wastewater engineers interested in controlling antibiotic resistance.3 The conditions in WWTPs are considered favorable for the proliferation of ARB. Luczkiewicz et al. observed that E. coli resistant to penicillins, fluoroquinolones, trimethoprim/sulphamethoxazole and tetracycline was more prevalent in treated wastewater compared to its abundance in the influent.4 Similarly, Morozzi et al. and Andersen reported an increase in the percentage of multiple-antibiotic resistant (MAR) coliforms following biological treatment of municipal sewage.5,6 Regular wastewater treatment processes and disinfection processes often determine a significant reduction in the total numbers of ARB, but large amounts of them are still detected in effluents and biosolids.7–9
Biological processes and their operating conditions (e.g., sludge loading rate, hydraulic retention time, solid retention time, biomass, dissolved oxygen concentration, etc.) have been considered to have significant effects on ARB behaviors in WWTPs. Threedeach et al. found that the percentages of bacteria resistant to most antibiotics were higher under anaerobic operation conditions than under semi-aerobic conditions.10 Munir et al. investigated the effects of different biological processes [including membrane biological reactors (MBRs), conventional activated sludge, oxidative ditch and rotatory biological contactors] on the removal of tetracycline- and sulfadiazine-resistant heterotrophic bacteria and found that the MBR was more effective than other traditional treatment processes (from 2.6 to 7.1 log removal).1 Moreover, Kim et al. investigated the fate of tetracycline-resistant bacteria as a function of the organic loading rate; the results indicated that increases in organic loading and growth rates resulted in higher increased concentrations and production rates of tetracycline-resistant bacteria.11
However, knowledge in this area is still scarce. Additional operating conditions in biological processes, especially the kind that directly determines bacterial proliferation, were rarely reported as to their effects on the fate of ARB. The sludge loading rate (food-to-microorganism ratios, F/M) was considered to be one of the most important factors that influence organic degradation and bacterial growth in the activated sludge process. In order to provide guidance concerning antibiotic resistance control in WWTPs, the effects of the sludge loading rate on ARB behaviors in biological processes need further investigation. On the other hand, the growth of ARB in the activated sludge, as well as their release characteristics, was both considered important for understanding ARB fates in WWTPs. However, previous studies in this area only concentrated on single behaviors, either in activated sludge or in the effluent – causing difficulties in determining their systematic fates in biological processes. Therefore, a comprehensive research study is urgent concerning the simultaneous growth and discharge properties of ARB.
Thus, the objective of this study is to evaluate the effect of the sludge loading rate on the fate of ARB in a bench-scale activated sludge treatment process. Heterotrophic bacteria resistant to six kinds of commonly used antibiotics, including cephalexin (CEP), erythromycin (ERY), gentamicin (GEN), sulfadiazine (SD), tetracycline (TC) and vancomycin (VAN), were studied as representative cases. Their growth and release were investigated simultaneously to evaluate their fates in an activated sludge system. Three typical sludge loading rates were tested to explore this factor on ARB behaviors.
2. Materials and methods
2.1 Bench-scale activated sludge system design and operation
Three parallel 500 mL conical flasks were adopted as activated sludge reactors with each having a working volume of 400 mL (Fig. 1). Magnetic stirrers (Sile apparatus, Minhang Shanghai, China) were used for liquid agitation of the three reactors at a constant rate (100 rpm). Aeration in the reactors was supplied using an aquarium air pump (CX-0088, Chuangxing Electric, Guangdong, China) with a gas flow rate of 0.6–0.8 L min−1. During the experiments, a Plexiglass® cap was placed over each reactor to minimize evaporative losses.First, three reactors were seeded with a mixture of return-activated sludge and the effluent of the primary clarifier from the Shanghai WWTP. The wastewater quality is shown in Table S1.† The sludge was fed with ‘fresh’ wastewater every day, keeping the system stirred and aerated. When each reactor achieved a constant removal of Total Chemical Oxygen Demand (TCOD), Filtered Chemical Oxygen Demand (FCOD), turbidity, NH4+–N, Total Nitrogen (TN) and Total Phosphorus (TP) for a period of at least three weeks, it was considered that stable running conditions were achieved.
Second, the reactors were operated in the following plan (Table 1). The operation cycle of the reactors was 8 h, and the solid retention time (SRT) was 8 days. SBR operation consisted of four periods in each cycle: filling, reaction, settling and decantation as presented in Table 1. To evaluate the effect of the sludge loading rate on the fates of various ARB, three different sludge loading rates [0.24 kg TCOD/(kg MLSS day) for A, 0.42 kg TCOD/(kg MLSS day) for B and 0.61 kg TCOD/(kg MLSS day) for C] were operated for at least five weeks.
| Reactor | Hydraulic loading rate (L per day) | Sludge loading rate [kg TCOD/(kg MLSS day)] | Cycle length (h) | SRT (day) | DO (mg L−1) | Operating time in a cycle (min) | Cycles (per day) | ||||
|---|---|---|---|---|---|---|---|---|---|---|---|
| Fill | React | Settle | Decant | Total | |||||||
| A | 0.36 | 0.24 | 8 | 8 | 3–4 | 2 | 448 | 25 | 5 | 480 | 3 |
| B | 0.60 | 0.42 | 8 | 8 | 3–4 | 2 | 448 | 25 | 5 | 480 | 3 |
| C | 0.96 | 0.61 | 8 | 8 | 3–4 | 2 | 448 | 25 | 5 | 480 | 3 |
The reactors were sampled twice a week for physical and chemical analysis according to national standard methods, to ensure that they were running under stable conditions. Regular analyses included pH, TCOD, FCOD, MLSS, turbidity, Dissolved Oxygen (DO), NH4+–N, TN and TP. Infrared spectroscopy analyses (IR, Nicolet 5700, Thermo Electron Scientific Instruments Corp., U.S.A.) were carried out for activated sludge samples from the reactors to compare their extracellular polymeric substance (EPS) structures.
2.2 Detection of heterotrophic antibiotic-resistant bacteria
After five weeks of operation, samples including raw sewage, activated sludge samples, and effluents of the reactors and biosolids were analyzed for antibiotic resistance using classical spread-plating techniques. Before plating, each sample was blended for 3 min to homogenize the culture. 1 mL of each homogenized sample was removed, serially diluted, and then plated in duplicate on nutrient agar (beef extract 3 g L−1, peptone 10 g L−1, NaCl 5 g L−1 and agar 15 g L−1, pH: 7.2 ± 0.2), spiked with different antibiotics. The concentrations of the six antibiotics in the agar were as follows: CEP: 16 mg L−1; ERY: 8 mg L−1; GEN: 16 mg L−1; SD: 512 mg L−1; TC: 16 mg L−1; VAN: 32 mg L−1. According to our previous studies,8 the antibiotic concentrations were defined as the maximum value of all minimum inhibitory concentrations (MICs) for pathogen resistance to an antibiotic listed in the CLSI (Clinical and Laboratory Standards Institute) documentation.12 The plates were then incubated at 37 °C for 24 h. All samples were processed by the standard count technique. Only dilutions with 20–300 CFU per plate were used for colony enumeration. Each sample was also incubated in nutrient agar with no antibiotic added to determine total heterotrophic bacterial count (HPC) levels. Each sample analysis was conducted in triplicate for the statistical analysis.2.3 Data analysis
The results were analyzed using the following method.| μnet = (QeffXeff + QbioXbio − QinXin + VdX/dt)/XV | (1) |
The term dX/dt was calculated by measuring the difference in ARB counts between sampling dates, while the other parameters were measured directly.
| RLeff = Qeff × Xeff | (2) |
| RLbio = Qbio × Xbio | (3) |
| RLtotal = RLeff + RLbio | (4) |
| RLbio/eff = RLeff/RLbio | (5) |
| RL/IL = RLtotal/(QinXin) | (6) |
3. Results and discussion
3.1 The prevalence of various ARB in the activated sludge system
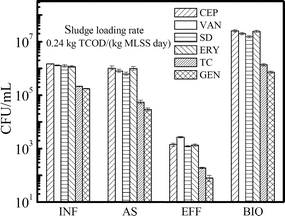
Six kinds of antibiotic-resistant heterotrophic bacteria were detected in the raw sewage (Fig. 2). CEP-resistant bacteria were the most prevalent kind with a concentration of (1.5 ± 0.1) × 106 CFU mL−1, and the proportion to total heterotrophic bacteria was over 50%. VAN-, SD- and ERY-resistant bacteria followed in abundance with proportions over 40%. By comparison, low abundances of TC- and GEN-resistant bacteria were detected in the wastewater, with proportions of 7.5% and 6.1%, respectively.The prevalence of ARB in the reactor with a sludge loading rate of 0.24 kg TCOD/(kg MLSS day) is presented in Fig. 2. All ARB abundances in activated sludge decreased slightly compared to those in the influent. The concentration of CEP-resistant bacteria was (1.0 ± 0.1) × 106 CFU mL−1, which was still the dominant ARB in activated sludge. ERY-, VAN-, and SD-resistant bacteria followed in abundance. The concentrations of GEN- and TC-resistant bacteria also decreased in the activated sludge, with their proportions at 3.3% and 1.8%, respectively. All ARB abundances were significantly enriched in the biosolid samples of the reactor.
The activated sludge system significantly decreased ARB concentrations in the treated effluent; nevertheless all were still detected (Fig. 2). CEP-, VAN-, SD- and ERY-resistant bacteria were still the four dominant kinds, with concentrations of (1.2–2.7) × 103 CFU mL−1. Relatively low abundances of TC- and GEN-resistant bacteria were detected, with concentrations of 190 ± 10 CFU mL−1 and 80 ± 20 CFU mL−1, respectively. However, their proportions were not significantly reduced with values of 1.8% and 0.6%, respectively. The results indicated that the activated sludge treatment process was not so effective in controlling antibiotic resistance, just as many other researchers had observed.1,14
3.2 Release of ARB through the effluent and biosolids of the activated sludge system
To investigate the ARB release from the activated sludge system, release loads of six kinds of ARB through the effluent and biosolids in reactor A [0.24 kg TCOD/(kg MLSS day)] were calculated and are presented in Fig. 3. Bacteria resistant to CEP, VAN, SD and ERY were four major kinds that the system released to the environment through both effluent and biosolids. Their release loads were up to (0.3–8.3) × 105 CFU per day through the effluent and (0.1–4.9) × 107 CFU per day through biosolids, respectively.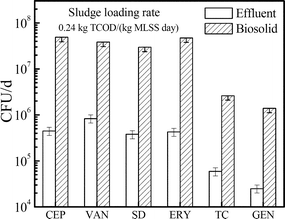 | ||
| Fig. 3 Release loads of six kinds of ARB in effluents and biosolids of the activated sludge system at 0.24 kg TCOD/(kg MLSS day). | ||
On the other hand, compared to the effluent, significantly higher loads of all ARB were released through biosolids. For ERY- and CEP-resistant bacteria, the release load in biosolids was up to 100-fold compared to the value in the effluent. Similarly, the values were 46.2, 78.3, 44.2 and 56.0 for VAN-, SD-, TC- and GEN-resistant bacteria, respectively. These results imply that in a typical activated sludge system, the biosolids are the major pattern for the ARB release. Similar conclusions were also reported by Munir et al., who found that more than 1014 and 1015 CFU per day of TC- and SD-resistant heterotrophic bacteria were released into the environment through biosolids in the WWTPs, while their release loads through the effluent were below 1012 and 1013 CFU per day.1
3.3 Effects of sludge loading rate on the release of ARB from the activated sludge system
The release loads of six kinds of ARB in the effluents and biosolids of the reactors of various sludge loading rates are shown in Fig. 4. Significantly higher release loads for all ARB were detected in the effluent when the sludge loading rate was increased from 0.24 to 0.61 kg TCOD/(kg MLSS day). Especially, for GEN-resistant bacteria, their release loads in a higher sludge loading rate system were up to 11.9-fold of reactor A. The results are probably related to a much higher hydraulic load of the higher sludge loading rate system.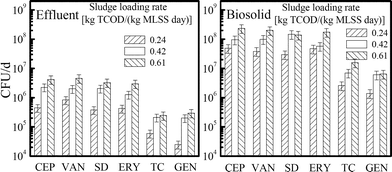 | ||
| Fig. 4 Release load of six kinds of ARB in the effluents and biosolids of the three reactors with sludge loading rates of 0.24, 0.42 and 0.61 kg TCOD/(kg MLSS day), respectively. | ||
Similarly, ARB release loads through the biosolids were also amplified with increased sludge loading rate. Data indicated that the ARB release in the biosolids of reactor C was approximately 3.7–6.0-fold of that in reactor A. It was considered that, in the activated sludge system with good settleability (i.e., SVI = 50–150 mL g−1), the bacterial release loads in the biosolids would be positively related to their concentrations in activated sludge. This hypothesis was confirmed by most ARB behaviors in the study (Fig. S1†). When the sludge loading rate was increased from 0.24 to 0.42 and 0.61 kg TCOD/(kg MLSS day), releases of most ARB (CEP, VAN, SD, ERY and TC) in biosolids varied in accordance with their abundances in the activated sludge.
The release load ratio (ARB release in biosolids/effluent) was introduced to assess the release contribution from biosolids and effluent. Considering the release pattern of antibiotic resistance, it was found that the biosolids were always the main channel for ARB release in all of the three reactors (Fig. 5). When the sludge loading rate increased to 0.61 kg TCOD/(kg MLSS day), the release load ratio (biosolids/effluent) for all ARB decreased significantly from 56.0–110.7 to 21.7–56.2, indicating that more ARB were released through the effluent. However, most ARB were still released through the biosolids. Therefore, the potential risk brought by ARB release through the biosolids, especially in the low sludge loading rate reactor, was more severe than the effluent and should receive more attention. The development of biological treatment processes with less wasted biosolids, such as the MBR and oxidation ditch processes, might contribute to the minimization for ARB release in WWTPs.
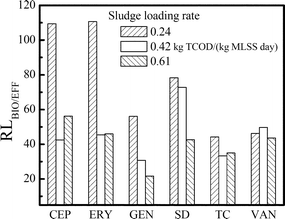 | ||
| Fig. 5 The release load ratios (RLbio/eff) of various ARB in an activated sludge system of different sludge loading rates [0.24, 0.42 and 0.61 kg TCOD/(kg MLSS day)]. | ||
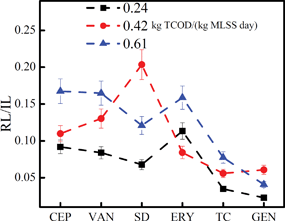
The total release load of antibiotic resistance within the activated sludge system was also greatly influenced by the sludge loading rate. The total release loads of most ARB (expressed by RLtotal) increased significantly when the sludge loading rate was up to 0.61 kg TCOD/(kg MLSS day) (Table S2†). However, considering the three reactors that received different loads of ARB in the raw sewage, which would influence their release in the effluent and biosolids, the total release load might not be suitable to evaluate the impact of the sludge loading rate on ARB release in an activated sludge system. To minimize the interference of input difference of ARB in the raw sewage, another index RL/IL (total release load/input load of the raw sewage) was introduced and calculated, as shown in Fig. 6. It was observed that the value was always less than 1 in all of the three reactors, indicating that most ARB tended to lose resistance after being treated with activated sludge. However, the values in reactor B (0.06–0.20) and reactor C (0.04–0.17) were still significantly higher than reactor A (0.02–0.11). The data implied that, although antibiotic resistance was easy to be lost in the complex matrix, a reactor with higher sludge loading rate would retain more antibiotic resistance, thus resulting in the release of more ARB. This might be connected to the ARB activity in various reactors. A high sludge loading rate provided more nutrients for ARB growth, causing more ARB to be released. From this aspect, an activated sludge system operating at a lower sludge loading rate would be more conducive to the control of the antibiotic resistance.
3.4 Effect of the sludge loading rate on the growth rates of various ARB
It has been demonstrated above that the release of antibiotic resistance in the system was significantly influenced by ARB abundances in activated sludge, which were further determined by their growth characteristics. Therefore, the growth rates of the six kinds of ARB were also explored. The growth rates (expressed by μnet) of all ARB were observed to be prompted significantly when the sludge loading rate increased from 0.24 to 0.42 kg TCOD/(kg MLSS day) (Fig. 7). Further increase of the sludge loading rate still resulted in the amplification of most ARB growth, but to a slighter extent.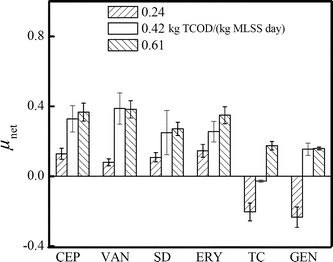 | ||
| Fig. 7 Net specific growth rates (μnet) of various ARB in an activated sludge system of three different sludge loading rates. | ||
The increase of ARB growth rates under operating conditions was also observed previously. Kim et al. found that increases in the organic loading rate resulted in amplification of tetracycline resistance in activated sludge reactors loaded with typical municipal background tetracycline concentrations (1 μg L−1), and those receiving the influent augmented with 250 μg L−1 tetracycline.11
Two possibilities might account for ARB amplification with an increased sludge loading rate. First, antibiotic-resistant populations present in the influent responded favorably to the growth conditions applied and achieved a higher growth rate under a high sludge loading rate. Because of the significantly higher hydraulic loading rate in reactors B and C (Table 1), most ARB in activated sludge were surrounded by an environment with a higher antibiotic concentration, which was generally believed to promote antimicrobial resistance.13,15,16 Second, more frequent transfer of ARGs among bacteria might have occurred in a higher sludge loading rate system, since nutrients were reported to be essential for horizontal gene transfer (HGT).17
However, ARB growth was not greatly increased when the sludge loading rate increased from 0.42 to 0.61 kg TCOD/(kg MLSS day), indicating that considerable superfluous nutrients just promoted the growth rate slightly. According to the Monod equation18 (eqn (7)), which described bacterial growth as a function of the substrate concentration, the bacterial growth rate increased rather slowly with abundant nutrient concentration and eventually achieved a maximum rate (μmax). Here the sludge loading rate in reactor C [0.61 kg TCOD/(kg MLSS day)] represented a considerably high level in a traditional activated sludge process, which is generally 0.2–0.4 kg BOD/(kg MLSS day). Therefore, reactor C provided excess nutrients for ARB growth and the growth rates were not greatly increased compared to reactor B.
 | (7) |
In addition, it should be noted that the μnet of TC- and GEN-resistant bacteria had negative values in the reactor at 0.24 kg TCOD/(kg MLSS day). Concerning that the concentrations of the two ARB were significantly lower than the other four types, it seemed that in a nutrient-insufficient environment, ARB with low abundance (e.g., <10%) hardly retained their resistance and probably lost the ARGs. This might be caused by many possibilities, such as some ARB in the raw sewage hardly surviving in the activated sludge. The decrease of ARG transfer frequency due to the nutrient lack might also account for the result. In addition, the extracellular polymeric substance (EPS) was also reported for their characteristic of influencing the antibiotic resistance.19,20 In our experiment, a significant change of EPS composition with different sludge loading rates was observed (Fig. S2†). A further study on the mechanism by which ARB obtain, maintain and dissipate resistance in activated sludge is proposed, so as to better understand how the sludge loading rate influences the growth of various ARB.
The releases of ARB were largely determined by their growth in the activated sludge. The growth rates of most ARB were promoted with increased sludge loading rate, thus resulting in an increase of their abundances in the activated sludge and the subsequent promotion of their releases through the effluent and biosolids. By comparison, an activated sludge system with a low sludge loading rate limited the growth of ARB and the transfer of ARGs, thus leading to the decrease of antibiotic release.
In general, the activated sludge treatment process was an important source for antibiotic resistance release into the environment. The findings of this study, which investigated the behaviors of six kinds of ARB in effluent/biosolids and the activated sludge, emphasize the relationships between their release and growth. The activated sludge process with a relatively low sludge loading rate and wasted biosolid volume was considered to be advantageous in antibiotic resistance control. Further studies on the comparison and optimization of other treatment processes and more operating conditions are proposed, so as to better minimize the potential risk of antibiotic resistance.
4. Conclusions
In this study three activated sludge treatment processes were constructed to evaluate the effects of the sludge loading rate on the releases and growth rates of six kinds of ARB. The biosolids were the principal pattern for all ARB release in the activated sludge system. The release load ratio (biosolids/effluent) was 44.2–110.7 at 0.24 kg TCOD/(kg MLSS day) and 21.7–56.2 at 0.61 kg TCOD/(kg MLSS day). More ARB were released through the effluent when the sludge loading rate increased.The growth rates of most ARB were promoted greatly with increased sludge loading rate from 0.24 to 0.42 kg TCOD/(kg MLSS day) but did not change significantly with the further increase of the sludge loading rate. The growth of most ARB in activated sludge largely determined their releases through the effluent and biosolids.
The release loads for all ARB in the effluent and biosolids were both significantly amplified when the sludge loading rate increased from 0.24 to 0.61 kg TCOD/(kg MLSS day). The total release loads for ARB were also significantly increased with increased sludge loading rate. A lower sludge loading rate was considered more conducive to the control of antibiotic resistance in activated sludge.
Acknowledgements
This project was funded by the National Natural Science Foundation of China (51308399) and Shanghai Natural Science Foundation (13ZR1443300). The authors would like to thank the engineers of the WWTP for their assistance in obtaining the wastewater samples. The authors also express their gratitude to Prof. James Bolton for writing improvement and to doctoral student Liu Suqing for his help in infrared spectroscopy analysis.Notes and references
- M. Munir, K. Wong and I. Xagoraraki, Water Res., 2011, 45, 681–693 CrossRef CAS PubMed.
- T. R. Burch, M. J. Sadowsky and T. M. Lapara, Front. Microbiol., 2013, 4, 1–9 Search PubMed.
- L. Rizzo, C. Manaia, C. Merlin, T. Schwartz, C. Dagot, M. C. Ploy, I. Michael and D. Fatta-Kassinos, Sci. Total Environ., 2013, 447, 345–360 CrossRef CAS PubMed.
- A. Luczkiewicz, K. Jankowska, S. Fudala-Ksiazek and K. Olanczuk-Neyman, Water Res., 2010, 44, 5089–5097 CrossRef CAS PubMed.
- G. Morozzi, R. Sportolari, G. Caldini, G. Cenci and A. Morosi, Zentralbl. Bakteriol., Mikrobiol. Hyg., Ser. B, 1988, 185, 340–349 CAS.
- S. R. Andersen, Curr. Microbiol., 1993, 26, 97–103 CrossRef CAS.
- J. J. Huang, H. Y. Hu, S. Q. Lu, Y. Li, F. Tang, Y. Lu and B. Wei, Environ. Int., 2012, 42, 31–36 CrossRef CAS PubMed.
- M. T. Guo, Q. B. Yuan and J. Yang, Water Res., 2013, 47, 6388–6394 CrossRef CAS PubMed.
- M. T. Guo, Q. B. Yuan and J. Yang, Chemosphere, 2013, 93, 2864–2868 CrossRef CAS PubMed.
- S. Threedeach, W. Chiemchaisri, T. Watanabe, C. Chiemchaisri, R. Honda and K. Yamamoto, Bioresour. Technol., 2012, 113, 253–258 CrossRef CAS PubMed.
- S. Kim, J. N. Jensen, D. S. Aga and A. S. Weber, Water Sci. Technol., 2007, 55, 291–297 CrossRef CAS.
- Clinical and Laboratory Standards Institute (CLSI), Performance standards for antimicrobial susceptibility testing: twenty-first informational supplement, 2011, vol. 31 Search PubMed.
- S. Kim, J. N. Jensen, D. S. Aga and A. S. Weber, Chemosphere, 2007, 66, 1643–1651 CrossRef CAS PubMed.
- P. M. da Costa, P. Vaz-Pires and F. Bernardo, Water Res., 2006, 40, 1735–1740 CrossRef PubMed.
- A. Tello, B. Austin and T. C. Telfer, Environ. Health Perspect., 2012, 120, 1100–1106 CrossRef PubMed.
- P. Gao, M. Munir and I. Xagoraraki, Sci. Total Environ., 2012, 421–422, 173–183 CrossRef CAS PubMed.
- L. Guardabassi and A. Dalsgaard, Occurrence and fate of antibiotic resistant bacteria in sewage. Danish EPA Environmental Project Report, 2002, No. 722 Search PubMed.
- F. P. Healey, Microb. Ecol., 1980, 5, 281–286 CrossRef CAS PubMed.
- C. F. Forster, Water Res., 1985, 19, 1259–1264 CrossRef CAS.
- J. W. Costerton, L. Montanaro and C. R. Arciola, Int. J. Artif. Organs, 2005, 28, 1062–1068 CAS.
Footnote |
| † Electronic supplementary information (ESI) available. See DOI: 10.1039/c4em00197d |
| This journal is © The Royal Society of Chemistry 2015 |


