Improved silica–titania catalysts by chitin biotemplating
Alexander
Sachse
a,
Vasile
Hulea
a,
Krassimir L.
Kostov
b,
Emmanuel
Belamie
a and
Bruno
Alonso
*a
aInstitut Charles Gerhardt Montpellier, UMR 5253 CNRS/UM2/ENSCM/UM1, 8 rue de l'Ecole Normale, 34296 Montpellier Cedex 5, France. E-mail: bruno.alonso@enscm.fr
bInstitute of General and Inorganic Chemistry, Bulgarian Academy of Sciences, Acad. G. Bonchev. Str., bl. 11, 1113 Sofia, Bulgaria
First published on 29th August 2014
Abstract
Silica–titania materials with improved catalytic performance were elaborated as mesoporous microparticles by combining sol–gel and spray-drying processes with the self-assembly properties of α-chitin nanorods acting as biotemplates. Three different synthesis approaches are discussed, leading to materials with varied textural and chemical characteristics studied by SEM, N2 volumetry, TEM, XPS and DR-UV techniques. The use of water or ethanol as initial solvent for chitin nanorod suspensions, as well as the mixing conditions of the precursors, has been shown to have a significant impact on the final properties. Materials of specific surface areas of up to 590 m2 g−1 and porous volumes of up to 0.84 mL g−1, with low surface Si/Ti ratio, could be disclosed. Properties were further investigated by employing the silica–titania materials as heterogeneous catalysts for the sulfoxidation of bulky model compounds. The location of Ti active sites at the pore surface has been maximized and allows for improved productivity.
1. Introduction
Very recently, we have published a novel and green synthesis route, which implies the use of chitin nanorods as templates for the achievement of very active mesoporous silica–titania catalysts.1 This research has been motivated by the fact that promising alternatives for the formation of silica–titania catalysts are highly demanded especially from the petroleum and pharmaceutical industry.2 Indeed, desulfurization with H2O2 by catalytic oxidation using silica–titania catalysts is a valuable alternative for the elimination of sulfur-containing compounds from fuels by conversion of sulfides into the corresponding sulfoxides and sulfones which can easily be extracted due to their increased polarity.3–5 Furthermore, catalytic sulfoxidation has attracted a great deal of attention for the production of fine chemicals.6Several different silica–titania catalysts are known in the literature. The first ones to be disclosed were Ti-containing zeolites such as TS-1, TS-2 and Ti-beta, which proved to be very active catalysts for a variety of oxidation reactions with H2O2.7–10 Notwithstanding, these materials have been shown to have important drawbacks which are mainly related to the sole presence of micropores, thus limiting the accessibility of large molecules to active sites. As a result, much effort has been devoted to the synthesis of mesoporous amorphous TiO2–SiO2 mixed oxides. Strategies for the synthesis of these materials became available from the early 1990s.11 Examples hereof are the direct synthesis of ordered mesoporous materials (e.g. Ti-MCM-41, Ti-MCM-48),12–15 the grafting of Ti species onto mesoporous silicas16,17 and both hydrolytic18,19 and non-hydrolytic20,21 sol–gel synthesis routes. Most of these materials proved to be active catalysts for oxidation reactions of larger molecules, especially with dry organic hydroperoxides, but not with H2O2. Another drawback of these materials is that their synthesis often relies on complex techniques (use of glove box, dry solvents, etc.), and in some cases, expensive template materials such as CTAB are employed. Other synthesis approaches must then be explored.
Green chemistry is a general trend, mainly motivated by the desire to generate products by sustainable means.22,23 Within this, alternative synthesis routes for the formation of heterogeneous catalysts by the so-called green pathways are the center of attention.24–27 Various research groups have published the achievement of porous materials by bio-inspired techniques28–35 using self-assembled polysaccharide nanocrystals, in combination with sol–gel processes for the transcription of textural properties in the new materials.36–42
A novel and versatile route for the formation of porous silicas has been described by some of us.37,38 This approach combines the self-assembly properties of α-chitin nanorods43,44 with sol–gel processes involving siloxane oligomers. There are several advantages of applying this strategy to the synthesis of mesoporous materials, among which are a) the use of renewable chitin precursors coming from crustacean (shrimps, crabs, etc.) fisheries where crustacean shells in tremendous quantities are considered as waste products, b) the use of α-chitin nanorods acting as hard templates (D = 23 ± 3 nm, L = 260 ± 80 nm) and also possessing complexing groups (–OH, –NH2) at their deacetylated surfaces, c) the high modularity of the final pore textures relying on the self-assembly properties of α-chitin nanorods, d) the use of low-temperature sol–gel processes, and e) the flexibility of sol–gel processes allowing for shaping of the materials (i.e. microparticles through spray-drying) and for incorporating other elements.
More recently, we have shown that this combination of chitin self-assembly, sol–gel chemistry and spray-drying processes allows us to obtain new efficient silica–titania catalysts.1 Here, the use of spray-drying offers other advantages:45 a) all reactants are incorporated in the final microparticles, b) the waste solvent is recycled through a condensing unit, and c) the continuous production of materials with a desired spheroidal morphology is achieved. An additional advantage of this technique is the quenching of metastable states by fast solvent evaporation and solidification whilst offering opportunities to fine-tune the mesoporosity and chemical composition of the resulting solid.46–48
In this study, we widen the synthetic possibilities in order to improve the textural properties and catalytic performance of the obtained silica–titania mixed oxides. In particular, we tried to modulate the distribution of Ti sites at the pore surfaces by playing with the initial preparation of the sols, in view of greener process intensification.
2. Results and discussion
Three different strategies were investigated for the elaboration of porous silica–titania catalysts, with the aim of reaching an improved control of colloidal and molecular interactions and hence achieving better defined interfaces and active site distributions. The first (series A), based on our preliminary communication,1 is achieved by mixing an ethanolic sol of siloxane oligomers (~3 nm in size) with fixed amounts of the titanium monomer precursor diacetylacetonatediisopropoxide titanium(IV) Ti(OiPr)2(acac)2. Subsequently, an aqueous suspension of α-chitin nanorods is added. To prevent uncontrolled condensation of the inorganic precursors, water is rapidly removed from the resulting mixture by repeated evaporation cycles near the water–ethanol azeotrope composition. The resulting ethanolic suspension is subsequently spray-dried at 393 K in order to obtain fine powders named SiO2/TiO2-A materials (Scheme 1A). In the second strategy (series B), the ethanolic mixture, containing Ti(OiPr)2(acac)2 and siloxane oligomers, is added to α-chitin nanorods directly suspended in ethanol. Since no water is present in this mixture, this stable suspension is directly spray-dried to give SiO2/TiO2-B materials (Scheme 1B). Finally, the third strategy (series C) was designed to favor interactions between the Ti units and the α-chitin nanorod surface, with the aim of enriching the pore surfaces with Ti active sites after chitin removal. To this purpose, Ti(OiPr)2(acac)2 was first mixed with the ethanolic chitin suspension, and the suspension of siloxane oligomers was subsequently added (Scheme 1C).The α-chitin polysaccharide nanorods present in the hybrid materials are removed by calcination in air at 823 K, resulting in the creation of porosity. During this process, the inorganic network also condenses further. The textural parameters of the materials are greatly influenced by the amount of chitin added during the synthesis (expressed as the chitin volume fraction, ϕCHI, using eqn (1) in the experimental section).
2.1 Series A materials
Morphology
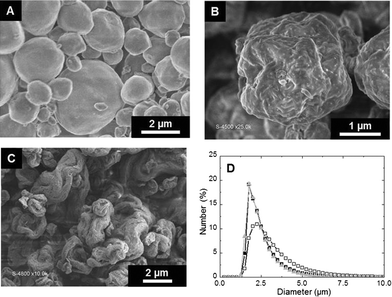
Spheroidal microparticles of narrow size distribution are formed by spray-drying (Fig. 1). The particle size distribution is slightly affected by variations in the composition – in particular chitin and Ti contents – and the average diameter is approximately constant (average size of 2.5 μm). In contrast, the morphology of the particles changes importantly. SEM observations show that particles synthesized with low chitin volume fractions (i.e. ϕCHI = 0.15) have very smooth surfaces (Fig. 1A). Surface roughness increases with increasing chitin volume fraction (Fig. 1B and C), in agreement with former results on chitin–silica nanocomposites.10 Moreover, for materials prepared with a high chitin content (ϕCHI = 0.65), the spherical shape is lost and particles with a more complex morphology are formed with high surface roughness.Texture
The evolution of the nitrogen sorption behavior of calcined SiO2/TiO2-A materials as a function of chitin volume fraction is presented in Fig. 2. All samples present hysteresis loops related to the presence of mesopores. The shape of the loops is of type H2,49 similar to those already obtained for pure mesoporous silica templated by the same type of α-chitin nanorods.38 The main textural parameters (mesoporous volume, specific surface area and pore size) are found to increase with increasing chitin volume fraction, ϕCHI (Table 1). The pore volume fraction (ϕPOR) is deduced from the maximum of sorption in nitrogen isotherms and is calculated using eqn (2). From the nitrogen isotherms, one can thus deduce that in a range of ϕPOR = 0.10–0.53, the BET surface area (SBET) increases gradually from 70 to 445 m2 g−1, whilst the average pore size increases slightly from 5 to 6 nm (Table 1). For the lowest ϕPOR (=0.10), tensile strength effect50 is observed at p/p0 = 0.45, which indicates that pores have formed as internal cavities and will thus not be accessible for larger molecules in this case (as was deduced from catalytic tests, see below).| Initial ϕCHI | Final ϕPOR | S BET (m2 g−1) | V (mL g−1) | Average pore size (nm) |
|---|---|---|---|---|
| 0.15 | 0.10 | 72 | 0.06 | 5.0 |
| 0.25 | 0.17 | 91 | 0.09 | 5.1 |
| 0.33 | 0.24 | 170 | 0.17 | 5.4 |
| 0.50 | 0.34 | 256 | 0.27 | 5.7 |
| 0.65 | 0.53 | 443 | 0.60 | 6.0 |
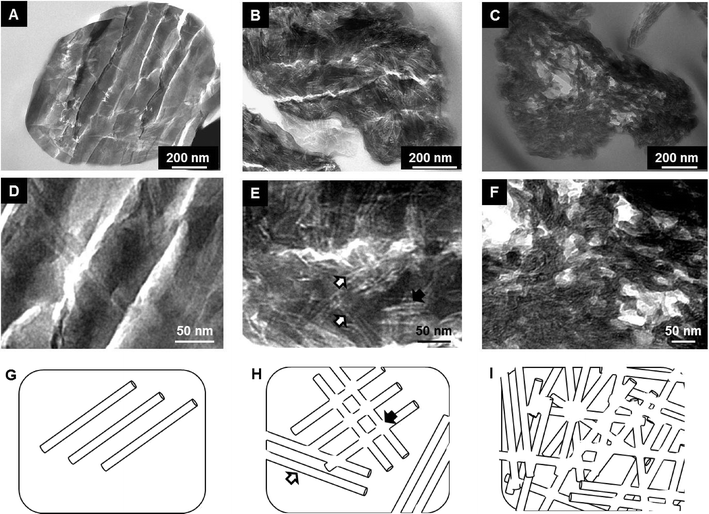
Interestingly, the sorption isotherm of the sample with ϕCHI = 0.65 shows a profile different from that of the other samples. For this sample, in addition to the first hysteresis loop with an inflexion point on the desorption branch located near p/p0 = 0.6 (VPOR = 0.60 mL g−1), a second hysteresis appears at higher partial pressure. This can be explained by chitin nanorods being in excess in the mixture with respect to siloxane oligomers, which therefore cannot fully cover the surface of the chitin nanorods. It should be noted that the critical ϕCHI* value above which α-chitin nanorods are not fully covered by silica has been estimated to be in the range of 0.2–0.4.37 Hence, some of the chitin nanorods can cling together during synthesis, resulting in larger pores upon chitin removal (Fig. 4I). Similar features were also observed for porous silica without titanium, templated with α-chitin nanorods.37,38
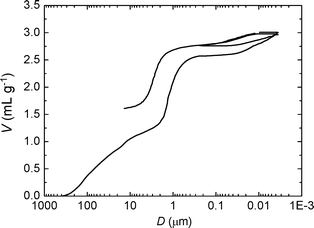
To explore more in detail the porosity of materials obtained with ϕCHI = 0.65, a mercury porosimetry analysis was carried out (Fig. 3). The interparticle filling is firstly observed up to a volume of 1.3 mL g−1 (corresponding to a size of 100 nm to 5 μm). A sharp step then followed which reveals a narrow size distribution of macropores within the particles (2.5–0.2 μm) corresponding to a macroporous volume of 1.3 mL g−1 (2.6–1.3 = 1.3 mL g−1). This step is then followed by a plateau where the intrusion volume stays constant. A second, weaker step corresponds to the mercury intrusion into the mesoporosity within the sample showing a volume of 0.6 mL g−1 (3.2–2.6 = 0.6 mL g−1), thus confirming the results obtained by nitrogen sorption. In order to assess the mechanical stability of the sample, the intrusion/extrusion cycle was repeated at high pressures. The shape of the second intrusion/extrusion cycle is very similar to the first one, suggesting that the particles are stable to a pressure as high as 4000 bars. This is not the case for other kinds of mesoporous silica particles.51
Porosity has further been investigated by TEM (Fig. 4). The electron-clear structures reveal the presence of elongated pores within the oxide network, whose proportion increases with ϕCHI. Pore sizes estimated from TEM images are consistent with the dimensions of the pores calculated by the BdB method from the desorption branch in nitrogen sorption isotherms. Larger electron-clear features in the images (cracks) are microtomy artifacts and should thus be disregarded. We have observed that up to 10 mol% of Ti added (Si/Ti ≥9), complex textural parameters are not subjected to major variations and are similar to those obtained for pure siliceous materials.
Local structure
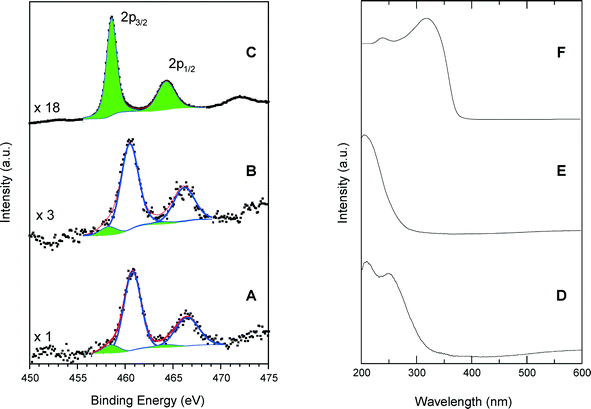
Fig. 5 shows a comparison of Ti 2p photoelectron and UV-vis spectra of calcined SiO2/TiO2-A material (ϕCHI = 0.65, Si/Ti = 19) with those of TS-1 and anatase. The dominant XPS features are associated with the Ti 2p3/2 and Ti 2p1/2 peaks with a spin–orbital splitting between them of 5.7 eV, characteristic of the Ti4+ valence state. However, Ti can be in different coordination states in the studied samples. For example, in the anatase crystal, the titanium atoms are in octahedral oxygen coordination (TiOh) with a Ti 2p3/2 binding energy of 458.6 eV (Fig. 5C). Also, it is known that in the structure of a titanium silicalite TS-1 catalyst, the Ti atoms are in a tetrahedral coordination state (TiTd), and for this configuration, we have measured a Ti 2p3/2 binding energy of 460.5 eV (Fig. 5B). This large difference in the Ti 2p3/2 binding energies for the two coordination states allows us to reliably determine the local Ti environment in the synthesized materials. In the spectrum of TS-1, used as standard for tetrahedral coordination, spectrum deconvolution suggests the existence of additional 2p peaks at 458.2 and 463.9 eV (Fig. 5B), thus indicating the presence of small amounts of TiOh atoms (about 8% of total Ti).Similarly, the calcined samples exhibit a majority of TiTd sites, as visible in Fig. 5A where intense Ti 2p3/2 and Ti 2p1/2 peaks have been measured at 460.5 and 466.2 eV, respectively. A small amount of octa-coordinated Ti associated with weaker peaks at 458.3 and 464.0 eV is also detected, yielding a TiTd/TiOh molar ratio of about 9.
The results obtained by DR UV-vis spectroscopy confirm the results of XPS modeling. The DR UV-vis spectrum of the SiO2/TiO2-A sample exhibits a main absorption band centered at 210 nm and a shoulder at 260 nm (Fig. 5D). The adsorption band at 210 nm is attributed to tetrahedral sites within the sample, since a strong absorption band is obtained at the same wavelength for TS-1 (Fig. 5E). On the contrary, the anatase sample shows a characteristic absorption band split into two maxima near 245 and 315 nm with a well-defined absorption edge at 390 nm. These features, in agreement with typical anatase spectra, are related to the O2–Ti4+ charge transfer and are not present in the spectra of our silica–titania materials.
SiO2/TiO2-A calcined samples made with different ϕCHI and/or Si/Ti ratios have also been studied by XPS. Systematically, the Si/Ti molar ratio estimated by XPS is well above the Si/Ti molar ratio of the bulk (Table 2). As XPS is mainly probing the sample surface at the nanometer scale, this can be understood as a preferential location of Ti atoms far from the microparticle surface, probably close to the pores generated by the chitin nanorod removal. Indeed, during the synthesis, the Ti(OiPr)2(acac)2 precursor can interact with the chitin nanorod surface, notably through the pending –OH or –NH2 groups that can complex Ti4+ cations as deducted from chitosan–titania hybrid materials.52 It can thus be interesting to exploit these possible Ti–chitin interactions in order to achieve SiO2/TiO2 catalysts with Ti active sites preferentially located at the pore surface.
| ϕ CHI | Bulk Si/Ti | Surface Si/Ti (XPS) |
|---|---|---|
| 0.15 | 19 | ~36 |
| 0.33 | 19 | ~33 |
| 0.65 | 19 | ~34 |
| 0.65 | 39 | ~70 |
| 0.65 | 70 | ~112 |
2.2 Alternative syntheses of silica–titania catalysts (series B and C)
Chitin nanorods are usually stabilized in aqueous acidic media to prepare stable suspensions that were shown to exhibit liquid crystal properties.44 We recently demonstrated that chitin nanorods can be stably dispersed in ethanol at low or moderate concentrations (below 10 wt%).53 Therefore, we explored alternative synthesis routes where both precursors are suspended in ethanol and directly mixed, thus avoiding time-consuming preparation steps. In particular, the elimination of water by solvent exchange and evaporation steps to avoid uncontrolled condensation and precipitation is no longer necessary. The resulting stable suspensions can be stored and readily processed at any time to elaborate materials, by spray-drying for instance. The materials obtained with chitin ethanolic suspensions are labeled as SiO2/TiO2-B and -C, depending on the order of precursor addition, as summarized in Scheme 1.Texture
Nitrogen sorption isotherms for all synthesis procedures (series A, B and C) have been recorded for calcined materials (Fig. 6 and Table 3). Comparing the nitrogen isotherms at different ϕCHI values reveals three important conclusions: a) the isotherms obtained for series B and C materials are very similar at equal ϕCHI, b) the isotherms of SiO2/TiO2-B and -C materials show higher nitrogen sorption volumes in the entire p/p0 range compared to SiO2/TiO2-A materials at equal ϕCHI and c) the profile of the nitrogen isotherms is similar for all materials at constant ϕCHI. | ||
| Fig. 6 Nitrogen sorption isotherms at 77 K for SiO2/TiO2-A (black) and -C (gray) samples synthesized with ϕCHI = 0.15 (A), 0.33 (B) and 0.65 (C) for Si/Ti = 19. | ||
| ϕ CHI | ϕ POR | S BET (m2 g−1) | V (mL g−1) | Pore size (nm) | ||||||||
|---|---|---|---|---|---|---|---|---|---|---|---|---|
| A | B | C | A | B | C | A | B | C | A | B | C | |
| 0.15 | 0.10 | 0.15 | 0.15 | 72 | 210 | 220 | 0.06 | 0.10 | 0.09 | 5 | 5 | 5 |
| 0.33 | 0.24 | 0.34 | 0.34 | 170 | 265 | 259 | 0.17 | 0.27 | 0.29 | 6 | 6 | 6 |
| 0.65 | 0.53 | 0.61 | 0.62 | 443 | 590 | 585 | 0.60 | 0.82 | 0.84 | 6; 30 | 6; 30 | 6; 30 |
Textural properties for materials synthesized with ϕCHI = 0.15, 0.33 and 0.65 are listed in Table 3. For materials synthesized with ϕCHI = 0.15 and 0.33, isotherms with defined porosities are obtained. In the case of ϕCHI = 0.15, the desorption relative pressure corresponds to the phenomenon of tensile strength effect at 0.45 p/p0; thus, the majority of formed pores should be inaccessible to larger molecules. For ϕCHI = 0.33 (Fig. 6B), capillary condensation is observed (with pore sizes of 5 nm for all materials). SBET and pore volume increase considerably using ethanolic chitin suspension during the synthesis (Table 3). For higher ϕCHI values (i.e. 0.65, Fig. 6C), hierarchical porous systems are obtained with a primary porosity resulting from the imprint of isolated chitin monocrystals (pore size ~5 nm) and a second porosity with mesopore sizes above 15 nm (see mercury porosimetry, Fig. 3). Profiles of the nitrogen isotherms for both processes at ϕCHI = 0.65 are very similar, but here again higher specific surface areas are achieved for the SiO2/TiO2-B and -C samples, as high as 590 m2 g−1.
As deduced from nitrogen sorption (Table 3), the synthesis procedures using chitin suspensions in ethanolic medium (series B and C) invariably result in higher specific surface areas and pore volumes compared to samples obtained with the aqueous chitin suspensions (series A). This might be related to the presence of water in the early steps of synthesis route A, before its azeotropic removal, which may affect the chemical stability of siloxane oligomers and partially interfere with colloidal interactions between chitin nanorods and siloxane oligomers. Although the proportion of Ti is low, we might also consider the effect of the different procedures on the interactions of chitin and siloxane oligomers with Ti(OiPr)2(acac)2. Furthermore, the relation between ϕCHI and ϕPOR has been studied for the obtained materials (Fig. 7). For the SiO2/TiO2-A materials, pore volume fraction (ϕPOR) linearly correlates to chitin volume fraction (ϕCHI) with ϕPOR = 0.79ϕCHI. For series SiO2/TiO2-B and -C, the proportionality factor is very close to one, ϕPOR ≈ ϕCHI, indicating that nearly all the chitin introduced in the initial mixture participates in the creation of porosity. This again points out the possible role of small amounts of water initially present in route A in creating inhomogeneities, while the same process in the absence of water (series B and C) yields very homogeneous hybrid samples.
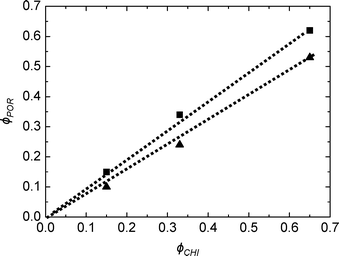 | ||
| Fig. 7 Pore volume fraction as a function of chitin volume fraction ϕCHI for SiO2/TiO2-A (▲) and SiO2/TiO2-C (■) for Si/Ti = 19. | ||
Local structure
For SiO2/TiO2-B and SiO2/TiO2-C materials, there is a significant difference in color of the prepared solutions prior to spray-drying. Precursor solutions to obtain SiO2/TiO2-C show a less intense coloration than SiO2/TiO2-B precursor solutions (the yellow colour comes from the complexation of Ti with acetylacetonate (acac)). This gives an indication that more Ti4+ cations have possibly been complexed by chitin surface groups in the series C solution compared to the series B (and after spray-drying and calcination, more Ti sites could be closer to the pore surface). Unfortunately, we were not able to quantify the amount of free Ti complex in solution by UV-visible spectroscopy, as the α-chitin nanorods themselves diffuse over a wide spectrum, overlapping with adsorption from the Ti complex.XPS was used to gain insight into the distribution and environment of Ti sites, in relation to the synthesis procedure and interactions between the precursors. We have estimated surface Si/N molar ratios by XPS and compared them to bulk Si/N molar ratios for non-calcined B and C samples (Table 4). Surface Si/N ratios are always higher than the bulk ones, which reflects the internal organisation of the samples where chitin nanorods (N-containing domains) are covered by a siloxane network. We also notice that for the C series, Si/N ratios are higher than for the B series, indicating a stronger phase separation between chitin nanorods and the siloxane network. We have also checked the Si/Ti molar ratios in non-calcined and calcined samples (Table 4). Interestingly, we observe that surface Si/Ti ratios are always higher than the bulk ratios for series C samples as shown earlier for sample A (Table 2) but different from sample B (it only occurs at low Si/Ti in this case). For series C, there is thus again a preferential location of Ti away from the microparticle surface, probably close to the pores made by the chitin nanorods. These differences between series A, B and C in porosity and Ti location will greatly influence the accessibility of the active sites and therefore the catalytic performance of the materials.
| Type of sample | Bulk Si/Ti | Surface Si/Ti (XPS) | Bulk Si/N | Surface Si/N (XPS) |
|---|---|---|---|---|
| B non-calcined | 19 | ~28 | 2.4 | ~4.4 |
| B non-calcined | 39 | ~26 | 2.4 | ~5.1 |
| B non-calcined | 70 | ~55 | 2.4 | ~4.9 |
| C non-calcined | 19 | ~40 | 2.4 | ~19.5 |
| C non-calcined | 39 | ~61 | 2.4 | ~12.4 |
| C non-calcined | 70 | ~90 | 2.4 | ~8.9 |
| B calcined | 19 | ~130 | ||
| B calcined | 39 | ~36 | ||
| B calcined | 70 | ~62 | ||
| C calcined | 19 | ~31 | ||
| C calcined | 39 | ~52 | ||
| C calcined | 70 | ~90 |
2.3 Catalysed sulfoxidation reactions
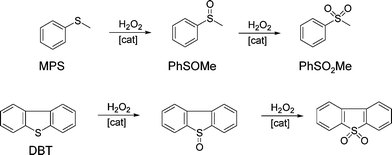
The catalytic behaviour of the synthesized silica–titania materials was evaluated in the mild oxidation of methyl-phenyl sulfide (MPS) and dibenzothiophene (DBT) with hydrogen peroxide. The main oxidation products (representing more than 95% of the product mixture) are displayed in Scheme 2 for each reaction. The oxidation of sulfides and thiophene derivatives can be considered as model reactions for two important industrial applications: sulfoxide/sulfone synthesis and sulfur removal from fuels.4,54,55 The typical kinetic profiles for the oxidation of MPS and DBT are plotted in Fig. 8A and B, respectively. The oxidation of MPS led to the formation of sulfoxide and sulfone as products. On the contrary, the kinetic profile of the DBT oxidation showed that sulfone was selectively formed; only traces of sulfoxide were found among the oxidation products at low levels of DBT conversion. Taking into account the previous results obtained on various catalysts,4,56,57 it is reasonable to assume that the product of the first stage in the oxidation with H2O2 is the DBT sulfoxide, but it is rapidly converted into sulfone in a second oxidation step.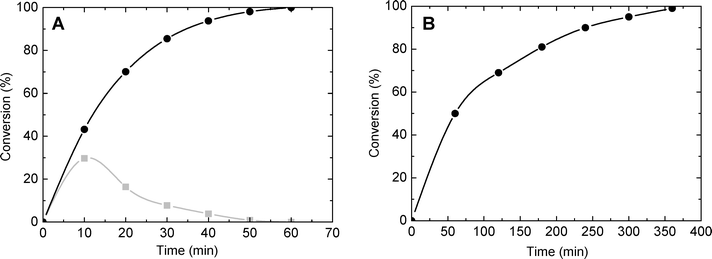 | ||
| Fig. 8 Conversion of MPS (A) and DBT (B) as a function of time (catalyst SiO2/TiO2-A with Si/Ti = 19 and ϕPOR = 0.53). Gray: mono-oxidized product. Black: di-oxidized product. | ||
To obtain information about the effect of the catalyst porosity, the oxidation of MPS and DBT was carried out over SiO2/TiO2-A catalysts with variable ϕPOR and constant molar ratio of Si/Ti = 19. The experimental data are summarized in Table 5. As previously reported,1 for both molecules a strong and almost linear dependence between the conversion and ϕPOR was observed. Thus, after 50 min of reaction time, the conversion of MPS into sulfone was 13% and 98% for ϕPOR = 0.10 and 0.53, respectively.
As far as initial reaction rates are concerned, they follow an exponential increase from 0.02 to 0.25 mmol min−1 g−1 for ϕPOR = 0.10 and 0.53, respectively. For comparison, the oxidation of DBT in the presence of the TS-1 zeolite gave very low conversion (2% after 120 min) with a corresponding productivity of 0.007 mmol min−1 g−1.
It is known that the efficiency in catalysis is proportional to the accessibility to active sites when the system is outside the diffusion limitations. An increase in catalytic efficiency can thus be obtained by increasing the amount of accessible active sites. This can be achieved either by increasing the number of active sites on the surface or by increasing the specific surface area and thus increasing the total amount of active sites.
As discussed above, by changing the synthesis conditions (all ethanol), SiO2/TiO2-B and SiO2/TiO2-C, mixed oxides with improved characteristics were obtained. These materials should be catalytically more active than the SiO2/TiO2-A materials, as they show higher specific surface areas and should thus have more accessible Ti sites. Fig. 9 compares the performance in the MPS oxidation of catalysts A, B and C with Si/Ti = 19 and ϕCHI = 0.15, 0.33 and 0.65. The initial reaction rates are plotted in Fig. 9A, the productivities (in millimoles of MPS converted per minute per gram of catalyst) after 30 min are plotted in Fig. 9B and the initial reaction rates normalized by specific surface area are shown in Fig. 9C.
 | ||
| Fig. 9 Initial reaction rate (A), productivity after 30 min (B) and initial reaction rate averaged over specific surface area (C) as a function of initial chitin volume fraction ϕCHI (Si/Ti = 19). | ||
As expected, the initial reaction rate and the productivity increase as ϕCHI is increased from 0.15 to 0.65, mostly reflecting the increase in surface area. Also, there is no significant distinction between the different samples at ϕCHI = 0.15. This can be explained by the lack of accessibility of most of the internal surface. In contrast, at ϕCHI = 0.33 and 0.65, the initial reaction rate for the SiO2/TiO2-C catalyst is significantly higher compared to SiO2/TiO2-B and -A. The same tendency is observed in terms of productivity at ϕCHI = 0.33. Productivities at high initial chitin volume fraction (i.e. ϕCHI = 0.65) are similar for SiO2/TiO2-B and -C and higher than for SiO2/TiO2-A.
Except at low ϕCHI = 0.15, the initial reaction rate normalized by the specific surface area is highest for SiO2/TiO2-C materials (Fig. 9C). Therefore, initial mixing of the Ti precursor with chitin nanorods (series C) makes the resulting materials more efficient than the two other types (series A and B) by a factor of 1.4 and 1.2 for ϕCHI = 0.33 and 0.65, respectively. This should be related to the enrichment in Ti sites near the pore surface, as suggested by XPS measurements (Table 4), possibly resulting from complexation of Ti atoms by chitin surface groups. For the samples of series A and B at these two compositions, very similar values of Vint/SBET are obtained, underlying the direct role of higher surface area in the increase of the initial rate (Fig. 9A). Surprisingly, in the particular case of ϕCHI = 0.15, the highest value of Vint/SBET is obtained for SiO2/TiO2-A. We attribute this apparently higher efficiency to the much higher surface area measured for samples B and C taken into account by the normalization, a large proportion of which being non-accessible internal porosity.
Effect of the Ti content
In order to emphasize the effect of the Ti amount in catalysts, SiO2/TiO2-A, -B and -C samples with ϕCHI = 0.65 and Si/Ti ratios of 19, 38 and 68 have been tested in the MPS oxidation under standard conditions. The catalytic results, expressed in terms of initial reaction rate, productivity after 30 min of reaction and ratio between the initial reaction rate and the specific surface area, are summarized in Table 6.| Si/Ti = 19 | Si/Ti = 38 | Si/Ti = 68 | |||||||
|---|---|---|---|---|---|---|---|---|---|
| A | B | C | A | B | C | A | B | C | |
| V int (mmol min−1 g−1) | 1.29 | 1.69 | 1.98 | 1.19 | 1.45 | 1.87 | 0.56 | 0.84 | 1.16 |
| P 30 (mmol min−1 g−1) | 0.86 | 0.99 | 1.00 | 0.78 | 0.81 | 0.91 | 0.33 | 0.61 | 0.67 |
| V int/SBET (mmol min−1 m−2) | 2.9 | 2.9 | 3.4 | 2.7 | 2.5 | 3.2 | 1.3 | 1.4 | 2.0 |
The comparison in terms of initial reaction rate reveals that SiO2/TiO2-C samples always have higher values than the other catalysts. It is important to note that for SiO2/TiO2-C with Si/Ti = 68 the same initial rate is obtained as for SiO2/TiO2-A with Si/Ti = 38. In other words, with the new synthesis procedure (SiO2/TiO2-C materials), the total amount of Ti introduced can be cut in half while maintaining the same initial reaction rate. Concerning the productivity at 30 min of reaction, it is 0.86 mmol min−1 g−1 for SiO2/TiO2-A and about 1 mmol min−1 g−1 for SiO2/TiO2-B and -C. A similar order of activity is observed for samples with Si/Ti = 38 but with overall slightly lower productivities. For the system with the lowest amount of Ti (i.e. Si/Ti = 68), the value of P30 for SiO2/TiO2-B and -C is twice that exhibited by the SiO2/TiO2-A sample.
Again, normalization of initial reaction rates by specific surface area shows that the increase in productivity, Vint, is due to the increase in the specific surface area of SiO2/TiO2-B compared to SiO2/TiO2-A. Hence, in this case, increase in active site accessibility is directly related to the increase in surface area. The situation is different for SiO2/TiO2-C samples, where higher Vint/SBET values are obtained for all Si/Ti ratios. This reinforces the conclusion that syntheses performed in ethanol (B and C) yield higher porosity than when water is initially present in the system. In addition, the mixing and interaction of Ti precursors with chitin particles prior to adding the siloxane oligomers (route C) favors the distribution of Ti sites near the pore surface by a factor of 1.2, 1.3 and 1.4 for Si/Ti ratios of 19, 38, and 68, respectively, compared to routes A and B.
Recycling of catalysts
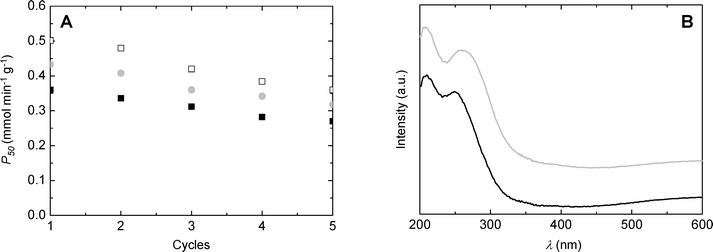
Catalyst recycling experiments were performed in order to evaluate the stability of catalysts during exploitation. SiO2/TiO2-A, -B and -C synthesized with ϕCHI = 0.33 and Si/Ti = 19 were reused five times in the MPS oxidation reaction at 333 K, in acetonitrile, for 50 min. The catalyst was separated by filtration after each reaction, washed with acetonitrile, and then placed into a fresh reagent mixture. As can be deduced from Fig. 10A, the productivities after 50 minutes of reaction stay high for the first five runs, showing only slight deactivation. Deactivation affects all samples in a similar manner, suggesting that the deactivation mechanism is probably similar. After five catalytic cycles, SiO2/TiO2-C exhibited comparable productivity to the SiO2/TiO2-A sample during the first run (i.e. 0.36 mmol min−1 g−1). Diffuse reflectance UV-vis spectra recorded before and after the catalytic tests for the SiO2/TiO2-A material (Fig. 10B) showed a slight shift towards higher wavelengths of the low-energy band, which indicates a change in the Ti coordination environment. In agreement with that, we noticed a drop in the TiTd/TiOh ratio estimated from XPS from about 11 to 4 after the catalytic tests (the XPS Si/Ti molar ratio remained in the 32–34 range).Comparison with the literature
The catalytic performance of these materials was further compared to those previously reported for the oxidation of MPS under the same conditions. A Ti-MCM-41 catalyst (SBET = 795 m2 g−1, Si/Ti = 112) gave a conversion of 36% after 60 min of reaction which corresponds to a productivity of 0.18 mmol min−1 g−1 at that reaction time.54 A SiO2–TiO2 obtained via non-hydrolytic sol–gel techniques (SBET = 1215 m2 g−1, Si/Ti = 22) yielded full conversion after 45 min and has a productivity of 0.67 mmol min−1 g−1 at full conversion for the MPS oxidation.43 For our materials, the highest productivity at full conversion (attained after only 30 min) reaches 1 mmol min−1 g−1 for the sample at ϕPOR = 0.49 (SBET = 590 m2 g−1, Si/Ti = 19), which is three times higher than that for the abovementioned catalysts when normalized by surface area. This finding underlines the efficiency of these materials for mild sulfoxidation, which should be ascribed to enhanced diffusivity in the system of interconnected mesopores and to a very good distribution of the Ti sites within the material.3. Experimental
3.1 Syntheses
![[thin space (1/6-em)]](https://www.rsc.org/images/entities/char_2009.gif) :
:![[thin space (1/6-em)]](https://www.rsc.org/images/entities/char_2009.gif) 2H2O
2H2O![[thin space (1/6-em)]](https://www.rsc.org/images/entities/char_2009.gif) :
:![[thin space (1/6-em)]](https://www.rsc.org/images/entities/char_2009.gif) 2EtOH. The resulting siloxane oligomers are small colloids with an average hydrodynamic diameter of Dh = 2.9 ± 0.2 nm determined by DLS.
2EtOH. The resulting siloxane oligomers are small colloids with an average hydrodynamic diameter of Dh = 2.9 ± 0.2 nm determined by DLS.
SiO2/TiO2-A. For a typical procedure, in order to obtain a material with ϕCHI = 0.65 and 5 mol% Ti, the siloxane suspension (3 g, nSi = 8.88 mmol) was placed in a round-bottomed flask (1 l) and stirred. Ti(OiPr)2(acac)2 (0.228 g, nTi = 0.469 mmol) was added dropwise at RT. The yellow mixture was stirred for an additional 5 min and the chitin suspension (22.5 ml) was added dropwise forming a yellow/orange precipitate. The precipitate was dissolved by adding immediately 400 mL of absolute ethanol and stirring. The solvent mixture is evaporated under standard rotary evaporation conditions until the solution transforms into a paste. The same initial amount of ethanol is then added and the mixture is again evaporated. These solvent-exchange cycles are repeated three times to ensure complete removal of water. After the last ethanol removal, the resulting paste was dissolved in ethanol in order to achieve a chitin concentration of 3 × 10⁻³ g mL−1.
SiO2/TiO2-B. Amounts of precursor materials were the same as above. The siloxane suspension was mixed to Ti(OiPr)2(acac)2 under stirring followed by the addition of a chitin suspension in ethanol. Evaporation cycles for solvent exchange were not necessary in this case.
SiO2/TiO2-C. Amounts of precursor materials were the same as above. A chitin suspension in EtOH was first mixed with Ti(OiPr)2(acac)2 for 10 min under stirring, followed by the addition of the siloxane suspension. Evaporation cycles for solvent exchange were not necessary in this case.
The obtained solutions were subsequently spray-dried using a Büchi 290 mini-spray dryer under dry nitrogen at 393 K. Mesoporous samples were obtained by calcination in air (8 h, 823 K). After calcination, the siloxane condensation degree may slightly increase (from about 0.88 to 0.91 as determined by 29Si solid-state NMR on some samples). The molar ratios of Si/Ti determined by elemental analyses on different calcined and non-calcined samples coincide with the initial ratio inside the sols as expected.
3.2 Characterization techniques
Elemental analyses were done at the CNRS facility “Service Central d'Analyse” (Vernaison, France).Nitrogen sorption isotherms were recorded using a Micromeritics Tristar apparatus at 77 K. Calcined samples were outgassed at 523 K at 3 × 10⁻³ torr for at least 8 h. The pore volume fractions ϕPOR were estimated using the maximum adsorbed volume of nitrogen sorption isotherms considering a density of 2.2 g cm−1 for silica. Specific surface areas (SBET) were calculated using the BET method.60 Average pore diameters were inferred from the nitrogen desorption branch according to Broekhoff and de Boer (BdB).61
Transmission electron microscopy (TEM) analyses were made using a JEOL 1200 EX2 microscope operating at 100 kV. Calcined samples were grounded and embedded in a resin and cut into slices (~70 nm thick) with an ultramicrotome.
Scanning electron microscopy (SEM) images were recorded using a Hitachi S-4500 I SEM.
Diffuse reflectance UV-vis (DR UV-vis) spectra were recorded under ambient conditions on a Perkin Elmer Lambda 14 spectrometer equipped with a BaSO4-coated integration sphere. Samples were diluted in BaSO4; spectra were plotted using the Kubelka–Munk function.
X-ray photoelectron spectroscopy (XPS) measurements were carried out using an ESCALAB Mk II (VG Scientific Ltd.) electron spectrometer (base vacuum of 10−8 Pa). XPS spectra were recorded using a Mg Kα excitation source with a photon energy of 1253.6 eV. The instrumental resolution was 1.06 eV (from the FWHM of Ag3d5/2 photoelectron line). Energy calibration was performed using the C 1s line of adsorbed hydrocarbons (285 eV). The relative concentrations of the different chemical species were determined by normalization of the areas of the XPS peaks by their photoionization cross sections calculated by Scofield.62
Microparticle grain size was measured by light scattering using a MALVERN Mastersizer 2000 in water dispersions.
3.3 Catalytic studies
The catalytic experiments were carried out at atmospheric pressure, at 333 K, in a three-necked glass batch reactor (50 ml) equipped with a magnetic stirrer, a thermometer and a condenser and placed in a thermostated bath. The solid catalyst was suspended under vigorous stirring (1000 rpm) in a mixture containing the organic substrate (1.5 mmol), hydrogen peroxide (50 wt% aqueous solution, 3 mmol for MPS and 7.5 mmol for DBT) and acetonitrile (15 mL) as solvent. Blank experiments were carried out in the absence of a catalyst. Samples of the reaction mixture were withdrawn periodically and analyzed using a Varian 3900 chromatograph equipped with a capillary column (DB-1, 60 m, 0.20 mm i.d., 0.25 μm film thickness) and FID.3.4 Methods
 | (1) |
The volume occupied by each component in the final material after drying is obtained by dividing the mass of this component by its estimated density within the solid (i.e. ρChitin = 1.43, ρSiO2 = 1.9, ρTiO2 = 4).
The pore volume fraction (ϕPOR) is deduced from the plateau of sorption after capillary condensation in nitrogen sorption isotherms and is calculated as:
 | (2) |
| C = a·t | (3) |
From this relation, the initial velocity (υint) is calculated by:
 | (4) |
Productivity (Pt) is calculated for a certain time (t) of the reaction as:
 | (5) |
4. Conclusion
In summary, we have obtained mesoporous silica–titania catalysts synthesized by combining the sol–gel process with the self-assembly properties of α-chitin nanorods acting as green templates. Spray-drying allowed for the achievement of catalysts as individual microparticles. The three synthesis methods presented here led to the conclusion that materials synthesized employing an initial ethanolic chitin suspension present the advantage of an easy and fast synthesis protocol leading to materials with increased textural properties and higher catalytic activity. Moreover, by mixing the α-chitin nanorods first with the titanium complex prior to combination with the siloxane oligomers, the quantity of active titania sites on the surface can be maximized, leading to materials with very high productivities in sulfoxidation reactions. This important result can be explained by the complexing ability of the chitin surface towards the titanium monomeric precursor. Hence, we are currently investigating the interactions of metal complexes and chitin nanorods in order to conceive other materials with optimized properties. We are certain that the chitin biotemplating strategy described here represents a valuable tool for directing active sites on the surface of mixed oxides, in addition to the modulation of the textural properties coming from the hard templating approach.Acknowledgements
ANR French Agency is acknowledged for the specific funding through the HYSIKIT project. Campus France is acknowledged for its support through the PHC program Rila. Thomas Cacciaguerra is thanked for his help with electron microscopy.Notes and references
- A. Sachse, V. Hulea, K. L. Kostov, N. Marcotte, M. Yu Boltoeva, E. Belamie and B. Alonso, Chem. Commun., 2012, 48, 10648–10650 RSC.
- K. Kaczorowska, Z. Kolarska, K. Mitka and P. Kowalski, Tetrahedron, 2005, 61, 8315–8327 CrossRef CAS PubMed.
- E. Ito and J. A. R. Van Veen, Catal. Today, 2006, 116, 446–460 CrossRef CAS PubMed.
- V. Hulea, F. Fajula and J. Bousquet, J. Catal., 2001, 198, 179–186 CrossRef CAS.
- H. Lü, J. Gao, Z. Jiang, Y. Yang, B. Song and C. Li, Chem. Commun., 2007, 150–152 Search PubMed.
- I. Fernandez and N. Khiar, Chem. Rev., 2003, 103, 3651–3705 CrossRef CAS PubMed.
- D. R. C. Huybrechts, L. De Bruycher and P. A. Jacobs, Nature, 1990, 345, 240–242 CrossRef CAS.
- G. Bellussi, A. Carati, M. G. Clerici, G. Meddinelli and R. Millini, J. Catal., 1992, 133, 220–230 CrossRef CAS.
- S. Gontier and A. Tuel, Appl. Catal., A, 1994, 118, 173–186 CrossRef CAS.
- M. G Clerici and M. E. Domine, in Liquid Phase Oxidation via Heterogeneous Catalysis: Organic Synthesis and Industrial Applications, ed. M. C. Clerici and O. A. Kholdeeva, Wiley, Weinheim, 2013, pp. 21–93 Search PubMed.
- O. A. Kholdeeva, in Liquid Phase Oxidation via Heterogeneous Catalysis: Organic Synthesis and Industrial Applications, ed. M. C. Clerici and O. A. Kholdeeva, Wiley, Weinheim, 2013, pp. 127–220 Search PubMed.
- T. Blasco, A. Corma, M. T. Navarro and J. Pérez Pariente, J. Catal., 1995, 156, 65–74 CrossRef CAS.
- A. Corma, M. Domine, J. A. Gaona, J. L. Jordá, M. T. Navarro, F. Rey, J. Pérez-Pariente, J. Tsuji, B. McCulloch and L. T. Nemeth, Chem. Commun., 1998, 2211–2212 RSC.
- W. Zhang and T. P. Pinnavaia, Catal. Lett., 1996, 38, 261–265 CrossRef CAS.
- C. Galacho, M. M. L. Ribero Carrott and P. J. M. Carrott, Microporous Mesoporous Mater., 2007, 100, 312–321 CrossRef CAS PubMed.
- M. Guidotti, C. Pirovano, N. Ravasio, B. Lázaro, J. M. Fraile, J. A. Mayoral, B. Coq and A. Galarneau, Green Chem., 2009, 11, 1421–1427 RSC.
- N. Ravasio, F. Zaccheria, M. Guidotti and R. Psaro, Top. Catal., 2004, 27, 157–168 CrossRef CAS.
- R. Huttler, T. Mallat and A. Baiker, J. Catal., 1995, 153, 177–189 CrossRef.
- R. J. Davis and Z. F. Liu, Chem. Mater., 1997, 9, 2311–2324 CrossRef CAS.
- M. Andrianainarivelo, R. Corriu, D. Leclercq, P. H. Mutin and A. Vioux, J. Mater. Chem., 1996, 6, 1665–1671 RSC.
- V. Lafond, P. H. Mutin and A. Vioux, Chem. Mater., 2004, 16, 5380–5386 CrossRef CAS.
- J. H. Clark, Green Chem., 1999, 1, 1–8 RSC.
- M. Eissen, J. O. Mertzger, E. Schmidt and U. Schneidewind, Angew. Chem., Int. Ed., 2002, 41, 414–436 CrossRef CAS.
- N. Baccile, F. Babonneau, B. Thomas and T. Coradin, J. Mater. Chem., 2009, 19, 8537–8559 RSC.
- J. M. Campelo, D. Luna, R. Luque, J. M. Marinas and A. A. Romero, ChemSusChem, 2009, 2, 18–45 CrossRef CAS PubMed.
- R. Chal, C. Gerardin, M. Bulut and S. van Donk, ChemCatChem, 2011, 3, 67–81 CrossRef CAS PubMed.
- C. Gerardin, J. Reboul, M. Bonne and B. Lebeau, Chem. Soc. Rev., 2013, 42, 4217–4255 RSC.
- S. Mann, Nature, 1993, 365, 499–505 CrossRef CAS.
- H. Yang, N. Coombs and G. A. Ozin, Nature, 1997, 386, 692–695 CrossRef CAS.
- S. Mann, in Biomineralization. Principles and Concepts in Bioinorganic Materials Chemistry, Oxford University Press, Oxford, 2001 Search PubMed.
- C. Sanchez, H. Arribart and M. M. G. Guille, Nat. Mater., 2005, 4, 277–288 CrossRef CAS.
- E. Ruiz-Hitzky, M. Darder, P. Aranda and K. Ariga, Adv. Mater., 2010, 22, 323–336 CrossRef CAS PubMed.
- H. Ehrlich, Int. Geol. Rev., 2010, 52, 661–699 CrossRef.
- N. Lin, J. Huang and A. Dufresne, Nanoscale, 2012, 4, 3274–3294 RSC.
- A. El Kadib, M. Bousmina and D. Brunel, J. Nanosci. Nanotechnol., 2014, 14, 308–331 CrossRef CAS PubMed.
- E. Dujardin, M. Blaseby and S. Mann, J. Mater. Chem., 2003, 13, 696–699 RSC.
- B. Alonso and E. Belamie, Angew. Chem., Int. Ed., 2010, 49, 8201–8204 CrossRef CAS PubMed.
- E. Belamie, M. Y. Boltoeva, K. Yang, T. Cacciaguerra and B. Alonso, J. Mater. Chem., 2011, 21, 16997–17006 RSC.
- C. Schütz, J. Sort, Z. Bacsik, V. Oliynyk, E. Pellicer, A. Fall, L. Wågberg, L. Berglund, L. Bergström and G. Salazar-Alvarez, PLoS One, 2012, 7, e45828 Search PubMed.
- N. Thanh-Dinh, K. E. Shopsowitz and J. M. MacLachlan, Chem. – Eur. J., 2013, 19, 15148–15154 CrossRef PubMed.
- N. Thanh-Dinh, K. E. Shopsowitz and J. M. MacLachlan, J. Mater. Chem. A, 2014, 2, 5915–5921 Search PubMed.
- A. Ivanova, D. Fattakhova-Rohlfing, B. E. Kayaalp, J. Rathouský and T. Bein, J. Am. Chem. Soc., 2014, 136, 5930–5937 CrossRef CAS PubMed.
- J. F. Revol and R. H. Marchessault, Int. J. Biol. Macromol., 1993, 15, 329–335 CrossRef CAS.
- E. Belamie, P. Davidson and M. M. Giraud-Guille, J. Phys. Chem. B, 2004, 108, 14991–15000 CrossRef CAS.
- K. Masters, in Spray-Drying in Practice, SprayDryConsult International ApS, Hvidovre, 2002 Search PubMed.
- C. Boissiere, D. Grosso, A. Chaumonnot, L. Nicole and C. Sanchez, Adv. Mater., 2011, 23, 599–623 CrossRef CAS PubMed.
- B. Alonso, E. Véron, D. Durand, D. Massiot and C. Clinard, Microporous Mesoporous Mater., 2007, 106, 76–94 CrossRef CAS PubMed.
- M. Fatnassi, C. Tourné-Péteilh, T. Cacciaguerra, P. Dieudonne, J.-M. Devoisselle and B. Alonso, New J. Chem., 2010, 34, 607–610 RSC.
- K. S. W. Sing, IUPAC Technical Reports and Recommendations, 1985, vol. 57, pp. 603–619 Search PubMed.
- J. C. Groen, L. A. A. Peffer and J. Perez-Ramirez, Microporous Mesoporous Mater., 2003, 60, 1–17 CrossRef CAS.
- J. Iapichella, J.-M. Meneses, I. Beurroies, R. Denoyel, Z. Bayram-Hahn, K. Unger and A. Galarneau, Microporous Mesoporous Mater., 2007, 102, 111–121 CrossRef CAS PubMed.
- A. El Kadib, K. Molvinger, T. Cacciaguerra, M. Bousmina and D. Brunel, Microporous Mesoporous Mater., 2011, 142, 301–307 CrossRef CAS PubMed.
- M. Boltoeva, I. Dozov, P. Davidson, K. Antonova, L. Cardoso, B. Alonso and E. Belamie, Langmuir, 2013, 29, 8208–8212 CrossRef CAS PubMed.
- V. Hulea, P. Moreau and F. Di Renzo, J. Mol. Catal., 1996, 111, 325–332 CrossRef CAS.
- V. Hulea, A. L. Maciuca, F. Fajula and E. Dumitriu, Appl. Catal., A, 2006, 313, 200–207 CrossRef CAS PubMed.
- A. M. Cojocariu, P. H. Mutin, E. Dumitriu, F. Fajula, A. Vioux and V. Hulea, Chem. Commun., 2008, 5357–5359 RSC.
- Y. Jia, G. Li and G. Ning, Fuel Process. Technol., 2011, 92, 106–111 CrossRef CAS PubMed.
- France Chitine, http://www.france-chitine.com (accessed July 2014).
- Verified Synthesis of Zeolitic Materials, ed. H. Robson, Elsevier, Amsterdam, 2nd edn, 2001, p. 207 Search PubMed.
- S. Brunauer, P. H. Emmett and E. Teller, J. Am. Chem. Soc., 1938, 60, 309–319 CrossRef CAS.
- C. P. Broekhoff and J. H. De Boer, J. Catal., 1968, 10, 377–390 CrossRef.
- J. H. Scofield, J. Electron Spectrosc. Relat. Phenom., 1976, 8, 129–137 CrossRef CAS.
| This journal is © The Royal Society of Chemistry 2015 |


