 Open Access Article
Creative Commons Attribution 3.0 Unported Licence
A composite photocatalyst of an organic electron donor–acceptor dyad and a Pt catalyst supported on semiconductor nanosheets for efficient hydrogen evolution from oxalic acid†
Yusuke
Yamada
,
Akifumi
Nomura
,
Hideyuki
Tadokoro
and
Shunichi
Fukuzumi
*
Department of Material and Life Science, Graduate School of Engineering, Osaka University, ALCA, Japan Science and Technology Agency (JST), Suita, Osaka 565-0871, Japan. E-mail: fukuzumi@chem.eng.osaka-u.ac.jp
First published on 28th August 2014
Abstract
A composite photocatalytic system for hydrogen evolution employing acidic oxalic acid as an electron donor has been successfully constructed by combining 2-phenyl-4-(1-naphthyl)quinolinium ion (QuPh+–NA), platinum (Pt) and nanosheets prepared by the exfoliation of K4Nb6O17 (niobate-NS) as an organic photosensitiser, a hydrogen-evolution catalyst and a semiconductor photocatalyst for the oxidation of oxalic acid, respectively. The composite photocatalyst, QuPh+–NA/niobate-NS (Pt), was prepared by a two-step route to locate a Pt catalyst near QuPh+–NA on the surface of niobate-NS: (i) supporting QuPh+–NA on niobate-NS by a cation exchange method and then (ii) supporting Pt on the QuPh+–NA/niobate-NS by a photodeposition method using PtCl42− as a precursor, which interacts repulsively with the negatively charged surface of niobate-NS. The precursor of PtCl42− was reduced to metallic Pt by the photocatalysis of QuPh+–NA in the presence of oxalate. Photocatalytic hydrogen evolution with the composite catalyst proceeds via photoexcitation of both niobate-NS and QuPh+–NA to produce an electron and a hole in the semiconductor and the ET state (QuPh˙–NA˙+), respectively. The photogenerated hole of niobate-NS oxidises oxalic acid to produce CO2 and CO2˙– with two protons, whereas the photogenerated electron and CO2˙– reduce QuPh+–NA and the electron-transfer (ET) state to produce two equivalents of QuPh˙–NA, which inject electrons to the Pt catalyst to reduce protons to hydrogen. The utilisation of oxalic acid as an electron donor even under highly acidic conditions, which are thermodynamically favourable for proton reduction to evolve hydrogen but unfavourable for oxalate oxidation, has been made possible for the first time by combining QuPh+–NA, Pt and niobate-NS. Composite photocatalysts were also prepared by employing mesoporous silica-alumina and nanosheets prepared by the exfoliation of KTiNbO5 (titanoniobate-NS), which possesses a band structure different from niobate-NS, as supports to clarify the requirements for a building block to achieve an active composite photocatalyst.
Introduction
Hydrogen (H2) has been regarded as a potential next generation fuel because it has a high energy density per weight and there is no emission of harmful gases after use.1 At present, H2 supplied to industries is mainly produced by the steam reforming reaction of hydrocarbons, mostly natural gas, indicating that H2 is not really a clean and recyclable fuel.2 To really be a clean and recyclable fuel, H2 should be produced from recyclable resources by utilising natural energy, such as solar energy.3–8 In this context, photocatalytic water splitting to produce H2 and O2 from water by UV light irradiation has been extensively studied by using metal-oxide semiconductors such as TiO2 supporting Pt, Ru or Ni.9–24 The band gaps of metal-oxide semiconductors have been tuned by nitrogen or sulphur doping to improve the photoresponse to visible light for water splitting.25,26In natural photosynthesis, two photosystems (I and II) are combined to achieve both the oxidation of water and the reduction of nicotinamide adenine dinucleotide (NAD+) via the so called Z-scheme, to enable the utilisation of all visible light.27 Such a Z-scheme system has been utilised to improve the photocatalysis of metal-oxide semiconductors by combining two narrow band-gap semiconductors, which are active for water oxidation and reduction under visible light irradiation, with an electron mediator, enabling the utilisation of visible light for water splitting.28–32 Supporting various types of photosensitisers on semiconductors has also been widely examined to utilise visible light for water splitting.33–40
Compared to semiconductors, energy gaps are much easier to fine tune for organic electron donor–acceptor linked molecules, which can mimic photoinduced charge separation in the photosynthetic reaction centre.41–44 Such photosynthetic reaction centre models with long lifetimes of charge-separated states have been utilised as photocatalysts together with water reduction catalysts for H2 evolution, which requires relatively strong electron donors such as NADH because of the absence of efficient oxidation catalysts.45–49 Some metal-oxide semiconductors are known to act as efficient oxidation catalysts.9–24 Thus, the combination of photosynthetic reaction centre models and semiconductors with water reduction catalysts will enable the development of efficient photocatalytic systems for H2 evolution, which is not possible by either of these catalytic systems alone. However, such composites of photosynthetic reaction centre models for charge separation and inorganic semiconductors have yet to be reported.
We report herein a photocatalytic H2-evolution system using a composite photocatalyst of an organic electron donor–acceptor linked dyad, 2-phenyl-4-(1-naphthyl)quinolinium ion (QuPh+–NA), which has a long electron-transfer (ET) state lifetime upon photoexcitation, and a Pt catalyst supported on semiconductor nanosheets derived from K4Nb6O17 (niobate-NS) in the presence of acidic oxalic acid as an electron donor. K4Nb6O17 supporting Pt or Ni has been reported to act as a photocatalyst for water splitting using a high pressure mercury lamp.23,24 However, niobate-NS, which possesses a high surface area suitable for supporting cationic species, exhibits no such activity.37 Oxalic acid is a naturally abundant organic compound, which has hardly been used as an electron donor for photocatalytic hydrogen evolution.48–51 The composite catalyst has enabled to use oxalic acid as an electron donor for photocatalytic H2 evolution by the Z-scheme system (vide supra), in which oxalic acid is oxidised by the holes of semiconductor nanosheets produced upon photoexcitation, whereas water is reduced by the photocatalysis of QuPh+–NA with a Pt catalyst. The Pt catalyst was deposited in the close vicinity of QuPh+–NA by the in situ reduction of anionic PtCl42−, which repulsively interacts with anionic surfaces of the semiconductor nanosheets. The close location of the QuPh+–NA and the Pt catalyst promotes forward electron transfer from the photoexcited QuPh+–NA to the Pt catalyst. Additionally, niobate-NS of the composite catalyst was replaced with titanoniobate nanosheets prepared by the exfoliation of KTiNbO5 (titanoniobate-NS) or mesoporous silica-alumina (sAlMCM-41). sAlMCM-41 is photocatalytically inactive, but is a cation exchangeable material. K4Nb6O17 and KTiNbO5 are semiconductors which possess cation exchangeable surfaces and strong oxidising abilities under UVA light irradiation.22–24 Comparison of the composite catalysts in terms of photocatalysis for H2 evolution and oxalic acid oxidation, and the lifetime of photogenerated QuPh˙–NA˙+ on each support, clarified the requirements to achieve an active composite catalyst for photocatalytic H2 evolution. Although the present composite photocatalytic system is still incapable of using water as a reductant for H2 evolution because of the absence of a water oxidation catalyst, the combination of an organic photosynthetic reaction centre model compound with semiconductor nanosheets and a water reduction catalyst, reported for the first time in this study, provides a promising perspective for further development of efficient water splitting photocatalytic systems, which may not be achieved by inorganic semiconductors alone without organic charge-separation components.
2. Result and discussion
2.1. Adsorption of QuPh+–NA on metal-oxide nanosheets
Metal-oxide semiconductor nanosheets used as the oxidation catalyst of the composite catalyst were prepared by exfoliation of K4Nb6O17 and KTiNbO5 (niobate-NS and titanoniobate-NS) as reported in the literature,52–54 and characterised by powder X-ray diffraction, N2 adsorption–desorption isotherms and thermogravimetry/differential thermal analysis (TG/DTA) as shown in Fig. S1–S4 in the ESI.† The morphologies of niobate-NS and titanoniobate-NS were confirmed by TEM observations. Fig. 1a and b display TEM images of as-prepared K4Nb6O17 and niobate-NS, respectively. The size of as-prepared K4Nb6O17 was more than 1 μm and no mesopores were observed. On the other hand, major portions of niobate-NS formed nanoscrolls as observed in previous reports.39 The size of the nanoscrolls was about 500–1000 nm × 10–20 nm in length and diameter as shown in Fig. 1b. A similar scroll morphology was observed for titanoniobate-NS as shown in Fig. 1c, although some particles have a sheet morphology as shown in Fig. 1d.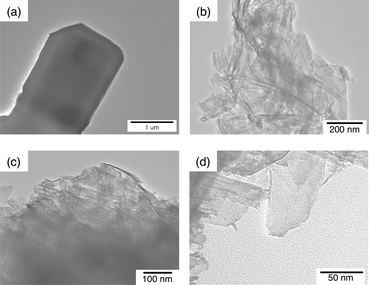 | ||
| Fig. 1 TEM images of (a) as-prepared K4Nb6O17, (b) exfoliated K4Nb6O17 (niobate-NS) and (c, d) exfoliated KTiNbO5 with scroll and sheet morphologies (titanoniobate-NS). | ||
An organic electron donor–acceptor linked dyad of 2-phenyl-4-(1-naphthyl)quinolinium ion (QuPh+–NA) was supported on niobate-NS by a cation-exchange method in a mixed solution of MeCN and water [1![[thin space (1/6-em)]](https://www.rsc.org/images/entities/char_2009.gif) :
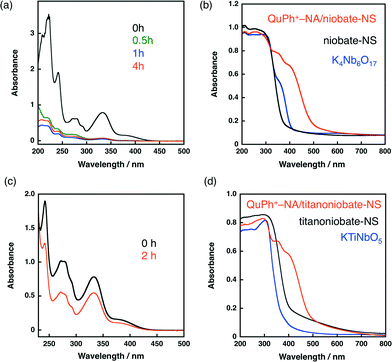
:![[thin space (1/6-em)]](https://www.rsc.org/images/entities/char_2009.gif) 1 (v/v)] at room temperature for 4 h. When the as-prepared K4Nb6O17 was used as a support instead of niobate-NS, only a little amount of QuPh+–NA was adsorbed because of the small Brunauer–Emmett–Teller (BET) surface area (<5 m2 g−1). The loading amount of QuPh+–NA on niobate-NS was determined to be 1.4 × 10⁻⁴ mol g−1 (4.9 wt%) by the UV-vis absorbance change of the supernatant at 334 nm, characteristic of QuPh+–NA, as shown in Fig. 2a.49,50 No significant difference was observed between niobate-NS and QuPh+–NA/niobate-NS in terms of the N2 adsorption–desorption isotherms and powder X-ray diffraction patterns (Fig. S5 in the ESI†). The amount of supported QuPh+–NA estimated from the weight loss observed in TG analysis was 1.4 × 10⁻⁴ mol g−1 (Fig. S6a in the ESI†), which agrees with the value estimated from the UV-vis spectral change. The adsorbed QuPh+–NA on the surface of niobate-NS was detected by diffuse reflectance UV-vis spectroscopy (DRS) by an increasing absorption at around 400 nm as shown in Fig. 2b. Similarly, the amount of QuPh+–NA supported on titanoniobate-NS by the same method was determined to be 5.1 × 10⁻⁵ mol g−1 (1.8 wt%, Fig. S6b in the ESI†). The adsorption of QuPh+–NA was confirmed by DRS, in which strong absorption bands appeared at wavelengths longer than 400 nm, (Fig. 2d) and IR absorption spectroscopy (Fig. S7 in the ESI†).
1 (v/v)] at room temperature for 4 h. When the as-prepared K4Nb6O17 was used as a support instead of niobate-NS, only a little amount of QuPh+–NA was adsorbed because of the small Brunauer–Emmett–Teller (BET) surface area (<5 m2 g−1). The loading amount of QuPh+–NA on niobate-NS was determined to be 1.4 × 10⁻⁴ mol g−1 (4.9 wt%) by the UV-vis absorbance change of the supernatant at 334 nm, characteristic of QuPh+–NA, as shown in Fig. 2a.49,50 No significant difference was observed between niobate-NS and QuPh+–NA/niobate-NS in terms of the N2 adsorption–desorption isotherms and powder X-ray diffraction patterns (Fig. S5 in the ESI†). The amount of supported QuPh+–NA estimated from the weight loss observed in TG analysis was 1.4 × 10⁻⁴ mol g−1 (Fig. S6a in the ESI†), which agrees with the value estimated from the UV-vis spectral change. The adsorbed QuPh+–NA on the surface of niobate-NS was detected by diffuse reflectance UV-vis spectroscopy (DRS) by an increasing absorption at around 400 nm as shown in Fig. 2b. Similarly, the amount of QuPh+–NA supported on titanoniobate-NS by the same method was determined to be 5.1 × 10⁻⁵ mol g−1 (1.8 wt%, Fig. S6b in the ESI†). The adsorption of QuPh+–NA was confirmed by DRS, in which strong absorption bands appeared at wavelengths longer than 400 nm, (Fig. 2d) and IR absorption spectroscopy (Fig. S7 in the ESI†).
2.2. Preparation of photocatalysts composed of QuPh+–NA/niobate-NS with negatively and positively charged Pt precursors and photocatalysis for H2 evolution
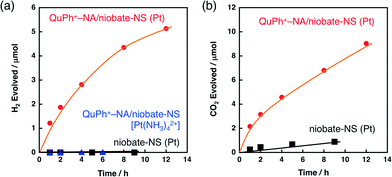
A composite photocatalyst of QuPh+–NA/niobate-NS supporting a Pt catalyst for H2 evolution [QuPh+–NA/niobate-NS (Pt)] was prepared in situ by photoirradiation of an aqueous suspension containing QuPh+–NA/niobate-NS and K2PtCl4 in the presence of oxalic acid. The concentration of K2PtCl4 (10 μM) was much smaller than QuPh+–NA (0.22 mM) based on the optimisation of the concentration of K2PtCl4 in the solution (Fig. 5, vide infra). Under photoirradiation, the photogenerated electron-transfer (ET) state of QuPh+–NA (QuPh˙–NA˙+) reduces K2PtCl4 to deposit the metallic Pt catalyst on the surface of niobate-NS. Negatively charged PtCl42− was selected as a precursor to prevent the deposition of Pt2+ cations on niobate-NS by cation exchange. A certain amount of H2 evolution was observed for the suspension containing QuPh+–NA/niobate-NS and K2PtCl4 under photoirradiation (Fig. 3a, red circle). The turnover number of Pt for H2 evolution was 250 with a turnover frequency of 21 h−1 for 12 h. On the other hand, no significant amount of H2 evolution was observed when niobate-NS without QuPh+–NA was used instead of QuPh+–NA/niobate-NS (Fig. 3a, black square). Thus, QuPh+–NA is necessary for photocatalytic H2 evolution. Similarly, no H2 evolution was observed by employing cationic Pt(NH3)42+ (Fig. 3a, blue triangle), which is often used to prepare platinised K4Nb6O17,24,34 as a precursor instead of K2PtCl4. In this case, Pt(NH3)42+ was adsorbed on the cation exchange sites of niobate-NS, to which QuPh+–NA is not closely located.For QuPh+–NA/niobate-NS (Pt), CO2 evolution accompanied by H2 evolution with nearly two times the volume of H2 was observed (Fig. 3b, red circle), indicating that oxalic acid acted as the electron donor. The ratio of CO2/H2 ranging from 1.5 to 2.0, slightly smaller than stoichiometric value (2.0), may result from a small portion of CO2 dissolved in water. Dependence of the catalytic activity of the composite on the Pt precursors indicates that not only the preparation procedures but also the choice of a precursor is important to obtain an active composite photocatalyst for H2 evolution.
The scroll morphology of niobate-NS was maintained after formation of QuPh+–NA/niobate-NS (Pt) as confirmed by TEM observations (Fig. 4a). The Pt nanoparticles were too small to be detected by TEM for QuPh+–NA/niobate-NS (Pt) after the reaction of 6 h. However, the TEM images of QuPh+–NA/niobate-NS (Pt) after the reaction of 19 h show formation of Pt particles smaller than 5 nm (Fig. 4b and c). Such grown Pt particles were also observed for QuPh+–NA/niobate-NS [Pt(NH3)42+] after photoirradiation (Fig. S8 in the ESI†). The highly dispersed small Pt nanoparticles exhibited high catalytic activity for H2 evolution. The DRS of the reaction suspension indicates that nearly half of the QuPh+–NA supported on niobate-NS lost its colour during the reaction of 12 h (Fig. S9 in the ESI†). Thus, the catalytic activity was lost as QuPh+–NA was reduced and the size of Pt nanoparticles increased.
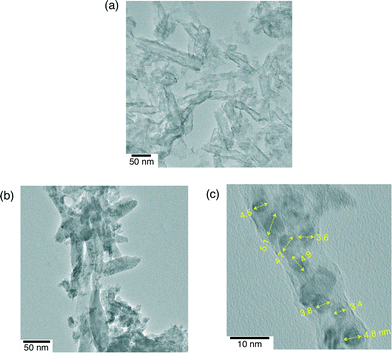 | ||
| Fig. 4 TEM images of QuPh+–NA/niobate-NS (Pt) after the photocatalytic reactions of (a) 6 h and (b, c) 19 h. The numbers indicate the sizes of each of the Pt nanoparticles in nm. | ||
2.3. Optimisation of reaction conditions for photocatalytic H2 evolution using QuPh+–NA/niobate-NS (Pt)
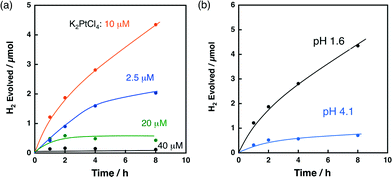
The effect of the K2PtCl4 concentration on H2 evolution was investigated for the reaction solution containing K2PtCl4, QuPh+–NA/niobate-NS and oxalic acid. Fig. 5a shows the time courses of H2 evolution during photoirradiation of an aqueous suspension containing oxalic acid (50 mM), QuPh+–NA/niobate-NS (10.5 mg) and K2PtCl4 at various concentrations (2.5–40 μM) at pH 1.6. The initial H2 evolution rate (1 h) of 0.42 μmol h−1 for the composite photocatalyst prepared in the presence of 2.5 μM K2PtCl4 was increased to 1.2 μmol h−1 by increasing the K2PtCl4 concentration to 10 μM. If all K2PtCl4 are reduced to metallic Pt and deposited on QuPh+–NA/niobate-NS, the weight concentration of Pt is 0.37 wt% in the composite photocatalyst derived from 10 μM K2PtCl4. When the K2PtCl4 concentration was further increased to 20–40 μM, however, the amount of H2 evolution significantly decreased (0.49 μmol with 20 μM and 0.14 μmol with 40 μM). Such a decrease in the amount of H2 evolution may result from the increase in the size of the Pt catalyst with the larger concentration of K2PtCl4 (20–40 μM) during the photocatalytic reaction. Thus, the optimum K2PtCl4 concentration may be about 10 μM.Then, the effect of the pH of the reaction solutions on the H2 evolution was investigated, because the form of the oxalic acid in solution changes from the acid to the monoanion and the dianion depending on the pH of the reaction solution. The pKa1 and pKa2 values of oxalic acid (1.3 and 4.2, respectively)55 suggest that the oxalate dianion becomes the major species in the solution of pH > 4.2. On the other hand, higher pH is thermodynamically unfavourable for proton reduction. Thus, if the oxidation of oxalic acid is a rate-determining step, the reaction rate would become maximum around pH 4.2. If the proton reduction is the rate-determining step, the reaction would become faster at a much lower pH. Fig. 5b compares the time courses of H2 evolution from the reaction solutions containing 10 μM K2PtCl4 at pH 1.6 and 4.1 during photocatalytic H2 evolution. The initial H2 evolution rate (1 h) decreased from 1.2 μmol h−1 at pH 1.6 to 0.32 μmol h−1 at pH 4.1. Therefore, proton reduction rather than oxalate oxidation is the rate-determining step for H2 evolution in this photocatalytic system.
The effect of irradiance was also examined by using a solar simulator (AM 1.5G). The light source contains both UVA (350 nm < λ < 400 nm) and visible light (λ > 400 nm). Photocatalytic H2 evolution was performed by photoirradiation of an aqueous suspension (2.0 mL) in a square quartz cuvette (light path length: 10 mm) containing QuPh+–NA/niobate-NS (10.5 mg), K2PtCl4 (10 μM) and oxalic acid (10 mM), changing the irradiance from 0.1 kW m2 (0.1 sun) to 1 kW m2 (1 sun). The H2 evolution during the photocatalytic reaction was accelerated by increasing the irradiance up to 0.5 kW m2 (0.5 sun), however, further increase of the irradiance resulted in no further increase in the H2 evolution rate (Fig. S10 in the ESI†).
2.4. Composite photocatalysts using sAlMCM-41 and titanoniobate-NS as supports
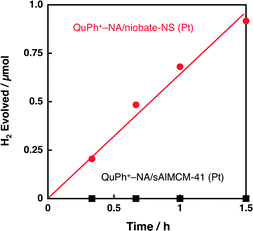
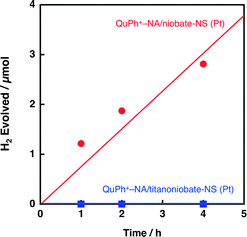
The activity of composite photocatalysts for photocatalytic H2 evolution is expected to depend on the supporting materials. Silica-alumina (sAlMCM-41) is a cation exchangeable but insulating material. First, photocatalytic H2 evolution was performed under photoirradiation of a highly acidic aqueous suspension (2.0 mL, pH 0.9) containing oxalic acid (50 mM), K2PtCl4 (10 μM) and QuPh+–NA/sAlMCM-41 (11.6 mg, [QuPh+–NA]: 0.22 mM). As indicated in Fig. 6 (black square), no H2 evolution was observed for QuPh+–NA/sAl-MCM-41 (Pt). Thus, the use of photocatalytically active niobate-NS has made it possible to evolve H2 under these conditions by utilising its oxidising ability, which is strong enough to oxidise acidic oxalic acid.Then, the activity of a composite photocatalyst using titanoniobate-NS instead of niobate-NS was examined, as shown in Fig. 7, where no H2 evolution was observed under photoirradiation for 5 h (blue square), in contrast to the case of niobate-NS (red circle). The reason for the drastic difference in the photocatalytic activity between titanoniobate-NS and niobate-NS is investigated in the following sections.
2.5. Photocatalytic oxidation of oxalic acid with metal-oxide nanosheets
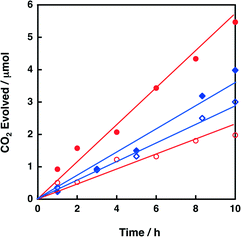
First, photocatalysis of niobate-NS and titanoniobate-NS for oxalic acid oxidation was confirmed by CO2 evolution from an O2-saturated aqueous solution (pH 1.6) containing oxalic acid, under photoirradiation (λ > 340 nm). Fig. 8 shows the time courses of CO2 evolution during photoirradiation (λ > 340 nm) of an O2-saturated aqueous suspension containing oxalic acid and K4Nb6O17 or KTiNbO5. The amount of evolved CO2 increased linearly with the photoirradiation time for all the catalysts. The CO2 evolution rate of 0.20 μmol h−1 for K4Nb6O17 was increased to 0.55 μmmol h−1 for niobate-NS by exfoliation. The catalytic activity of niobate-NS was further enhanced by loading QuPh+–NA (Fig. S11 in the ESI†). Similarly, the CO2 evolution rate for titanoniobate-NS (0.35 μmol h−1) was larger than that for KTiNbO5 (0.28 μmmol h−1). Thus, titanoniobate-NS can act as a photocatalyst for oxalic acid oxidation even under acidic conditions.2.6. Photoinduced electron-transfer state of QuPh+–NA (QuPh˙–NA˙+) on metal oxides detected by EPR spectroscopy
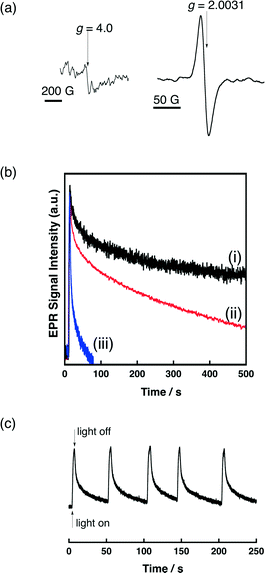
Photoirradiation of QuPh+–NA supported on metal oxides by a 1000 W high-pressure mercury lamp through a UV-light cutting filter (λ > 340 nm) results in the formation of the triplet ET state (QuPh˙–NA˙+) via photoinduced electron transfer from the naphthalene (NA) moiety to the singlet excited state of the quinolinium ion (QuPh+) moiety as evidenced by EPR measurements at −196 °C. An EPR signal at g = 2.0031 appearing under photoirradiation (Fig. 9a) demonstrates the formation of a radical species.50 The weak EPR signal appearing at g = 4.0 demonstrates triplet multiplicity.56 The decay rate of the EPR signal of QuPh˙–NA˙+ at room temperature observed after cutting off the light highly depends on the metal-oxide supports. When redox inactive sAlMCM-41 was used as a support of QuPh+–NA, the decay rate in the EPR signal intensity observed after cutting off the light in Fig. 9b (i, black line) is much slower than the decay rate with metal-oxide semiconductors, niobate-NS and titanoniobate-NS (ii, red and iii, blue, respectively). The oscillation of the EPR signal intensity during intermittent photoirradiation for 2 seconds followed by approximately 50 seconds in the dark demonstrates the photorobustness of QuPh+–NA on titanoniobate-NS in the presence of water (Fig. 9c).The shorter lifetime of the ET state of QuPh+–NA (QuPh˙–NA˙+) on the semiconductor nanosheets can be ascribed to back electron transfer facilitated by the semiconductor nanosheets, in which the QuPh˙ moiety injects an electron to the semiconductor nanosheets and the injected electron reduces the NA˙+ moiety. The much faster back electron transfer observed for QuPh+–NA/titanoniobate-NS compared with that observed for QuPh+–NA/niobate-NS can be ascribed to the difference in band structures. The band gap of KTiNbO5 (3.7 V), which is wider than K4Nb6O17 (3.5 V), suggests that the energy of the conduction band edge is slightly negative,34b because the valence band of metal-oxide semiconductors typically consists of O 2p orbitals.57 The high reducing power of electrons in the conduction band of KTiNbO5 can accelerate the back electron transfer. Another possible reason for the shorter lifetime of the ET state is the presence of adsorbed water on the surface of a metal-oxide semiconductor, because the presence of water has been reported to shorten the lifetime of QuPh˙–NA˙+ on sAlMCM-41 significantly.50 However, TG/DTA analyses of QuPh+–NA/niobate-NS and QuPh+–NA/titanoniobate-NS suggest that weight losses due to water desorption were 8.5 and 8.7% for QuPh+–NA/niobate-NS and QuPh+–NA/titanoniobate-NS, respectively (Fig. S6 in the ESI†).58 The BET surface areas of niobate-NS and titanoniobate-NS are also similar, determined to be 180 m2 g−1 and 166 m2 g−1, respectively. Thus, the effect of adsorbed water on the lifetime of the ET state of QuPh+–NA on the semiconductors is negligible in this case.
2.7. Reaction mechanisms of photocatalytic H2 evolution with QuPh+–NA/KNb6O17-NS (Pt)
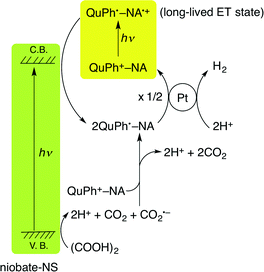
The overall photocatalytic cycle of H2 evolution from oxalic acid with QuPh+–NA/niobate-NS is depicted in Scheme 1. The photoirradiation of both K4Nb6O17 and QuPh+–NA resulted in the production of an electron and a hole in the semiconductor and the ET state of QuPh+–NA, respectively. The long-lived ET state of QuPh+–NA (QuPh˙–NA˙+) was reduced by the electron in the conduction band of niobate-NS and the resulting QuPh˙–NA injects an electron to the Pt catalyst for H2 evolution. The remaining hole on niobate-NS oxidises oxalic acid by electron transfer. The one-electron oxidised oxalic acid decomposes into CO2 and CO2˙– together with two protons. The produced CO2˙– reduces QuPh+–NA to produce QuPh˙–NA.48 When photoinactive and insulating sAlMCM-41 was used as a support, no oxidation of acidic oxalic acid occurred with QuPh˙–NA˙+, resulting in no photocatalytic H2 evolution. In the case of titanoniobate-NS used as the support, oxalic acid oxidation proceeded by photoirradiation as shown in Fig. 8. However, the lifetime of the ET state of photogenerated QuPh˙–NA˙+ on titanoniobate-NS is dramatically shortened compared with that on niobate-NS (Fig. 9b), resulting in little photocatalytic activity for H2 evolution (Fig. 7, blue square), because titanoniobate-NS may act as a better electron mediator for back electron transfer from QuPh˙ to NA˙+ than niobate-NS.3. Conclusions
A composite photocatalyst for H2 evolution was successfully prepared by rationally arranging an organic electron donor–acceptor dyad (QuPh+–NA), which forms a long-lived ET state upon photoirradiation, and a Pt catalyst (proton reduction catalyst) on appropriate metal-oxide semiconductor nanosheets (niobate-NS), which act as an efficient catalyst for the photocatalytic oxidation of oxalic acid. The attractive electrostatic interaction between a Pt catalyst precursor (PtCl42−) and QuPh+–NA on the negatively charged surface of niobate-NS resulted in the photoreduction of PtCl42− to produce the Pt catalyst, which was closely located to QuPh+–NA, for efficient H2 evolution. When semiconductor nanosheets (niobate-NS) were replaced by similar semiconductor nanosheets (titanoniobate-NS), the photocatalytic activity for H2 evolution was lost because of the much faster back electron transfer in the ET state of QuPh+–NA via titanoniobate-NS. The composite photocatalyst of an organic electron donor–acceptor dyad and a Pt catalyst supported on semiconductor nanosheets for H2 evolution developed in this study has paved a new way to combine a wide variety of organic photosynthetic reaction centre models with inorganic photocatalysts for more efficient water splitting that may not be possible by either photocatalytic component alone.4. Experimental section
4.1. Catalyst preparation
![[thin space (1/6-em)]](https://www.rsc.org/images/entities/char_2009.gif) :
:![[thin space (1/6-em)]](https://www.rsc.org/images/entities/char_2009.gif) 1 (v/v)] containing QuPh+–NA (3.0 mM). The amount of exchanged QuPh+–NA ion was calculated based on the decrease in absorbance at 334 nm, characteristic to the QuPh+–NA ion, caused by immersion of niobate-NS or titanoniobate-NS.
1 (v/v)] containing QuPh+–NA (3.0 mM). The amount of exchanged QuPh+–NA ion was calculated based on the decrease in absorbance at 334 nm, characteristic to the QuPh+–NA ion, caused by immersion of niobate-NS or titanoniobate-NS.
4.2. Catalyst characterisation
4.3. Photocatalytic H2 evolution
A typical experimental procedure is as follows: an aqueous suspension (2.0 mL) containing QuPh+–NA/niobate-NS composite (10.5 mg, QuPh+–NA: 0.74 mM), K2PtCl4 (10 μM) and oxalic acid (50 mM) was flushed with N2 gas. The suspension was then photoirradiated for a certain time with a xenon lamp (Ushio Optical, Model X SX-UID 500X AMQ) through a colour filter glass (Asahi Techno Glass L39) transmitting λ > 340 nm at room temperature. After 1 min stirring in the dark, gas in a headspace was analysed by Shimadzu GC-14B gas chromatography (detector: TCD, column temperature: 50 °C, column: active carbon with a particle size 60–80 mesh, carrier gas: N2 gas) to determine the amount of evolved H2.Acknowledgements
This work was supported by Grants-in-Aid (no. 24350069 and 25600025) for Scientific Research from the Japan Society for the Promotion of Science (JSPS), an ALCA project from the Japan Science and Technology Agency (JST), and NRF of Korea through the GRL (2010-00353) program. We sincerely acknowledge the Research Centre for Ultra-Precision Science & Technology, Osaka University for TEM measurements.Notes and references
- (a) S. Dunn, in Encyclopedia of Energy, Elsevier Inc., 2004, vol. 3, pp. 241–252 Search PubMed; (b) M. Momirlan and T. N. Veziroglub, Int. J. Hydrogen Energy, 2005, 30, 795–802 CrossRef CAS PubMed; (c) National research council and national academy of engineering of the national academies, The Hydrogen Economy: Opportunities, Costs, Barriers, and R&D Needs, The National Academies Press, Washington, D.C., 2004 Search PubMed.
- G. Laurenczy, in Encyclopedia of Catalysis, ed. I. T. Horvath, Wiley-Interscience, Hoboken, NJ, 2010 Search PubMed.
- (a) H. B. Gray, Nat. Chem., 2009, 1, 7–7 CrossRef CAS PubMed; (b) N. S. Lewis and D. G. Nocera, Proc. Natl. Acad. Sci. U. S. A., 2006, 103, 15729–15735 CrossRef CAS PubMed; (c) D. G. Nocera, Chem. Soc. Rev., 2009, 38, 13–15 RSC; (d) T. A. Faunce, W. Lubitz, A. W. B. Rutherford, D. MacFarlane, G. F. Moore, P. Yang, D. G. Nocera, T. A. Moore, D. H. Gregory, S. Fukuzumi, K. B. Yoon, F. A. Armstrong, M. R. Wasielewski and S. Styring, Energy Environ. Sci., 2013, 6, 695–698 RSC.
- (a) Y. Amao, ChemCatChem, 2011, 3, 458–474 CrossRef CAS PubMed; (b) P. D. Tran, L. H. Wong, J. Barber and J. S. C. Loo, Energy Environ. Sci., 2012, 5, 5902–5918 RSC; (c) S. Bensaid, G. Centi, E. Garrone, S. Perathoner and G. Saracco, ChemSusChem, 2012, 5, 500–521 CrossRef CAS PubMed.
- (a) D. G. Nocera, Acc. Chem. Res., 2012, 45, 767–776 CrossRef CAS PubMed; (b) M. Wang, L. Chen and L. Sun, Energy Environ. Sci., 2012, 5, 6763–6778 RSC; (c) S. Y. Reece, J. A. Hamel, K. Sung, T. D. Jarvi, A. J. Esswein, J. J. H. Pijpers and D. G. Nocera, Science, 2011, 334, 645–648 CrossRef CAS PubMed.
- (a) R. M. Bullock, A. M. Appel and M. L. Helm, Chem. Commun., 2014, 50, 3125–3143 RSC; (b) P. V. Kamat, J. Phys. Chem. C, 2007, 111, 2834–2860 CrossRef CAS; (c) A. J. Bard and M. A. Fox, Acc. Chem. Res., 1995, 28, 141–145 CrossRef CAS; (d) Y. Qu and X. Du, Chem. Soc. Rev., 2013, 42, 2568–2580 RSC.
- (a) Y. Halpin, M. T. Pryce, S. Rau, D. Dinic and J. G. Vos, Dalton Trans., 2013, 42, 16243–16254 RSC; (b) P. D. Frischmann, K. Mahata and F. Wüthner, Chem. Soc. Rev., 2013, 42, 1847–1870 RSC; (c) B. van den Bosch, H.-C. Chen, J. I. van der Vlugt, A. M. Brouwer and J. N. H. Reek, ChemSusChem, 2013, 6, 790–793 CrossRef CAS PubMed.
- (a) S. Fukuzumi, Eur. J. Inorg. Chem., 2008, 1351–1362 CrossRef CAS PubMed; (b) V. S. Thoi, Y. Sun, J. R. Long and C. J. Chang, Chem. Soc. Rev., 2013, 42, 2388–2400 RSC; (c) S. Fukuzumi, Y. Yamada, T. Suenobu, K. Ohkubo and H. Kotani, Energy Environ. Sci., 2011, 4, 2754–2766 RSC.
- (a) A. Fujishima and K. Honda, Nature, 1972, 238, 37 CrossRef CAS; (b) A. Fujishima, X. Zhang and D. A. Tryk, Int. J. Hydrogen Energy, 2007, 32, 2664 CrossRef CAS PubMed.
- (a) A. Kudo and Y. Miseki, Chem. Soc. Rev., 2009, 38, 253–278 RSC; (b) A. Kudo, Int. J. Hydrogen Energy, 2007, 32, 2673 CrossRef CAS PubMed.
- (a) K. Takanabe and K. Domen, ChemCatChem, 2012, 4, 1485–1497 CrossRef CAS PubMed; (b) K. Maeda and K. Domen, J. Phys. Chem. Lett., 2010, 1, 2655–2661 CrossRef CAS.
- F. E. Osterloh, Chem. Mater., 2008, 20, 35–54 CrossRef CAS.
- X. Chen, S. Shen, L. Guo and S. S. Mao, Chem. Rev., 2010, 110, 6503–6570 CrossRef CAS PubMed.
- J. S. Lee, Catal. Surv. Asia, 2006, 9, 217–227 CrossRef.
- M. G. Walter, E. L. Warren, J. R. McKone, S. W. Boettcher, Q. Mi, E. A. Santori and N. S. Lewis, Chem. Rev., 2010, 110, 6446–6473 CrossRef CAS PubMed.
- H. Zhou, T. Fan and D. Zhang, ChemSusChem, 2011, 3, 513–528 CAS.
- J. Yang, D. Wang, H. Han and A. C. Li, Acc. Chem. Res., 2013, 46, 1900–1909 CrossRef CAS PubMed.
- P. F. Ji, M. Takeuchi, T. M. Cuong, J. L. Zhang, M. Matsuoka and M. Anpo, Res. Chem. Intermed., 2010, 36, 327–347 CrossRef CAS PubMed.
- R. M. Navarro, M. C. Alvarez-Galvan, J. A. V. de la Mano, S. M. Al-Zahrani and J. L. G. Fierro, Energy Environ. Sci., 2010, 3, 1865–1882 CAS.
- R. M. N. Yerga, M. C. A. Galvan, F. del Valle, J. A. V. de la Mano and J. L. Fierro, ChemSusChem, 2009, 2, 471–485 CrossRef PubMed.
- H. Kato, K. Asakura and A. Kudo, J. Am. Chem. Soc., 2003, 125, 3082–3089 CrossRef CAS PubMed.
- (a) K. Domen, A. Kudo, A. Shinozaki, A. Tanaka, K. Maruya and T. Onishi, J. Chem. Soc., Chem. Commun., 1986, 356–357 RSC; (b) K. Domen, A. Kudo, M. Shibata, A. Tanaka, K. Maruya and T. Onishi, J. Chem. Soc., Chem. Commun., 1986, 1706–1707 RSC.
- (a) A. Kudo, A. Tanaka, K. Domen, K. Maruya, K. Aika and T. Onishi, J. Catal., 1988, 111, 67–76 CrossRef CAS; (b) A. Kudo, K. Sayama, A. Tanaka, K. Asakura, K. Domen, K. Maruya and T. Onishi, J. Catal., 1989, 120, 337–352 CrossRef CAS.
- (a) K. Sayama, A. Tanaka, K. Domen, K. Maruya and T. Onishi, Catal. Lett., 1990, 4, 217–222 CrossRef CAS; (b) K. Sayama, A. Tanaka, K. Domen, K. Maruya and T. Onishi, J. Phys. Chem., 1991, 95, 1345–1348 CrossRef CAS; (c) K. Sayama, K. Yase, H. Arakawa, K. Asakura, A. Tanaka, K. Domen and T. Onishi, J. Photochem. Photobiol., A, 1998, 114, 125–135 CrossRef CAS.
- (a) J. Hou, Z. Wang, W. Kan, S. Jiao, H. Zhu and R. V. Kumar, J. Mater. Chem., 2012, 22, 7291–7299 RSC; (b) J. E. Yourey, J. B. Kurtz and B. M. Bartlett, J. Phys. Chem. C, 2012, 116, 3200–3206 CrossRef CAS; (c) P. Lei, F. Wang, S. Zhang, Y. Ding, J. Zhao and M. Yang, ACS Appl. Mater. Interfaces, 2014, 6, 2370–2376 CrossRef CAS PubMed.
- (a) Y. Moriya, T. Takata and K. Domen, Coord. Chem. Rev., 2013, 257, 1957–1969 CrossRef CAS PubMed; (b) K. Maeda, D. Lu and K. Domen, Chem. – Eur. J., 2013, 19, 4986–4991 CrossRef CAS PubMed; (c) M. Higashi, K. Domen and R. Abe, J. Am. Chem. Soc., 2012, 134, 6968–6971 CrossRef CAS PubMed; (d) K. Maeda and K. Domen, J. Phys. Chem. C, 2007, 111, 7851–7861 CrossRef CAS; (e) K. Maeda, K. Teramura and K. Domen, J. Catal., 2008, 254, 198–204 CrossRef CAS PubMed.
- A. J. Bard, J. Photochem., 1979, 10, 59–75 CrossRef CAS.
- (a) R. Abe, K. Shinmei, N. Koumura, K. Hara and B. Ohtani, J. Am. Chem. Soc., 2013, 135, 16872–16884 CrossRef CAS PubMed; (b) R. Abe, K. Sayama, K. Domen and H. Arakawa, Chem. Phys. Lett., 2001, 344, 339–344 CrossRef CAS; (c) R. Abe, J. Photochem. Photobiol., C, 2011, 11, 179–209 CrossRef PubMed.
- W. Fan, Q. Zhang and Y. Wang, Phys. Chem. Chem. Phys., 2013, 15, 2632–2649 RSC.
- K. Sayama, K. Mukasa, R. Abe, Y. Abe and H. Arakawa, Chem. Commun., 2001, 2416–2417 RSC.
- (a) A. Kudo, MRS Bull., 2011, 36, 32–38 CrossRef CAS; (b) Q. Jia, A. Iwase and A. Kudo, Chem. Sci., 2014, 5, 1513–1519 RSC; (c) Y. Sasaki, A. Iwase, H. Kato and A. Kudo, J. Catal., 2008, 259, 133–137 CrossRef CAS PubMed; (d) Y. Sasaki, H. Kato and A. Kudo, J. Am. Chem. Soc., 2013, 135, 5441–5449 CrossRef CAS PubMed.
- (a) K. Maeda, M. Higashi, D. Lu, R. Abe and K. Domen, J. Am. Chem. Soc., 2010, 132, 5858–5868 CrossRef CAS PubMed; (b) K. Maeda, R. Abe and K. Domen, J. Phys. Chem. C, 2011, 115, 3057–3064 CrossRef CAS; (c) K. Maeda, ACS Catal., 2013, 3, 1486–1503 CrossRef CAS.
- H. Gerischer, Photochem. Photobiol., 1972, 16, 243–260 CrossRef CAS PubMed.
- (a) Y. I. Kim, S. Salim, M. J. Huq and T. E. Mallouk, J. Am. Chem. Soc., 1991, 113, 9561–9563 CrossRef CAS; (b) Y. I. Kim, S. J. Atherton, E. S. Brigham and T. E. Mallouk, J. Phys. Chem., 1993, 97, 11802–11810 CrossRef CAS; (c) W. J. Youngblood, S.-H. A. Lee, K. Maeda and T. E. Mallouk, Acc. Chem. Res., 2009, 42, 1966–1973 CrossRef CAS PubMed.
- T. Nakato, K. Kuroda and C. Kato, Chem. Mater., 1992, 4, 128–132 CrossRef CAS.
- K. Mori, S. Ogawa, M. Martis and H. Yamashita, J. Phys. Chem. C, 2012, 116, 18873–18877 CAS.
- T. K. Townsend, E. M. Sabio, N. D. Browning and F. E. Osterloh, ChemSusChem, 2011, 4, 185–190 CAS.
- S. Uchida, Y. Yamamoto, Y. Fujishiro, A. Watanabe, O. Ito and T. Sato, J. Chem. Soc., Faraday Trans., 1997, 93, 3229–3234 RSC.
- K. Maeda, M. Eguchi, W. J. Youngblood and T. E. Mallouk, Chem. Mater., 2008, 20, 6770–6778 CrossRef CAS.
- (a) H. Hagiwara, T. Inoue, K. Kaneko and T. Ishihara, Chem. – Eur. J., 2009, 15, 12862–12870 CrossRef CAS PubMed; (b) H. Hagiwara, M. Nagatomo, C. Seto, S. Ida and T. Ishihara, J. Photochem. Photobiol., A, 2013, 272, 41–48 CrossRef CAS PubMed; (c) H. Hagiwara, T. Inoue, S. Ida and T. Ishihara, Phys. Chem. Chem. Phys., 2011, 13, 18031–18037 RSC.
- (a) M. R. Wasielewski, Acc. Chem. Res., 2009, 42, 1910–1921 CrossRef CAS PubMed; (b) D. Gust, T. A. Moore and A. L. Moore, Acc. Chem. Res., 2009, 42, 1890–1898 CrossRef CAS PubMed; (c) D. Gust, T. A. Moore and A. L. Moore, Acc. Chem. Res., 1993, 26, 198–205 CrossRef CAS.
- (a) S. Fukuzumi, K. Ohkubo and T. Suenobu, Acc. Chem. Res., 2014, 47, 1455–1464 CrossRef CAS PubMed; (b) S. Fukuzumi, Phys. Chem. Chem. Phys., 2008, 10, 2283–2297 RSC; (c) S. Fukuzumi and K. Ohkubo, J. Mater. Chem., 2012, 22, 4575–4587 RSC; (d) S. Fukuzumi, Org. Biomol. Chem., 2003, 1, 609–620 RSC.
- S. Fukuzumi, H. Kotani, K. Ohkubo, S. Ogo, N. V. Tkachenko and H. Lemmetyinen, J. Am. Chem. Soc., 2004, 126, 1600–1601 CrossRef CAS PubMed.
- H. Kotani, K. Ohkubo and S. Fukuzumi, Faraday Discuss., 2012, 155, 89–102 RSC.
- (a) H. Kotani, K. Ohkubo, Y. Takai and S. Fukuzumi, J. Phys. Chem. B, 2006, 110, 24047–24053 CrossRef CAS PubMed; (b) H. Kotani, T. Ono, K. Ohkubo and S. Fukuzumi, Phys. Chem. Chem. Phys., 2007, 9, 1487–1492 RSC; (c) H. Kotani, R. Hanazaki, K. Ohkubo, Y. Yamada and S. Fukuzumi, Chem. – Eur. J., 2011, 17, 2777–2785 CrossRef CAS PubMed.
- (a) Y. Yamada, T. Miyahigashi, H. Kotani, K. Ohkubo and S. Fukuzumi, J. Am. Chem. Soc., 2011, 133, 16136–16145 CrossRef CAS PubMed; (b) Y. Yamada, S. Shikano and S. Fukuzumi, J. Phys. Chem. C, 2013, 117, 13143–13152 CrossRef CAS.
- Y. Yamada, T. Miyahigashi, H. Kotani, K. Ohkubo and S. Fukuzumi, Energy Environ. Sci., 2012, 5, 6111–6118 CAS.
- Y. Yamada, T. Miyahigashi, K. Ohkubo and S. Fukuzumi, Phys. Chem. Chem. Phys., 2012, 14, 10564–10571 RSC.
- Y. Yamada, H. Tadokoro and S. Fukuzumi, RSC Adv., 2013, 3, 25677–25680 RSC.
- Y. Yamada, A. Nomura, K. Ohkubo, T. Suenobu and S. Fukuzumi, Chem. Commun., 2013, 49, 5132–5134 RSC.
- (a) D. B. Haytowitz and R. H. Matthews, Agriculture Handbook No. 8–11, Science and Education Administration, USDA, Washington, D.C., 1984 Search PubMed; (b) E. A. Malinka and G. L. Kamalov, React. Kinet. Catal. Lett., 1993, 52, 13–18 CrossRef; (c) E. A. Malinka and G. L. Kamalov, J. Photochem. Photobiol., A, 1994, 81, 193–197 CrossRef CAS; (d) E. A. Malinka, G. L. Kamalov, S. V. Vodzinskii, V. I. Melnik and Z. I. Zhilina, J. Photochem. Photobiol., A, 1995, 90, 153–158 CrossRef CAS.
- K. Nassau, J. W. Shiever and J. L. Bernstein, J. Electrochem. Soc., 1969, 116, 348–353 CrossRef CAS PubMed.
- A. D. Wadsley, Acta Crystallogr., 1964, 17, 623–628 CrossRef CAS.
- G. H. Du, Y. Yu, Q. Chen, R. H. Wang, W. Zhou and L. M. Peng, Chem. Phys. Lett., 2003, 377, 445–448 CrossRef CAS.
- R. C. Weast, in Handbook of Chemistry and Physics, CRC, Cleaveland, OH, 56th edn, 1975–1976 Search PubMed.
- S. Fukuzumi, K. Doi, A. Itoh, T. Suenobu, K. Ohkubo, Y. Yamada and K. D. Karlin, Proc. Natl. Acad. Sci. U. S. A., 2012, 109, 15572–15577 CrossRef CAS PubMed.
- D. E. Scaife, Sol. Energy, 1980, 25, 41–54 CrossRef CAS.
- M. A. Bizeto and V. R. L. Constantino, Mater. Res. Bull., 2004, 39, 1729–1736 CrossRef CAS PubMed.
Footnote |
| † Electronic supplementary information (ESI) available: N2 adsorption–desorption isotherms (Fig. S1 and S5), powder X-ray diffraction (Fig. S2, S3 and S5), TG/DTA curves (Fig. S4 and S6), IR spectra (Fig. S7), TEM images (Fig. S8), time course of absorbance change (Fig. S9), irradiance dependence of H2 evolution rates (Fig. S10) and time course of CO2 evolution in oxalate oxidation (Fig. S11). See DOI: 10.1039/c4cy01005a |
| This journal is © The Royal Society of Chemistry 2015 |

