
 Open Access Article
 This Open Access Article is licensed under a Creative Commons Attribution-Non Commercial 3.0 Unported Licence
Molecular dynamics of NH3 induced by core-electron excitation
Noelle
Walsh
*a,
Anna
Sankari
a,
Joakim
Laksman
b,
Tomas
Andersson
a,
Shabnam
Oghbaie
a,
Feras
Afaneh
c,
Erik P.
Månsson
a,
Mathieu
Gisselbrecht
a and
Stacey L.
Sorensen
a
aDivision of Synchrotron Radiation Research, Department of Physics, Lund University, Box 118, 22100 Lund, Sweden. E-mail: noelle.walsh@sljus.lu.se
bMAX IV Laboratory, Lund University, Lund, Sweden
cPhysics Department, The Hashemite University, P.O. Box 150459, Zarqa 13115, Jordan
First published on 25th June 2015
Abstract
Nuclear motion in the N1s−14a11 core-excited state of ammonia is investigated by studying the angular anisotropy of fragments produced in the decay of the highly excited molecule and compared with predictions from ab initio calculations. Two different fragmentation channels (H+/NH2+ and H+/NH+/H) reveal complex nuclear dynamics as the excitation photon energy is tuned through the 4a1 resonance. The well-defined angular anisotropy of the fragments produced in the dissociation of the molecular dication species suggests a very rapid nuclear motion and the time scale of the nuclear dynamics is limited to the low fs timescale.
1 Introduction
Core-excited states in molecules are typically very short lived and their spectroscopies can be sensitive to the geometry of the molecule in those states.1,2 Nuclear motion in the core-excited state prior to electronic decay has been verified for a number of molecules1–7 and has been observed to influence both electronic decay and fragmentation dynamics (and kinematics).1,3,8–10Reported rapid geometry changes following core-electron excitation4–6 include the observation of a strong bending motion in H2O that results in bond rearrangement,10 an out-of-plane nuclear motion in BF311 and the induction of an umbrella-like bending motion in CH3.7 In the case of core-excitation to a potential-energy surface (PES) with repulsive character, an ultrafast bond elongation on the fs-timescale may be initiated within the core-hole lifetime such that dissociation competes with Auger decay. Ultra-fast dissociation12 in the core-excited state has been documented for a number of molecules.3,9,13–20
In this work we investigate the response of NH3 to core electron excitation to the 4a1 molecular orbital. In particular we aim to investigate any nuclear dynamics induced in the molecule as a result of this excitation and how the molecular geometry evolves as the photon energy is detuned through the N1s−14a11 resonance.
To date very different nuclear dynamics have been reported for NH3 in the N1s−14a11 state. The work of Hjelte9 provided spectroscopic evidence for ultra-fast dissociation on a timescale comparable to the core-excited state lifetime (∼6 fs) – providing confirmation that a rapid extension of an N–H bond along one coordinate of the 4a1 PES can take place. In that work, approximately ∼1% of cases involved dissociation before Auger decay in the molecule.9 Meanwhile, Senba21 and coworkers concluded that a symmetric stretching mode, ν1, and a symmetric bending mode, ν2, with periods on the same order of magnitude as the lifetime of the core-excited state are activated upon excitation of an N1s electron to the 4a1 orbital. Their data also indicated that the population of stable NH32+ states as a result of Auger decay from the N1s−14a11 state was influenced by the vibrational state of the core-excited molecule. The present study allows us to gain a better insight into the interplay between these bending and stretching motions.
While electron and fluorescence spectrometries can provide evidence for nuclear motion, the detailed description of the geometric evolution of the molecule is difficult to extract directly from spectroscopic measurements. However, over the last two decades the coincidence momentum imaging technique has been developed and application of this enables the elucidation of molecular geometry.5,22–25
Our three-dimensional multi-coincidence ion imaging spectrometer allows us to study the energy sharing between fragments and to determine the angular anisotropy of the fragments produced via dissociation following photoexcitation. The setup has been used to shed light on ultrafast nuclear motion in C2H2,6 OCS,26 CO227 and H2O.10 Here, we employ the imaging technique for the study of NH3.
In its ground state NH3 has a trigonal pyramidal geometry and belongs to the C3v symmetry group with a H–N–H bond angle of 107.8°.28 The electronic configuration of this state is 1a212a211e43a21 (![[small chi, Greek, tilde]](https://www.rsc.org/images/entities/char_e11b.gif) 1A1) and the LUMO (Lowest Unoccupied Molecular Orbital) is the 4a1 orbital. The core-excited states of NH3 have been studied both theoretically and experimentally29–31 and their symmetries have been confirmed by angle-resolved ion studies.32 Both the ground state of NH3 and the 4a1 core-excited state have A1-symmetry. The 4a1 state is known to be of mixed Rydberg and anti-bonding valence character.9,29
1A1) and the LUMO (Lowest Unoccupied Molecular Orbital) is the 4a1 orbital. The core-excited states of NH3 have been studied both theoretically and experimentally29–31 and their symmetries have been confirmed by angle-resolved ion studies.32 Both the ground state of NH3 and the 4a1 core-excited state have A1-symmetry. The 4a1 state is known to be of mixed Rydberg and anti-bonding valence character.9,29
Schematic cuts (along one N–H coordinate) through the PES of the NH3 ground state, 1A1, and the N1s−14a11 core-excited state (NH3*) are illustrated in Fig. 1. In general relaxation of a core-excited state in a molecule proceeds via fluorescence or rapid Auger decay in the molecular geometry before ultrafast dissociation can occur. In the case of NH3, Auger decay is observed to be the strongest of these two decay channels. Most of the resultant singly- or multiply-ionized final states produced via resonant Auger decay may undergo a further decay via dissociation on subpicosecond timescales. In Fig. 1 typical PES of NH32+ dication final states are illustrated along with the two fragmentation pathways that are of interest in this study – those resulting in the detected coincidences: H+/NH2+ (Section 4.1) and H+/NH+ (Section 4.2).
 | ||
| Fig. 1 Left panel: Schematic cut through the PES involved in the N1s → 4a1 transition. The shape of the core-excited state PES follows that indicated by our calculations. Before significant N–H bond elongation, electronic decay in the molecule produces NH32+ that can subsequently dissociate to yield NH2+ + H+. Alternatively, if N–H bond extension is rapid, ultrafast dissociation producing a neutral H and excited NH2* is possible. Auger decay of NH2* and dissociation follows. Upper right panel: Illustration of the 4a1 molecular orbital. Lower right panel: Detuning the excitation photon energy across the 4a1 resonance results in excitation to different parts of the core-excited state PES. Both vibrational motion21 and ultrafast dissociation9 have been reported for this core-excited state. | ||
When ultra-fast dissociation does occur, an excited neutral N-based fragment (NH2*) is produced along with a neutral H fragment (Fig. 1). The NH2* may subsequently de-excite via normal Auger decay to produce NH22+ which dissociates leading to the double coincidence H+/NH+ – which can be analysed in our data as the 3-body break-up: H+/NH+/H.
A schematic of the total ion-yield (TIY) spectrum for ammonia just below the N1s-edge (N1s I.P. 405.55(4) eV![[thin space (1/6-em)]](https://www.rsc.org/images/entities/char_2009.gif) 33) is included in Fig. 1. Detuning the photon energy across the 4a1 resonance results in excitation to different parts of the core-excited state PES (Fig. 1: inset).
33) is included in Fig. 1. Detuning the photon energy across the 4a1 resonance results in excitation to different parts of the core-excited state PES (Fig. 1: inset).
Excitation using lower photon energies (arrow ‘a’) results in excitation to a bound part of the PES. In this case the molecule spends more time in the core-excited state and there is more time for nuclear motion to occur. In contrast, excitation using higher photon energies on the 4a1 resonance (arrow ‘b’) results in excitation to the repulsive (steeper) part of the PES. Due to the repulsive character of the PES in this region, faster nuclear dynamics and shorter core-excited state lifetimes are expected.
The kinetic energy released (KER) in the dissociation of the dication is dependent on that part of the dication PES to which resonant Auger decay occurred (Fig. 1). Dissociation from (i) the highest part of the PES results in a higher KER than if dissociation would occur from (ii) a lower part of the same PES to the same NH2+ fragment state. The kinetic energy release distribution (KERD) recorded in our experiment corresponds to all KERs measured in the dissociation of various dication states to different N-based fragment states.
2 Experimental method
Tunable synchrotron radiation from the soft X-ray beamline I411 at the MAX IV laboratory in Lund, Sweden34 was utilised for resonant excitation at the N1s−14a11 state at 400.7 eV (photon energy resolution ∼100 meV). At these photon energies the contribution from second-order light was negligible. The TIY spectrum recorded during these measurements (Fig. 3: lower panel) is calibrated according to the N1s → 2e peak from ref. 32 and its features agree well with previously published TIY-spectra.29,32The high purity sample gas was obtained from Linde with a stated purity of 99.9999% (Ammonia 6.0). The gas sample was introduced in the interaction region of the spectrometer via an effusive gas jet. The background pressure in the experimental chamber was maintained at about 5 × 10⁻⁶ mbar.
For these measurements our 3D-momentum imaging Time-of-Flight (ToF) multi-coincidence spectrometer was mounted such that the ToF axis was mutually perpendicular to the direction of propagation of the synchrotron light and to the polarisation vector of the X-rays (Fig. 2). An electron detector mounted on the opposite side of the interaction region to the ToF section is used to provide the start signal for the experimental timing. The spectrometer has a two-stage acceleration with an electrostatic lens for optimal ion focussing to a delay line detector. The ROENTDEK DLD80 2-D position sensitive detector has multi-hit capability and is a high resolution timing and imaging device. We can image multiple coincidence events such as molecular fragmentation and the momenta of all ionic fragments are measured in three dimensions.35 The complete kinematic information available to us allows us to determine the angular correlations and kinetic energy correlation between fragments for specific dissociation channels.
 | ||
Fig. 2 Geometry of experimental setup: θ is the angle between the polarisation vector, ![[small epsilon, Greek, vector]](https://www.rsc.org/images/entities/i_char_e0e7.gif) , and the broken molecular bond. is perpendicular to the propagation direction of synchrotron radiation (SR) and spectrometer axis. The expected alignment of NH3 relative to for the N1s → 4a1 transition is indicated. Example of a detector image is included showing perpendicular ejection of H+ fragment. , and the broken molecular bond. is perpendicular to the propagation direction of synchrotron radiation (SR) and spectrometer axis. The expected alignment of NH3 relative to for the N1s → 4a1 transition is indicated. Example of a detector image is included showing perpendicular ejection of H+ fragment. | ||
Data treatment involves transforming the raw experimental data recorded for each of the coincidence events into a three-dimensional momentum space.6,26,27 Subsets of the data are then extracted by filtering by criteria for angle, momentum or fragmentation channel. For this work the direction of the polarisation vector was determined independently by measuring the angular distribution of fragments from core-excited carbon monoxide.36
The molecular anisotropy parameter, β, characterises the angular distribution of fragments produced in a dissociation event with respect to the polarisation vector. The conventional analytical expression for the differential photoabsorption cross section is
 | (1) |
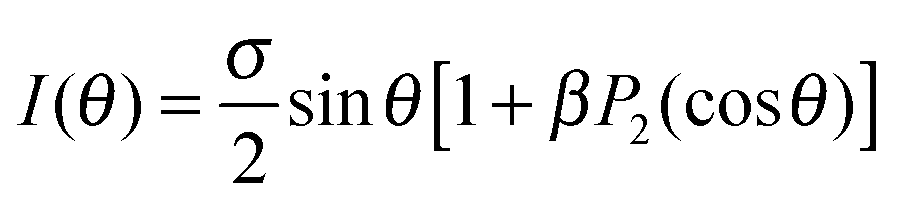 | (2) |
For a gas with randomly-oriented molecules the ensemble of resonantly-excited species will be aligned with respect to the direction of the polarisation vector of the incident (linearly-polarised) light and according to the transition symmetry. The electronic transition probability for an N1s → 4a1 (A1 → A1 transition i.e. A1 symmetry) excitation is at a maximum when the main symmetry axis of the molecule is oriented parallel to the polarisation vector of the absorbed radiation (Fig. 2).
In the absence of rotation37,38 and vibronic coupling39 the geometry of the core-excited state is projected onto ejected fragments, and can be measured in the angular distribution of ionic fragments. For rapidly-filled core-hole states the electronic decay takes place well before rotation occurs, and if dissociation is rapid then the conditions of the axial-recoil approximation are fulfilled. Under such conditions the direction of emission of ionic fragments reflects the initial molecular ion geometry. If fragmentation takes place on a subpicosecond time scale – the regime of validity of the axial-recoil approximation, then the angular anisotropy of the ejected fragment will be directly related to the angle, θ, between the molecular transition dipole moment and the broken bond (indicated in Fig. 2)40,41
| β = 3cos2θ − 1. | (3) |
3 Computational details
Potential energy curves along one N–H coordinate were calculated with the MOLCAS 7 package42 for the ground, core-excited and dication states. The extended relativistic atomic natural orbital basis sets of VTZP and VDZP quality were used for nitrogen and hydrogen, respectively. All energies were calculated using multiconfigurational second-order perturbation method (CASPT2) with wavefunctions obtained from complete active space self-consistent field (CASSCF) calculations. The core hole was created by defining the occupation number of the 1a1 orbital to be equal to 1.00. With the 1a1 belonging to the restricted active space 3 (RAS3), where occupation of only one electron was allowed, we were able to maintain the core hole during the calculations.In this work we are interested in the nuclear dynamics in the core-excited state and therefore we have followed the minimum energy path (MEP) in the core-excited state from the ground state equilibrium geometry. Here we used the SLAPAF program from the MOLCAS package with the same level of theory as described above. Energy calculations showed an existence of an energy barrier of height 0.17 eV at 1.2 Å (calculated also in ref. 9). Our calculations without any coordinate constraints predict a more open, almost planar geometry for core-excited NH3 after vertical excitation from the ground state. We also studied the MEP for bond elongation along one N–H coordinate in the core-excited state by lengthening one N–H coordinate and allowing the other coordinates to relax. The resulting geometries are shown in the top of the Fig. 1 for N–H bond lengths 1.0 Å, 1.1 Å and 1.9 Å.
4 Results and discussion
N 1s excitation to the 4a1 molecular orbital has been investigated as a function of detuning the excitation photon energy across the 4a1 resonance:| NH3 + hν → NH3*(N1s−14a11) |
4.1 The H+/NH2+ channel
NH32+ → H+ + NH2+ – single-step fragmentation to produce H+ and NH2+ (in a range of vibrational, rotational and electronic states).Dynamics and kinematics
The anisotropy parameters (β-values) for the H+/NH2+ double coincidence events have been determined from the measured angular distribution of those fragments and are plotted in Fig. 3 as a function of excitation photon energy. The corresponding θ-scale (eqn (3)) is indicated on the right-hand axis of the graph. The off/below-resonance (369.8 eV) values are also included in the plot. Using trigonometry θ ∼ 69° for NH3 in the ground state.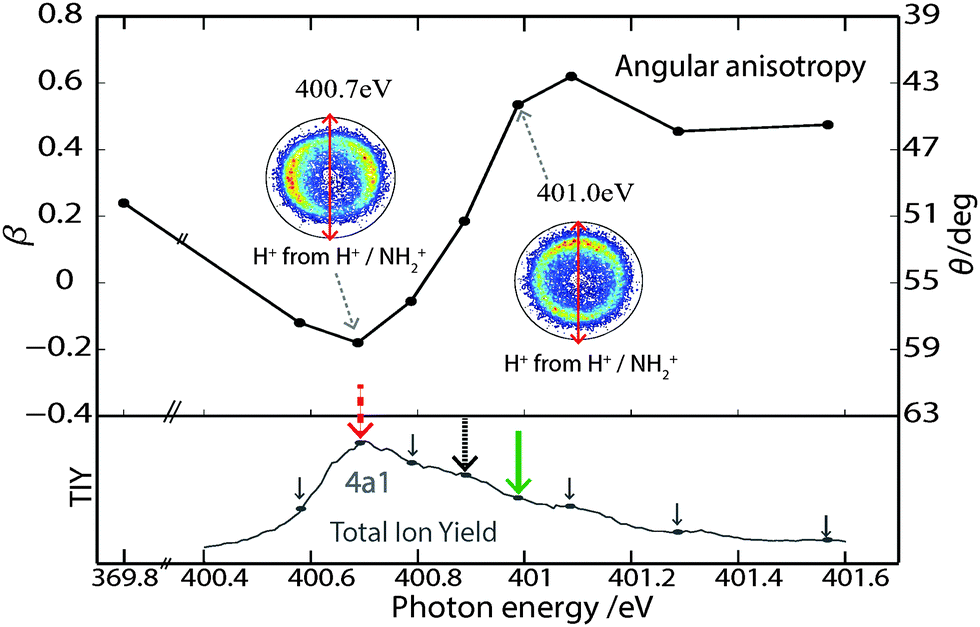 | ||
| Fig. 3 Upper panel: β (anisotropy parameter) for H+ in coincidence with NH2+ plotted as a function of photon energy. Right-hand axis indicates corresponding θ-scale. Lower panel: TIY across the 4a1 state. The coloured arrows indicate the excitation photon energies discussed in Fig. 4: 400.7 eV (red dashed), 400.9 eV (black dotted) and 401.0 eV (green). | ||
The experimental data in Fig. 3 clearly shows an evolution of the β-value for the H+/NH2+ channel as the photon energy is swept through the 4a1 resonance. Considering this behaviour in terms of the out-of-plane angle, θ: θ is observed to be more open following photoexcitation at low photon energies on the 4a1 resonance and more closed following the use of higher photon energies on the resonance. In fact detuning by just +0.3 eV from the resonance maximum corresponds to a 15° reduction in θ. This photon energy dependence could arise due to nuclear dynamics in the core-excited state or as a result of the population of different final states.
Previous measurements by Lindgren et al.32 using PEPIPICO also indicated a closing of θ upon detuning to higher energies on the 4a1 resonance. Whereas those measurements were performed with a Wiley–McLaren type ToF mass spectrometer and the corresponding data analysis involved extensive simulations, the 3D-imaging spectrometer used to record the data presented here allows us to measure the complete kinematics of the dissociation.
Since final dication dissociation processes have characteristic kinetic energy releases (cf.Fig. 1), analysis of the kinetic energy release distributions (KERDs) should allow us to determine if the same/different final dissociative states and fragment states are populated as the photon energy is detuned. The KERDs recorded at 400.7 eV and 401.0 eV in Fig. 4 (upper panel) show no change in population, i.e. the same final dication states correlating to the NH2+ + H+ pathway are populated. We thus conclude that, to a first approximation, the photon energy dependent geometrical distortion is not a final state effect.
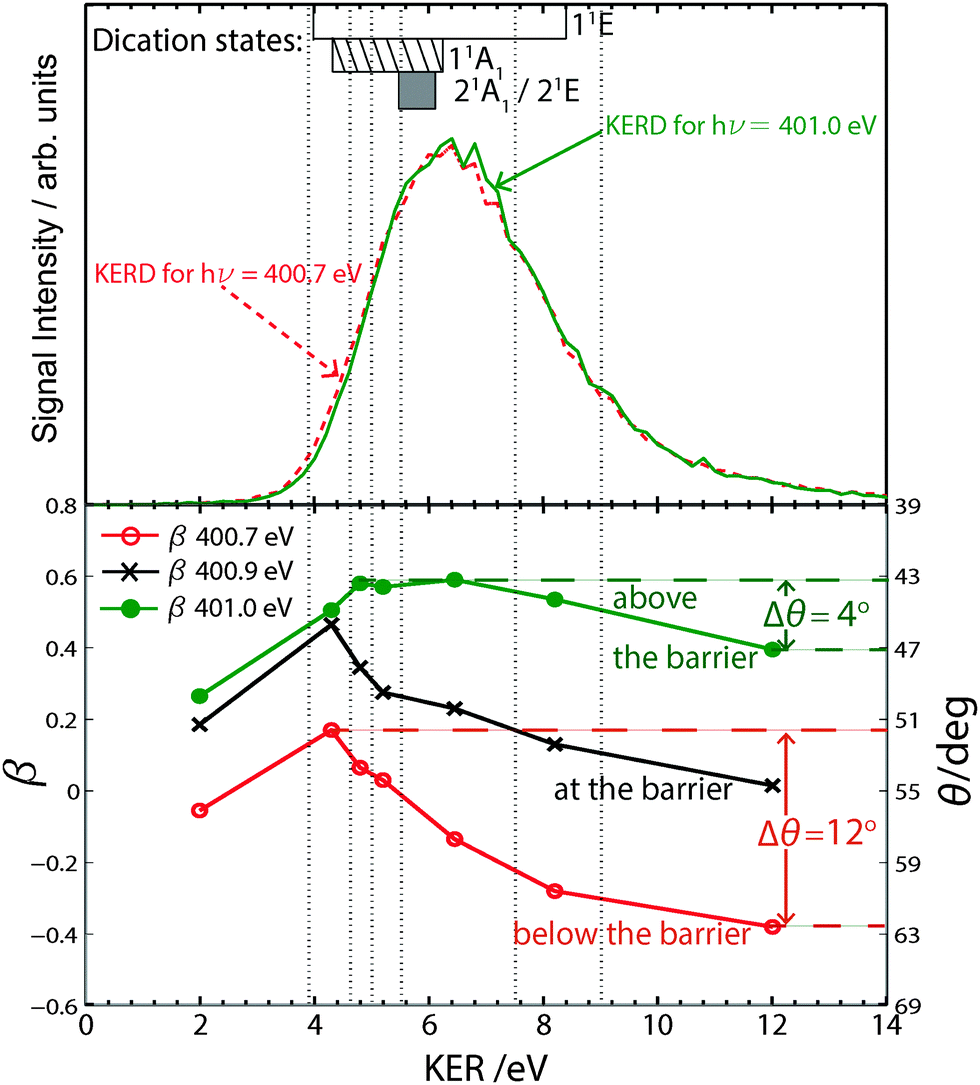 | ||
| Fig. 4 Upper panel: KERDs showing the total KER in the dissociation of NH32+ to H+ + NH2+ at hν = 400.7 eV (red dashed) and 401.0 eV (green). KER ranges for dication states discussed in the literature are indicated at the top of the plot.43,46,47 Lower panel: KER-filtered β-parameters for the excitation photon energies: 400.7 eV (red), 400.9 eV (black) and 401.0 eV (green) as indicated in Fig. 3. θ is observed to vary by 12° for hν = 400.7 eV and by just 4° for hν = 401.0 eV. Vertical dotted lines indicate the KER ranges used. | ||
We can further analyse the processes driving the observed change in β by studying the KER-filtered β-values at different photon energies (Fig. 4: lower panel). Appropriate KER filter ranges (indicated by broken grey lines) were chosen based on previously reported KERs in the fragmentation of various dication final states.43–47
The KER-filtered β-values plotted in Fig. 4 (lower panel) as a function of KER, indicate that different geometries are associated with different dication dissociation pathways. Based on the KERs reported in the literature43–47 as well as the KER estimates from our own work and taking fragmentation branching ratios and ToF correlation plots into account, we conclude that the dication states (dominant hole configuration): 11A1 (3a1−2), 11E (1e−13a1−1), 21A1 (1e−2) and the 21E (1e−2) contribute most to our data. These dissociation channels have previously been studied via inner-valence ionisation43,44,46 and after N1s ionisation47 but not for resonant excitation. The corresponding KERs that have been reported in the literature are indicated above the KERDs in Fig. 4 (upper panel). From these we see that the 1E state has been associated with high KERs. In this work the ability to detune the photon energy allows us to probe the fate of excited states when they are excited to different parts of the core-excited state PES.
The KER-filtered β-values in Fig. 4 are also observed to be dependent on the excitation photon energy with those recorded following core-excitation at 400.7 eV more negative than the β s recorded following excitation at 401.0 eV, i.e. a larger θ is measured following excitation at the lower photon energy. If symmetric bonds are assumed the core-excited molecule would have a more open geometry at 400.7 eV.
β-values (geometries) for those states associated with KERs > 4.5 eV show the strongest photon energy dependence. The data recorded at 400.7 eV shows the largest variation in β with θ varying by as much as 12°. A much narrower variation of θ is observed following photoexcitation at 401.0 eV (4°). Evidently a wider range of geometries are measured following core-excitation at the resonance maximum (400.7 eV).
Analysis of the KER-filtered β values at all photon energies on the 4a1 resonance (cf. lower panel in Fig. 3 for all photon energies measured) reveals an interesting trend. All data recorded with photon energies below 400.9 eV resulted in β curves that behave similarly to that recorded at 400.7 eV. In contrast, for photo-excitation above 400.9 eV, the resulting β curves showed similar trends to that recorded for 401.0 eV.
The geometry changes evident in the experimental data in Fig. 3 and 4 are due to a complex collection of nuclear motions in the 4a1 core-excited state. Geometry optimisation for this state predicts that the molecule strives for a more open, planar geometry following core-excitation. However, the extent of geometrical relaxation that is achieved depends on the time elapsed between core excitation and Auger decay. Due to the presence of a small potential energy barrier in the 4a1 state, core-excitation may be to a bound or unbound part of the 4a1 PES – the lifetime (and hence the nuclear motion that occurs) varies depending on to where on the PES excitation occurs. Core excitation at photon energies below 400.9 eV is to a bound part of the PES and the molecule can be expected to spend more time in the core excited state. Core excitation above 400.9 eV is to an unbound, dissociative part of the PES. In this case, shorter core excited state lifetimes are expected and there is less time for nuclear motion to occur. In addition, the resonant X-ray scattering duration time,48
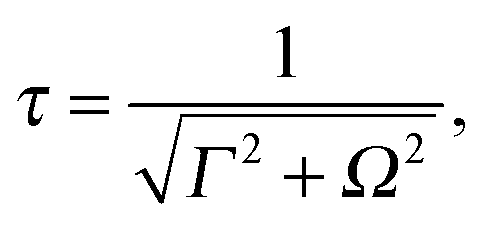 | (4) |
Core-excitation at 400.7 eV is to a weakly bound part of the PES (arrow ‘a’ Fig. 1: inset). We expect a roughly 5–6 fs scattering time on resonance (Ω = 0). Due to the presence of the potential energy barrier and to the fact that the scattering duration time is at a maximum more extensive geometrical relaxation is possible (cf. larger θ at 400.7 eV in Fig. 3 and 4).
In contrast, for positive detuning at 401 eV (detuning by +300 meV) core-excitation is to an unbound, repulsive part of the 4a1 PES (arrow ‘b’ Fig. 1: inset). The reduced scattering time is roughly 2 fs. In this case, core-excitation above the barrier can essentially be considered to be to a dissociative state and the scattering duration time is expected to play a larger role in determining the nuclear dynamics. The shorter scattering duration time at this photon energy, allows less time for relaxation to a planar geometry. In the absence of any other nuclear motion the geometry of the molecule at the time of Auger decay would be closer to the trigonal pyramidal arrangement, i.e. less open as observed in Fig. 3 for photon energies close to 400.9 eV. The reduction of θ following photoexcitation at energies above 400.9 eV in Fig. 3 can be explained as occuring due to another type of nuclear dynamics. Photoexcitation to the repulsive part of the 4a1 PES (i.e. above the potential barrier) increases the likelihood of ultrafast bond elongation.9 MEP calculations performed as part of this analysis confirm that the molecule responds to this asymmetric bond elongation by a reduction of the H–N–H bond angles and this results in a corresponding reduction of θ. For dissociation times that are slower than the scattering duration time Auger decay may occur before dissociation can occur. However, it is possible that significant bond elongation has occurred before Auger decay, in which case we would observe this ultrafast bond elongation via the (resultant) closing of θ in our two-body fragmentation data. In contrast, a molecule with a faster dissociation time than the scattering duration time will undergo extensive nuclear motion leading to ultrafast dissociation before Auger decay.13
The more extensive variation in β observed in Fig. 4 following photoexcitation at 400.7 eV, compared to that observed at 401.0 eV can also be explained in this framework. When core excitation is to a bound part of the PES, the longer lifetime also allows for the occurrence of vibrational motion in the core-excited state and this motion is reflected in the wider range of β values (and hence θ). As aforementioned, analysis of the KER-filtered β curves for all photon energies on the 4a1 resonance supports this picture by clearly highlighting the distinct differences between the β-values recorded below and above 400.9 eV photon energy. The unique character of the experimental data recorded at 400.9 eV could be interpreted as arising due to core-excitation to a part of the PES that coincides with the potential barrier maximum (i.e. neither above nor below the barrier maximum). Our experimental data would then allow us to estimate a barrier height of about 0.2 eV which is in reasonable agreement with the value of 0.17 eV obtained from our calculations.
By continuing our analysis using a different fragmentation channel we can determine if the observed nuclear dynamics is dependent on the fragmentation channel investigated.
4.2 The H+/NH+/H channel
NH32+ → H+ + NH+ + H – reaction can proceed in several steps. The fragmentation mechanisms can be illuminated with analysis.For this analysis, the momenta of two of the fragments are measured and the momentum of the third undetected fragment (ionic or neutral) is reconstructed by using the conservation of momentum. We note that since the third fragment is undetected, we cannot determine the extent to which trication fragmentation contributes to the 3-body data presented here. However, a very low multi-coincidence signal for the pathway in question (H+ + H+ + NH+) is observed in our data. In addition, due to the highly charged nature of the trication, we expect the dissociation of NH33+ to occur with large kinetic energy release.
Dalitz plots50,51 are useful analytic tools for the visualisation of three-body processes where fragmentation mechanisms and the dynamics involved in dissociation can be determined. A general description for the normalised coordinates used in the Dalitz plot is:
 | (5) |
 is the momentum vector of the fragments, i = 1…3. A kinematic constraint
  dictates that all points must lie in a plane whilst conservation of linear momentum
  dictates that all points must lie within a circle. Use of Cartesian coordinates,
  and yD = ε1 − 1/3, to describe the data allows the presentation of the data in a 2D plot (Dalitz plot) which can then be used to determine the vector correlation between fragments. In the Dalitz plot the data is located within a circle of radius 1/3 inscribed in an equilateral triangle of unit height. Each Dalitz axis, i, is a vector of unit length drawn from the center of one side of the triangle (εi = 0, where particle i has zero momentum) to the opposite vertex (εi = 1). For any point in the circle the value of εi for the ith fragment is given by the perpendicular projection of the point onto that Dalitz axis (∑εi = 1).
Fig. 5 contains KER-filtered Dalitz plots for the ranges indicated in the KERD in the lower half of the figure. Here we use the more specific subscripts, εH+, εNH+ and εH. The data was recorded following N1s → 4a1 excitation at 400.7 eV. Different regions of the Dalitz plots dominate for different kinetic energy ranges. Clearly, different fragmentation mechanisms are associated with these – we can identify both sequential and concerted processes in the data.
 | ||
| Fig. 5 Upper panel: KER-filtered Dalitz plots for the 3-body fragmentation H+ + NH+ + H measured after photoexcitation at 400.7 eV for the KER ranges: (a) 0–5 eV, (b) 5–10 eV, (c) 10–15 eV and (d) >15 eV. Lower panel: Kinetic energy release distributions after photoexcitation at 369.8 eV, 400.7 eV and 401.0 eV. | ||
In Fig. 5(a) the very weak signal intensity is nearly perpendicular to the εH axis, indicating a weak correlation between H and the other two fragments. The NH+ and the H+ fragments are anti-correlated to each other. Such a pattern is typical of a sequential fragmentation process in which H is ejected in the first step. In this case H is ejected with negligible momentum, whilst NH+ and the H+ carry away significant momentum. The features observed for 5–10 eV kinetic-energy release (Fig. 5(b)) indicate the emission of NH+ with slightly higher momentum in a somewhat more concerted process than that observed in Fig. 5(a).
In Fig. 5(c) the feature for yet higher KER's (10–15 eV) is located symmetrically on the εNH+ axis reflecting that the two H fragments are emitted with equal momenta during a concerted breakup whilst the NH+ fragment carries away significant kinetic energy. For the higher KER range, KER > 15 eV (Fig. 5(d)), the feature is located to the right of εNH+ and implies processes with a much more concerted character than those in Fig. 5(b).
The weak feature in Fig. 5(a) could be attributed to ultrafast dissociation where loss of the H-fragment occurs before Auger decay imparting a relatively low KER to the neutral fragments. The neutral NH2* would subsequently undergo Auger decay to NH22+ and fragmentation into the H+ and NH+ ions. In this second step, the Coulomb repulsion would result in higher fragment kinetic energies.
The signal intensity in Fig. 5(b) for the 5–10 eV KER range and in Fig. 5(d) for KER > 15 eV, are the result of asynchronous dissociation mechanisms. The data in Fig. 5(b) could arise due to asymmetric bond elongation directly before fragmentation. Asynchronous concerted processes, for example, non-pure sequential fragmentation (in which the second step is not completely independent of the first step52) are likely causes for the signal observed in Fig. 5(d). Note that since two of the three fragments are actually measured, the undetected particle may be either H or H+.
In the 10–15 eV KER interval (Fig. 5(c)) the symmetric ejection of hydrogen fragments takes place in the dissociation of the trication. An event producing the three ionic fragments, H+ + H+ + NH+, may be detected as a double coincidence since the probability of detecting two H+ from the same dissociation is affected by the finite detection efficiency of the detector and the electronics dead time (∼20 ns) such that the resulting multi-ion detection deadtime ranges between 20–100 ns (depending on the temporal separation of the ion hits and their corresponding [x,y]-positions on the DLD detector).
The evolution of the Dalitz plots as a function of photon energy is investigated in Fig. 6 for the photon energies (a) 369.8 eV, (b) 400.7 eV and (c) 401.0 eV. In these diagrams no KER filtering has been performed. The corresponding KERDs are plotted in the lower column of Fig. 5. Two distinct features (denoted ‘1’ and ‘2’) are apparent in the Dalitz plots. Comparison with the KER-filtered Dalitz plots in Fig. 5 reveals that feature ‘1’ which dominates for photoexcitation at 369.8 eV is related to high KER processes. This is also evident in the KERD for 369.8 eV in the lower half of Fig. 5. Feature ‘2’ is present following photoexcitation at 400.7 eV and is associated with low kinetic energy release. At 401.0 eV feature ‘2’ is observed to dominate in the Dalitz plot. Again, these trends are clearly observable in the KERDs of Fig. 5.
 | ||
| Fig. 6 Dalitz plots for the 3-body fragmentation H+ + NH+ + H measured after photoexcitation at (a) 369.8 eV (b) 400.7 eV (c) 401.0 eV. | ||
As the excitation photon energy is detuned across the 4a1 resonance, we excite to different parts of the core-excited state PES and different types of nuclear motion influence the experimental data that we observe. It is clear that a number of different fragmentation processes contribute to the three-body data presented here. The Low KER processes become increasingly dominant as the excitation photon energy is increased (cf. KERDs in Fig. 5: lower panel and Dalitz plots in Fig. 6). Photoexcitation at 401 eV results in excitation to the unbound, steep part of the 4a1 PES (arrow ‘b’ in Fig. 1: inset). In this case ultrafast bond elongation and even ultrafast dissociation is possible. The signature features observed in the KER-filtered Dalitz plots in Fig. 5(a) and (b) provide evidence for both ultrafast bond elongation and dissociation. The increase in intensity of these features when the excitation photon energy is detuned to higher values (compare Fig. 6(b) and (c)) also provides firm evidence for the occurrence of ultra-fast dissociation in this fragmentation channel. Clearly the three-body data strongly supports the extensive picture proposed in Section 4.1 in which ultrafast bond elongation was interpreted to occur at higher excitation photon energies. In the case where bond elongation occurs before Auger decay, a different part of the dication (or trication) PES will be reached at somewhat longer internuclear N–H distances than if Auger decay occurs from the bound part of the 4a1 PES. This will also influence the measured KERs.
5 Conclusions
The nuclear dynamics induced following core-electron excitation to the N1s−14a11 state of the ammonia molecule have been investigated. The kinematics of the two-body fragmentation channel, H+/NH2+ and the 3-body fragmentation channel, H+/NH+/H have been analysed. In both cases our experimental data provides evidence of complex nuclear motion in the core-excited state.In the case of the H+/NH2+ 2-body fragmentation channel we report indirect observation of geometrical distortion of the molecule via the evolution of the fragment ion anisotropy as the core-excited state PES is probed by detuning the excitation photon energy across the N1s−1 → 4a1 resonance. Three types of nuclear motion contribute to the photon energy dependent angular anisotropy observed for this pathway.
Based on our analysis we assert that detuning the photon energy results in excitation to different parts of the core-excited state PES. Excitation to a bound part of the N1s−14a11 PES means that the molecule spends a longer time in the core-excited state before Auger decay occurs. The dominant nuclear motion that is initiated as a result of this core excitation involves a relaxation of the molecule towards a more planar geometry. The extent of relaxation achieved by the molecule depends on the time delay before Auger decay. In addition, vibrational motion also has time to occur and we see some experimental evidence to suggest the occurrence of such a motion in our data. Indeed, vibrational motion has previously been discussed for this core-excited state of ammonia.21
In contrast, core-excitation using photon energies >400.9 eV results in excitation to a steep unbound part of the PES. The scattering duration time is also significantly reduced at these detuned photon energies. The molecule has less time to undergo geometrical relaxation to a planar geometry and hence remains in a more pyramidal arrangement. No vibrational motion is possible. However, depending on the scattering duration time and the dissociation time of the molecule, ultrafast bond elongation may occur before Auger decay.9 Our calculations indicate that the molecule will respond to such an asymmetric bond elongation by reduction of its bond angles and this is observed in our H+/NH2+ data as a closing of the out-of-plane angle, θ.
The 3-body fragmentation channel contains evidence for the enhancement of an asynchronous bond extension as well as a weak signal from ultrafast dissociation following core electron excitation on and above the resonance maximum. The observation of such nuclear motion at higher photon energies is in agreement with the observation of a bond elongation at higher excitation photon energies in the two-body data and strongly supports the conclusions made in Section 4.1.
Acknowledgements
We gratefully acknowledge assistance from the MAX IV Laboratory staff, in particular Maxim Tchaplyguine. Funding for this work was granted by the Swedish Research Council (VR). A. Sankari would also like to acknowledge financial support from the Academy of Finland.References
- R. Feifel and M. N. Piancastelli, J. Electron Spectrosc. Relat. Phenom., 2011, 183, 10 CrossRef CAS PubMed.
- Handbook of High-resolution Spectroscopy, ed. M. Quack and F. Merkt, Wiley Publishing, Florida, 2011, pp. 1655–1690 Search PubMed.
- O. Björneholm, S. Sundin, S. Svensson, R. R. T. Marinho, A. Naves de Brito, F. Kh. Gel'mukhanov and H. Ågren, Phys. Rev. Lett., 1997, 79, 3150 CrossRef.
- D. Céolin, C. Miron, M. Simon and P. Morin, J. Electron Spectrosc. Relat. Phenom., 2004, 141, 171 CrossRef PubMed.
- K. Ueda and J. H. D. Eland, J. Phys. B: At., Mol. Opt. Phys., 2005, 38, S839 CrossRef CAS.
- J. Laksman, D. Céolin, M. Gisselbrecht, S. E. Canton and S. L. Sorensen, J. Chem. Phys., 2009, 131, 244305 CrossRef CAS PubMed.
- U. Ekström, V. Carravetta, M. Alagia, M. Lavollee, R. Richter, C. Bolcato and S. Stranges, J. Chem. Phys., 2008, 128, 044302 CrossRef PubMed.
- M. Simon, C. Miron, N. Leclercq, P. Morin, K. Ueda, Y. Sato, S. Tanaka and Y. Kayanuma, Phys. Rev. Lett., 1997, 79, 3857 CrossRef CAS.
- I. Hjelte, M. N. Piancastelli, C. M. Jansson, K. Wiesner, O. Björneholm, M. Bässler, S. L. Sorensen and S. Svensson, Chem. Phys. Lett., 2003, 370, 781 CrossRef CAS.
- J. Laksman, E. P. Månsson, A. Sankari, D. Céolin, M. Gisselbrecht and S. L. Sorensen, Phys. Chem. Chem. Phys., 2013, 15, 19322 RSC.
- K. Ueda, A. de Fanis, N. Saito, M. Machida, K. Kubozuka, H. Chiba, Y. Muramatu, Y. Sato, A. Czasch, O. Jaguzki, R. Dörner, A. Cassimi, M. Kitajima, T. Furuta, H. Tanaka, S. L. Sorensen, K. Okada, S. Tanimoto, K. Ikejiri, Y. Tamenori, H. Ohashi and I. Koyano, Chem. Phys., 2003, 289, 135 CrossRef CAS.
- P. Morin and C. Miron, J. Electron Spectrosc. Relat. Phenom., 2012, 185, 259 CrossRef CAS PubMed.
- P. Morin and I. Nenner, Phys. Rev. Lett., 1986, 56, 1913 CrossRef CAS.
- H. Aksela, S. Aksela, M. Ala-Korpela, O.-P. Sairanen, M. Hotokka, G. M. Bancroft, K. H. Tan and J. Tulkki, Phys. Rev. A: At., Mol., Opt. Phys., 1990, 41, 6000 CrossRef CAS.
- A. Menzel, B. Langer, J. Viefhaus, S. B. Whitfield and U. Becker, Chem. Phys. Lett., 1996, 258, 265 CrossRef CAS.
- S. J. Schaphorst, C. D. Caldwell, M. O. Krause and J. Jimenez-Mier, Chem. Phys. Lett., 1993, 213, 315 CrossRef CAS.
- C. D. Caldwell, S. J. Schaphorst, M. O. Krause and J. Jimenez-Mier, J. Electron Spectrosc. Relat. Phenom., 1994, 67, 243 CrossRef CAS.
- A. Naves de Brito, Al. Naves de Brito, O. Björneholm, J. S. Neto, A. B. Machado, S. Svensson, A. Ausmees, S. J. Osborne, L. J. Sæthre, H. Aksela, O.-P. Sairanen, A. Kivimäki, E. Nõmmiste and S. Aksela, THEOCHEM, 1997, 394, 135 CrossRef CAS.
- P. Sałek, V. Carravetta, F. Kh. Gel'mukhanov, H. Ågren, B. Schimmelpfennig, M. N. Piancastelli, S. L. Sorensen, R. Feifel, I. Hjelte, M. Bässler, S. Svensson, O. Björneholm and A. Naves de Brito, Chem. Phys. Lett., 2001, 343, 332 CrossRef.
- I. Hjelte, M. N. Piancastelli, R. F. Fink, O. Björneholm, M. Bässler, R. Feifel, A. Giertz, H. Wang, K. Wiesner, A. Ausmees, C. Miron, S. L. Sorensen and S. Svensson, Chem. Phys. Lett., 2001, 334, 151 CrossRef CAS.
- Y. Senba, T. Goya, H. Yoshida and A. Hiraya, J. Electron Spectrosc. Relat. Phenom., 2005, 144, 195 CrossRef PubMed.
- J. H. D. Eland, F. S. Wort and R. N. Royds, J. Electron Spectrosc. Relat. Phenom., 1986, 41, 297 CrossRef CAS.
- J. H. D. Eland and A. H. Pearson, Meas. Sci. Technol., 1990, 1, 36 CrossRef CAS.
- K. Ueda, E. Shigemasa, Y. Sato, A. Yagishita, T. Sasaki and T. Hayaishi, Rev. Sci. Instrum., 1989, 60, 2193 CrossRef CAS PubMed.
- J. H. D. Eland, M. Tashiro, P. Linusson, M. Ehara, K. Ueda and R. Feifel, Phys. Rev. Lett., 2010, 105, 213005 CrossRef CAS.
- J. Laksman, D. Céolin, M. Gisselbrecht and S. L. Sorensen, J. Chem. Phys., 2010, 133, 144314 CrossRef CAS PubMed.
- J. Laksman, E. P. Månsson, C. Grunewald, A. Sankari, M. Gisselbrecht, D. Céolin and S. L. Sorensen, J. Chem. Phys., 2012, 136, 104303 CrossRef CAS PubMed.
- G. Herzberg, Molecular Spectra and Molecular Structure, Krieger Publishing, Florida, 1966, vol. III, p. 609 Search PubMed.
- J. Schirmer, A. B. Trofimov, K. J. Randall, J. Feldhaus, A. M. Bradshaw, Y. Ma, C. T. Chen and F. Sette, Phys. Rev. A: At., Mol., Opt. Phys., 1993, 47, 1136 CrossRef CAS.
- A.-F. Niu, Y. Zhang, W.-H. Zhang and J.-M. Li, Phys. Rev. A: At., Mol., Opt. Phys., 1998, 57, 1912 CrossRef CAS.
- A. Jürgensen and R. G. Cavell, Chem. Phys., 2001, 273, 77 CrossRef.
- A. Lindgren, M. Gisselbrecht, F. Burmeister, A. Naves de Brito, A. Kivimäki and S. L. Sorensen, J. Chem. Phys., 2005, 122, 114306 CrossRef PubMed.
- R. W. Shaw, J. S. Jen and T. D. Thomas, J. Electron Spectrosc. Relat. Phenom., 1977, 11, 91 CrossRef CAS.
- M. Bässler, A. Ausmees, M. Jurvansuu, R. Feifel, J.-O. Forsell, P. de TarsoFonseca, A. Kivimäki, S. Sundin, S. L. Sorensen, R. Nyholm, O. Björneholm, S. Aksela and S. Svensson, Nucl. Instrum. Methods Phys. Res., Sect. A, 2001, 469, 382 CrossRef.
- J. Laksman, D. Céolin, E. P. Månsson, S. L. Sorensen and M. Gisselbrecht, Rev. Sci. Instrum., 2013, 84, 123113 CrossRef CAS PubMed.
- L. Journel, R. Guillemin, A. Haouas, P. Lablanquie, F. Penent, J. Palaudoux, L. Andric, M. Simon, D. Céolin, T. Kaneyasu, J. Viefhaus, M. Braune, W. B. Li, C. Elkharrat, F. Catoire, J.-C. Houver and D. Dowek, Phys. Rev. A: At., Mol., Opt. Phys., 2008, 77, 042710 CrossRef.
- R. N. Zare, Mol. Photochem., 1972, 4, 1 CAS.
- R. M. Wood, Q. Zheng, A. K. Edwards and M. A. Mangan, Rev. Sci. Instrum., 1997, 68, 1382 CrossRef CAS PubMed.
- N. Kosugi, J. Electron Spectrosc. Relat. Phenom., 1996, 79, 351 CrossRef CAS.
- J. D. Bozek, N. Saito and I. H. Suzuki, Phys. Rev. A: At., Mol., Opt. Phys., 1995, 51, 4563 CrossRef CAS.
- T. Gejo, Y. Takata, T. Hatsui, M. Nagasono, H. Oji, N. Kosugi and E. Shigemasa, Chem. Phys., 2003, 289, 15 CrossRef CAS.
- F. Aquilante, L. de Vico, N. Ferré, G. Ghigo, P.-Å. Malmqvist, P. Neogrády, T. B. Pedersen, M. Pito
![[n with combining breve]](https://www.rsc.org/images/entities/char_006e_0306.gif) ák, M. Reiher, B. O. Roos, L. Serrano-Andrés, M. Urban, V. Veryazov and R. Lindh, J. Comput. Chem., 2010, 31, 224 CrossRef CAS PubMed.
ák, M. Reiher, B. O. Roos, L. Serrano-Andrés, M. Urban, V. Veryazov and R. Lindh, J. Comput. Chem., 2010, 31, 224 CrossRef CAS PubMed. - D. Winkoun and G. Dujardin, Z. Phys. D: At., Mol. Clusters, 1986, 4, 57 CrossRef CAS.
- R. K. Boyd, S. Singh and J. H. Beynon, Chem. Phys., 1985, 100, 297 CrossRef CAS.
- J. H. D. Eland, F. S. Wort, P. Lablanquie and I. Nenner, Z. Phys. D: At., Mol. Clusters, 1986, 4, 31 CrossRef CAS.
- M. Stankiewicz, P. A. Hatherly, L. J. Frasinski, K. Codling and D. M. P. Holland, J. Phys. B: At., Mol. Opt. Phys., 1989, 22, 21 CrossRef CAS.
- C. I. Ma, D. M. Hanson, K. Lee and R. G. Hayes, J. Electron Spectrosc. Relat. Phenom., 1995, 75, 83 CrossRef CAS.
- A. Baev, P. Sałek, F. Kh. Gel'mukhanov, H. Ågren, A. Naves de Brito, O. Björneholm and S. Svensson, Chem. Phys., 2003, 289, 51 CrossRef CAS.
- M. N. Piancastelli, G. Goldsztejn, T. Marchenkol, R. Guillemin, R. K. Kushawaha, L. Journel, S. Carniato, J.-P. Rueff, D. Céolin and M. Simon, J. Phys. B: At., Mol. Opt. Phys., 2014, 47, 124031 CrossRef.
- R. H. Dalitz, Philos. Mag., 1953, 44, 1068 CrossRef CAS PubMed.
- N. Neumann, D. Hant, L. Ph. H. Schmidt, J. Titze, T. Jahnke, A. Czasch, M. S. Schöffler, K. Kreidi, O. Jagutzki, H. Schmidt-Böcking and R. Dörner, Phys. Rev. Lett., 2010, 104, 103201 CrossRef CAS.
- N. Neumann, A. Czasch, D. Hant, O. Jagutzki, T. Jahnke, H.-K. Kim, K. Kreidi, L. Ph. H. Schmidt, M. S. Schöffler, J. Titze, B. Ullrich, R. Wallauer, H. Schmidt-Böcking and R. Dörner, J. Phys.: Conf. Ser., 2009, 194, 102025 CrossRef.
| This journal is © the Owner Societies 2015 |