 Open Access Article
Creative Commons Attribution 3.0 Unported Licence
Phosphine and phosphine oxide groups in metal–organic frameworks detected by P K-edge XAS†
F. L.
Morel
a,
S.
Pin‡
b,
T.
Huthwelker
b,
M.
Ranocchiari
*b and
J. A.
van Bokhoven
*ab
aDepartment of Chemistry and Applied Biosciences, ETH Zürich, Vladimir-Prelog-Weg 1, 8093 Zürich, Switzerland. E-mail: j.a.vanbokhoven@chem.ethz.ch; Tel: +41 44 632 5542
bLaboratory for Catalysis and Sustainable Chemistry, Paul Scherrer Institut, 5232 Villigen, Switzerland. E-mail: marco.ranocchiari@psi.ch; Tel: +41 56 310 5843
First published on 19th December 2014
Abstract
Phosphine metal–organic frameworks (P-MOFs) are crystalline porous coordination polymers that contain phosphorus functional groups within their pores. We present the use of X-ray absorption spectroscopy (XAS) at the P K-edge to determine the phosphine to phosphine oxide ratio in two P-MOFs with MIL-101 topology. The phosphorus oxidation state is of particular interest as it strongly influences the coordination affinity of these materials for transition metals. This method can determine the oxidation state of phosphorus even when the material contains paramagnetic nuclei, differently from NMR spectroscopy. We observed that phosphine in LSK-15 accounts for 72 ± 4% of the total phosphorus groups and that LSK-12 contains only phosphine oxide.
Introduction
Metal–organic frameworks (MOFs) are nanoporous coordination polymers, which are formed by the combination of organic building blocks with inorganic clusters. These materials are very popular thanks to their potential in gas adsorption technologies,1 biomedical applications,2,3 and catalysis.4–6 Research on MOFs is often oriented toward development of structures bearing pendant functional groups that can be modified post-synthetically to provide novel catalytic materials.7 Organophosphine moieties were recently introduced to yield crystalline phosphine MOFs (P-MOFs).8–12 Incorporation of phosphine functional groups inside structures with new and existing topologies is achieved using direct solvothermal synthesis, post-synthetic modification13 or the co-crystallization of organic linkers with similar connectivity,14 We and other groups foresee new applications for such materials in transition metal immobilization and catalysis.9,15X-ray absorption spectroscopies (XAS), such as X-ray absorption near-edge structure (XANES) and extended X-ray absorption fine structure (EXAFS), are widely used techniques for characterization of solid catalysts.16 XAS applied to MOFs provides useful structural insights and can be used in parallel with X-ray diffraction (XRD), infrared (IR), nuclear magnetic resonance (NMR) spectroscopy, and neutron diffraction.17 Many studies were conducted to specifically elucidate the local environment of the MOF inorganic unit. Prestipino et al. performed a comparative XANES and EXAFS study at the Cu K-edge on the solvated and dehydrated forms of HKUST-1 to determine the change in local Cu2+ coordination.18 Valenzano et al. detected local deformations in the desolvated UiO-66 structure using EXAFS at the Zr K-edge, complimented by ab initio calculations.19 XAS can be used to probe the interaction of unsaturated inorganic units with guest molecules, for instance Cr3(1,3,5-benzenetricarboxylate)2 (ref. 20) and Ni-CPO-27![[thin space (1/6-em)]](https://www.rsc.org/images/entities/char_2009.gif) 21 presented unique spectroscopic features upon sorption with different gases. Finally, XAS is used to characterize catalytically active metallic species located inside a MOF. Fischer et al. observed Cu and ZnO nanoparticles loaded into MOF-5
21 presented unique spectroscopic features upon sorption with different gases. Finally, XAS is used to characterize catalytically active metallic species located inside a MOF. Fischer et al. observed Cu and ZnO nanoparticles loaded into MOF-5![[thin space (1/6-em)]](https://www.rsc.org/images/entities/char_2009.gif) 22 and our group previously used XAS at the Au L3-edge to characterize gold complexes immobilized in the phosphine-functionalized LSK-1.15
22 and our group previously used XAS at the Au L3-edge to characterize gold complexes immobilized in the phosphine-functionalized LSK-1.15
The hard X-ray edges of XAS are generally used to probe metal nuclei in MOFs, while characterization of low Z elements is carried out by standard spectroscopic techniques, and often only after digestion of samples. The oxidation state of the phosphorus atom in P-MOFs has an important effect on the binding affinity for transition metals, which makes it critical to identify and quantify the different phosphorus species present in the framework. XRD cannot distinguish between uncoordinated phosphine and phosphine oxide, because phosphine oxidation has a negligible effect on the framework structure, therefore requiring use of an element-specific method, such as 31P NMR spectroscopy and XAS at the P K-edge. IR spectroscopy can be used to identify the P![[double bond, length as m-dash]](https://www.rsc.org/images/entities/char_e001.gif) O stretching bands in phosphine oxide with relative ease, but there is no characteristic and isolated bond stretching in organophosphines that would allow their identification by this technique. NMR spectroscopy is a very powerful characterization method,23 but may not be suitable when paramagnetic centers such as Fe(III) or Cr(III) are contained in the inorganic unit, which is the case for MOFs such as MIL-101(Cr)24 and MIL-100(Fe).25
O stretching bands in phosphine oxide with relative ease, but there is no characteristic and isolated bond stretching in organophosphines that would allow their identification by this technique. NMR spectroscopy is a very powerful characterization method,23 but may not be suitable when paramagnetic centers such as Fe(III) or Cr(III) are contained in the inorganic unit, which is the case for MOFs such as MIL-101(Cr)24 and MIL-100(Fe).25
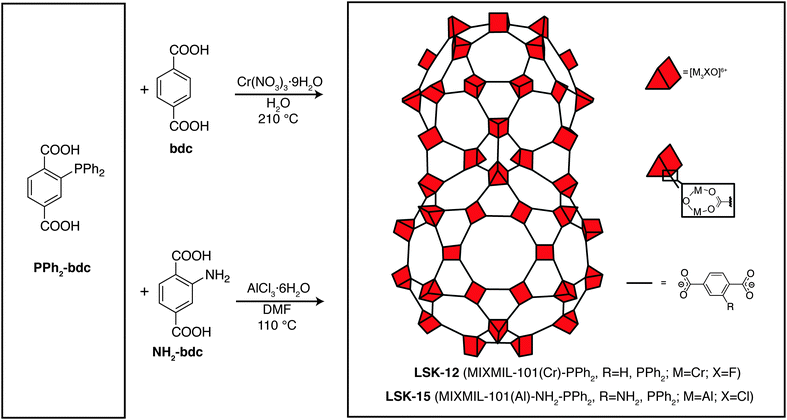
Here we show that XAS at the P K-edge can provide the oxidation state and local coordination of the phosphorus atom in P-MOFs. We present characterization data for two P-MOFs with MIL-101 topology,24 namely MIXMIL-101(Cr)-PPh2 (LSK-12) and MIXMIL-101(Al)-NH2-PPh2 (LSK-15). These two P-MOFs are synthesized in conventional solvothermal conditions using 2-diphenylphosphinoterephthalic acid (PPh2-bdc, Fig. 1). Solvothermal synthesis procedures usually require dissolution of the organic precursors at relatively high temperature over a period of 1–3 days, which can be detrimental to phosphine stability, as it is well-known that phosphine oxidation can occur at moderate temperature in the presence of trace amounts of oxygen. Accurate characterization of the phosphorus functional groups is therefore important for determining the material’s properties, particularly towards metal complexation.
Experimental
MOF synthesis and characterization
Organophosphorus linkers 2-diphenylphosphorylterephthalic acid (POPh2-bdc) and PPh2-bdc, as well as MIXMIL-101(Cr)-PPh2 (LSK-12) and MIXMIL-101(Al)-NH2-PPh2 (LSK-15) were prepared according to literature procedures.12 Powder XRD patterns were recorded at 298 K on a PANanalytical Empyrean diffractometer operated at 45 kV and 40 mA with CuKα (λ = 1.541 Å) radiation. Measurements were carried out over a 2θ scan range from 2° to 70° with a step size of 0.033° and a counting time of 100 s. Nitrogen adsorption isotherms were recorded on a Micromeritics Tristar II 3020 at 77 K. Brunauer–Emmett–Teller (BET) surface areas were calculated in the 0.05 to 0.3 (p/p0) relative pressure range. The total pore volume was determined at a p/p0 of 0.95. Magic-angle spinning (MAS) 31P NMR spectra were recorded on a Brucker AVANCE AMX-400 spectrometer at 10 kHz spinning speed using a 2.5 mm zirconium oxide rotor. Spectra were calibrated to an external NH4H2PO4 reference and chemical shifts are reported relative to 85% H3PO4. MOF samples were digested using a mixture of DCl, D2O and d6-dimethylsulfoxide, degassed thoroughly using standard Schlenk techniques prior to analysis by 1H NMR spectroscopy, carried on a Brucker AVANCE 1500 spectrometer.X-ray absorption spectroscopy
Fluorescence X-ray absorption spectra were collected at the PHOENIX beamline (Swiss Light Source, Villigen PSI) at the P K-edge at ∼2145 eV using a detector with four silicon drift diodes (Vortex, USA). The PHOENIX beamline is designed for micro spectroscopy over the soft X-ray energy range (0.8–8 keV). The optical design of the beamline closely follows the concepts of the former LUCIA beamline, which was located at the SLS, and has now moved to the synchrotron facility Soleil (Yvette, France).26 The light source of the beamline is an undulator and monochromatic light is generated by a double crystal monochromator using a set of two Si 111 crystals. To remove high harmonic contribution from the light, the beam is reflected by a set of two planar mirrors, where the reflection angle is set to reflect only photons with energies below 6 keV. The detector was mounted at 90° with respect to the incoming beam. The detector distance was selected so that the electronic dead time remained below 20% during the experiment to avoid spectral distortion. A dead time correction was applied to the raw data during the data post-processing.Samples were used without dilution and pressed to pellets to provide the maximum contrast at the P K-edge. The samples were stored under inert atmosphere during preparation and transport of the pellets to the vacuum chamber. The samples were irradiated using an unfocused beam with an approximate 1 × 2 mm2 beam size, moderated so as to reduce the flux density on the sample and prevent radiation damage. Radiation damage effects were ruled out as no spectral changes were observed after repeated radiation of the samples. The incoming photon flux (I0) was determined using the total electron yield signal taken from a 0.5 μm thin polyester foil coated with a 50 nm Ni thin film located upstream in a vacuum chamber, which is held at a pressure of about 10−7 mbar.
XANES and EXAFS analysis
Over-absorption corrections were performed using the self-absorption correction algorithm provided by Haskel,27 as implemented into the ATHENA software package.28 Spectra were processed by subtracting the smooth pre-edge background fitted with a straight line from the measured data. Each spectrum was then normalized to unity 400 eV above the absorption edge, where the EXAFS oscillations were no longer visible. When required, the XANES spectra were analyzed using the linear combination fitting (LCF) procedure implemented in ATHENA.28 The LCF was carried out in the energy range from 115 eV below the absorption edge to 160 eV above. The relative weights of the two organic linkers (PPh2-bdc and POPh2-bdc) in each sample were varied between zero and one while the absorption edge energies were fixed. The scaling factor obtained from LCF represents the fraction of each standard species in the unknown sample.Results and discussion
The quantification of the different phosphorus sites inside the materials by LCF requires the use of external phosphorus references. For this, we used the two organic linkers PPh2-bdc and POPh2-bdc to ensure a close relation of the spectral features between the references and the MOFs. XANES and EXAFS spectra at the P K-edge were recorded to identify characteristic features of P(III) and P(V) oxidation states. The results were then used to quantify the two phosphorus environments present inside the P-MOFs.Characterization of the organic linkers
PPh2-bdc and its phosphine oxide equivalent POPh2-bdc were analyzed by conventional spectroscopic methods to ascertain their purity and verify their respective spectral features. 31P NMR chemical shifts were recorded at δ −5.6 and 28.6 ppm for PPh2-bdc and POPh2-bdc, respectively,12 confirming their similarity to triphenylphosphine and triphenylphosphine oxide.29,30 In the case of PPh2-bdc, the presence of its oxidized form was also observed by NMR spectroscopy, in a small quantity (∼5%). IR spectra were measured to qualitatively discriminate the level of oxidation in the bulk material (Fig. S1, ESI†). Tertiary arylphosphine oxides typically display a strong P![[double bond, length as m-dash]](https://www.rsc.org/images/entities/char_e001.gif) O stretching band in the 1320–1140 cm−1 region. In the case of POPh2-bdc a broad band at 1173 cm−1 was observed alongside C
O stretching band in the 1320–1140 cm−1 region. In the case of POPh2-bdc a broad band at 1173 cm−1 was observed alongside C![[double bond, length as m-dash]](https://www.rsc.org/images/entities/char_e001.gif) O and C–O stretching bands at 1702 and 1257 cm−1, respectively. No P
O and C–O stretching bands at 1702 and 1257 cm−1, respectively. No P![[double bond, length as m-dash]](https://www.rsc.org/images/entities/char_e001.gif) O bands were observed in the PPh2-bdc sample. P–C stretching bands were difficult to assign due to their weak signal intensities, which overlap with the aromatic ring bands.
O bands were observed in the PPh2-bdc sample. P–C stretching bands were difficult to assign due to their weak signal intensities, which overlap with the aromatic ring bands.
MOF synthesis and conventional solid-state characterization
The powder XRD pattern (Fig. 2, left) and the nitrogen physisorption properties of LSK-15 (Table S1, ESI†) are comparable to those of MIL-101(Al)-NH2.31 Spectra (1H NMR) of digested samples revealed that LSK-15 has a phosphorus to amino (NH2) ratio of 1![[thin space (1/6-em)]](https://www.rsc.org/images/entities/char_2009.gif) :
:![[thin space (1/6-em)]](https://www.rsc.org/images/entities/char_2009.gif) 7.3. NMR spectra of digested samples could not be used to estimate the P/P
7.3. NMR spectra of digested samples could not be used to estimate the P/P![[double bond, length as m-dash]](https://www.rsc.org/images/entities/char_e001.gif) O ratio under the conditions described due to phosphine oxidation. A 31P MAS NMR spectrum was recorded (Fig. 2, right) to identify the phosphorus oxidation state in the solid phase. Signals observed at −10 (A1) and −6 (A2) ppm were attributed to two non-equivalent phosphine positions of the phosphine inside the framework.12 A signal pertaining to oxidized phosphine was observed at 35 ppm (B) and is consistent with values reported for triarylphosphine oxides.32 A phosphine fraction of 85% was calculated relative to the peak areas of the combined A1 and A2 positions against that for B.
O ratio under the conditions described due to phosphine oxidation. A 31P MAS NMR spectrum was recorded (Fig. 2, right) to identify the phosphorus oxidation state in the solid phase. Signals observed at −10 (A1) and −6 (A2) ppm were attributed to two non-equivalent phosphine positions of the phosphine inside the framework.12 A signal pertaining to oxidized phosphine was observed at 35 ppm (B) and is consistent with values reported for triarylphosphine oxides.32 A phosphine fraction of 85% was calculated relative to the peak areas of the combined A1 and A2 positions against that for B.
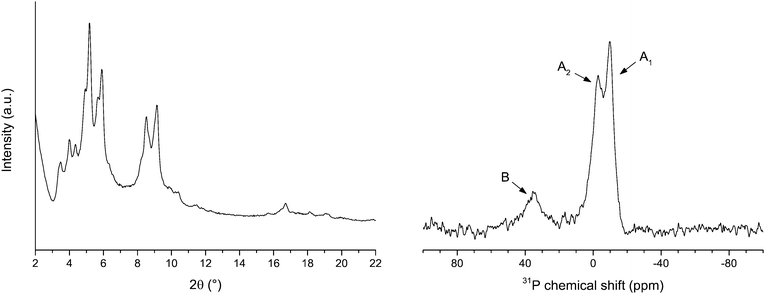 | ||
| Fig. 2 Powder XRD pattern (left) and 31P MAS NMR spectra (right) of LSK-15. NMR signals are labelled according to phosphorus oxidation state: A1 (−10 ppm) and A2 (−6 ppm) for phosphine and B (35 ppm) for phosphine oxide. Adapted from ref. 12. Copyright 2014 American Chemical Society. | ||
LSK-12 is a phosphorus-functionalized MIXMOF of MIL-101(Cr) synthesized from terephthalic acid and PPh2-bdc in an aqueous solution of tetramethylammonium hydroxide. Unlike its aluminum equivalent, MIL-101(Cr) is synthesized using harsher thermal conditions (usually around 200–210 °C).33 The powder XRD pattern of LSK-12 (see Fig. S3, ESI†) indicated a structure consistent with MIL-101(Cr) topology. Nitrogen physisorption experiments also confirmed the porous nature of the material (Table S1, ESI†). As for LSK-15, the characterization of the phosphorus sites in LSK-12 was attempted in the solid state. However, the presence of Cr(III) paramagnetic centers, combined with the low concentration of the organophosphine linkers in the bulk material, complicated the characterization by NMR spectroscopy, which did not yield any observable signal. Liquid chromatography was attempted on the digested sample, but we were only able to observe the organophosphine linker in its oxidized form (see ESI†), as per LSK-15. An infrared spectrum was also recorded and compared to the PPh2-bdc and POPh2-bdc organic linkers (Fig. S2, ESI†). However, due to the low phosphorus content of the bulk material and strong framework contribution to the IR spectrum, we were not able to confirm the presence of PPh2-bdc using IR spectroscopy.
X-ray absorption spectroscopy
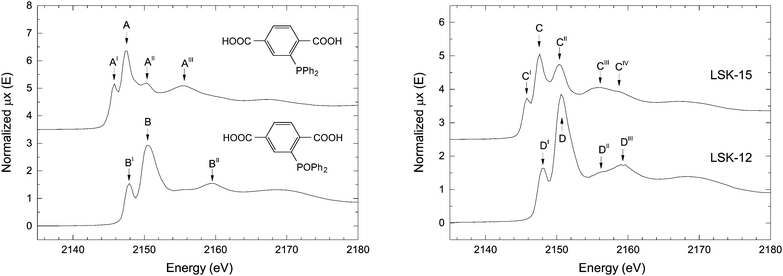 | ||
| Fig. 3 P K-edge XANES spectra of the organic linkers PPh2-bdc and POPh2-bdc (left) and P-MOFs (right). | ||
We recorded the XANES spectra of LSK-15 and LSK-12 (Fig. 3 and Table 1). The spectrum belonging to LSK-15 is characterized by five different absorption features (Fig. 3, features C to CIV), which strongly support the presence of multiple phosphorus oxidation states. As for PPh2-bdc, LSK-15 displayed features related to the white lines of triarylphosphine (C) and triarylphosphine oxide (CII) at 2145.7 and 2150.2 eV, respectively. The relative intensity of CII to C ratio is higher in LSK-15 than in the corresponding AII to A ratio in the organic linker PPh2-bdc, providing proof of phosphorus oxidation inside this MOF. Pre-edge feature CI is attributed to the characteristic resonance of phosphine environment in PPh2-bdc. The XANES spectrum of LSK-12 (Fig. 3D to DIII) displays fewer features than LSK-15. Comparison based solely on the absorption edge positions of the two organic linkers (Fig. 3A and B) is difficult due to a perceived overlap between A and BI, which could both be contributors to the DI feature. However, the absence of the corresponding AI pre-edge feature in LSK-12, and to a lesser extent the small edge shift between C and DI, are indicative of phosphine oxide as the primary phosphorus species in LSK-12. The relative intensities of the white line D and the pre-edge feature DI also compare well with the POPh2-bdc organic linker. A shift in post-edge features of the two MOFs is consistent with our observations concerning PPh2-bdc and POPh2-bdc.
| Compound | Feature | Energy (eV) |
|---|---|---|
| PPh2-bdc | A | 2147.3 |
| AI | 2145.7 | |
| AII | 2150.3 | |
| AIII | 2155.4 | |
| POPh2-bdc | B | 2150.6 |
| BI | 2147.9 | |
| BII | 2159.6 | |
| LSK-15 | C | 2147.6 |
| CI | 2145.7 | |
| CII | 2150.2 | |
| CIII | 2156.0 | |
| CIV | 2158.6 | |
| LSK-12 | D | 2150.6 |
| DI | 2147.9 | |
| DII | 2156.2 | |
| DIII | 2159.3 |
Quantification of the phosphine content using XANES
LSK-15 provides the opportunity to evaluate the accuracy of the quantification of the phosphine content by XAS at the P K-edge. The mild thermal conditions employed during synthesis promote formation of the MIL-101 topology, leaving the majority of phosphine functional groups unoxidized. Diamagnetic Al(III) centers are compatible with MAS NMR spectroscopy, which enables us to compare the two techniques. XANES is particularly sensitive to the oxidation state of the phosphorus, as shown by the spectra of phosphine and phosphine oxide (Fig. 3). We used the LCF procedure in ATHENA to compute the percentage of phosphine groups based on the deconvoluted spectrum (Fig. 5). The scaling factors obtained revealed that phosphine groups account for 72 ± 1.5% the total phosphorus sites. A more realistic value of 72 ± 4% was determined taking into account experimental errors, such as the presence of phosphine oxide inside the phosphine reference compound. This is in fair agreement with the 31P MAS NMR measurement (85%).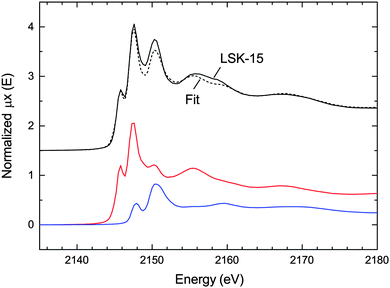 | ||
| Fig. 5 P K-edge XANES spectrum of LSK-15 (black) with the linear fit (dashed line) and the two weighted contributions of PPh2-bdc (red) and POPh2-bdc (blue). | ||
We encountered a noticeable difference in the sensitivity of the two characterization methods towards the phosphine environment, despite a similar result in the phosphine content. The 31P MAS-NMR spectrum revealed that two non-equivalent phosphine sites are present in the framework (Fig. 2A1 and A2). In the case of the XANES spectrum, these two sites cannot be discriminated using PPh2-bdc and POPh2-bdc as references, which strongly suggest that these sites arise from topological differences rather than a different phosphorus oxidation state or coordination with aluminum nuclei. This illustrates how a combination of NMR and X-ray absorption spectroscopy can be a versatile method for the detection of phosphorus sites inside a MOF without inducing phosphine oxidation.
In the case of LSK-12, which is incompatible with 31P MAS NMR spectroscopy due to paramagnetic Cr(III) centers, XANES can be used to characterize phosphorus functional groups in the solid state. Quantification of the occupancy of different phosphorus sites inside LKS-12 was easier than in LSK-15, because the absence of pre-edge features related to phosphine functional groups strongly implies that total oxidation of phosphine sites inside the material has occurred. A modification of the phosphorus environment by beam damage can be ruled out as we did not observe any alteration in the spectra of the organic linkers, nor the P-MOFs after repeated irradiation of the samples. Equivalent characterization methods allow meaningful comparisons to be made between the impact of the respective synthesis conditions for LSK-12 and LSK-15. The level of oxidation in the two materials can be rationalized by the use of different thermal conditions during synthesis.
Conclusions
Using XAS at the P K-edge, we were able to access the structure of the functional group in two MOFs containing phosphorus functionalization. We recorded the spectral features of the organic linker PPh2-bdc, as well as its oxidized counterpart POPh2-bdc and were able to show that phosphine groups represent 72 ± 4% of the total phosphorus in LSK-15. In the case of LSK-12, the XAS analysis revealed the exclusive presence of phosphine oxide within the framework, an observation that could not be achieved by means of NMR spectroscopy due to the presence of Cr(III)-based inorganic unit.Acknowledgements
The authors thank Dr Kim Meyer for proofreading the manuscript. This research has been supported by ETH Zürich (ETHIIRA proposal ETH-33 11-1).Notes and references
- J.-R. Li, R. J. Kuppler and H.-C. Zhou, Chem. Soc. Rev., 2009, 38, 1477–1504 RSC.
- P. Horcajada, R. Gref, T. Baati, P. K. Allan, G. Maurin, P. Couvreur, G. Férey, R. E. Morris and C. Serre, Chem. Rev., 2012, 112, 1232–1268 CrossRef CAS PubMed.
- S. Keskin and S. Kizilel, Ind. Eng. Chem. Res., 2011, 50, 1799–1812 CrossRef CAS.
- A. Corma, H. García and F. X. Llabrés i Xamena, Chem. Rev., 2010, 110, 4606–4655 CrossRef CAS PubMed.
- M. Ranocchiari and J. A. van Bokhoven, Phys. Chem. Chem. Phys., 2011, 13, 6388–6396 RSC.
- M. Yoon, R. Srirambalaji and K. Kim, Chem. Rev., 2012, 112, 1196–1231 CrossRef CAS PubMed.
- S. M. Cohen, Chem. Rev., 2012, 112, 970–1000 CrossRef CAS PubMed.
- S. M. Humphrey, P. K. Allan, S. E. Oungoulian, M. S. Ironside and E. R. Wise, Dalton Trans., 2009, 2298–2305 RSC.
- A. J. Nuñez, L. N. Shear, N. Dahal, I. A. Ibarra, J. Yoon, Y. K. Hwang, J.-S. Chang and S. M. Humphrey, Chem. Commun., 2011, 47, 11855–11857 RSC.
- X. Tan, L. Li, J. Zhang, X. Han, L. Jiang, F. Li and C. Su, Chem. Mater., 2012, 24, 480–485 CrossRef CAS.
- J. M. Falkowski, T. Sawano, T. Zhang, G. Tsun, Y. Chen, J. V Lockard and W. Lin, J. Am. Chem. Soc., 2014, 136, 5213–5216 CrossRef CAS PubMed.
- F. L. Morel, M. Ranocchiari and J. A. van Bokhoven, Ind. Eng. Chem. Res., 2014, 53, 9120–9127 CrossRef CAS.
- M. G. Goesten, K. B. Sai Sankar Gupta, E. V. Ramos-Fernandez, H. Khajavi, J. Gascon and F. Kapteijn, CrystEngComm, 2012, 14, 4109–4111 RSC.
- M. Ranocchiari and J. A. van Bokhoven, Chimia, 2013, 67, 397–402 CrossRef CAS PubMed.
- J. Václavík, M. Servalli, C. Lothschütz, J. Szlachetko, M. Ranocchiari and J. A. van Bokhoven, ChemCatChem, 2013, 5, 692–696 CrossRef.
- S. Bordiga, E. Groppo, G. Agostini, J. A. van Bokhoven and C. Lamberti, Chem. Rev., 2013, 113, 1736–1850 CrossRef CAS PubMed.
- S. Bordiga, F. Bonino, K. P. Lillerud and C. Lamberti, Chem. Soc. Rev., 2010, 39, 4885–4927 RSC.
- C. Prestipino, L. Regli, J. G. Vitillo, F. Bonino, A. Damin, C. Lamberti, A. Zecchina, P. L. Solari, K. O. Kongshaug and S. Bordiga, Chem. Mater., 2006, 18, 1337–1346 CrossRef CAS.
- L. Valenzano, B. Civalleri, S. Chavan, S. Bordiga, M. H. Nilsen, S. Jakobsen, K. P. Lillerud and C. Lamberti, Chem. Mater., 2011, 23, 1700–1718 CrossRef CAS.
- L. J. Murray, M. Dinca, J. Yano, S. Chavan, S. Bordiga, C. M. Brown and J. R. Long, J. Am. Chem. Soc., 2010, 132, 7856–7857 CrossRef CAS PubMed.
- F. Bonino, S. Chavan, J. G. Vitillo, E. Groppo, G. Agostini, C. Lamberti, P. D. C. Dietzel, C. Prestipino and S. Bordiga, Chem. Mater., 2008, 20, 4957–4968 CrossRef CAS.
- M. Müller, S. Hermes, K. Kähler, M. W. E. van den Berg, M. Muhler and R. A. Fischer, Chem. Mater., 2008, 20, 4576–4587 CrossRef.
- F. A. Bovey, Nuclear magnetic resonance spectroscopy, Academic Press Inc. (London) Ltd, San Diego, 2nd edn, 1988 Search PubMed.
- G. Férey, C. Mellot-Draznieks, C. Serre, F. Millange, J. Dutour, S. Surblé and I. Margiolaki, Science, 2005, 309, 2040–2042 CrossRef PubMed.
- P. Horcajada, S. Surblé, C. Serre, D.-Y. Hong, Y.-K. Seo, J.-S. Chang, J.-M. Grenèche, I. Margiolaki and G. Férey, Chem. Commun., 2007, 100, 2820–2822 RSC.
- A.-M. Flank, G. Cauchon, P. Lagarde, S. Bac, M. Janousch, R. Wetter, J.-M. Dubuisson, M. Idir, F. Langlois, T. Moreno and D. Vantelon, Nucl. Instrum. Methods Phys. Res., Sect. B, 2006, 246, 269–274 CrossRef CAS PubMed.
- D. Haskel, FLUO webpage, http://www.aps.anl.gov/%E2%88%BChaskel/fluo.html, accessed November 05, 2014.
- B. Ravel and M. Newville, J. Synchrotron Radiat., 2005, 12, 537–541 CrossRef CAS PubMed.
- G. A. Gray, J. Am. Chem. Soc., 1973, 95, 7736–7742 CrossRef CAS.
- S. O. Grim and W. McFarlane, Nature, 1965, 208, 995–996 CrossRef CAS.
- P. Serra-Crespo, E. V. Ramos-Fernandez, J. Gascon and F. Kapteijn, Chem. Mater., 2011, 23, 2565–2572 CrossRef CAS.
- J. A. Davies, S. Dutremez and A. A. Pinkerton, Inorg. Chem., 1991, 30, 2380–2387 CrossRef CAS.
- S. Wang, L. Bromberg, H. Schreuder-Gibson and T. A. Hatton, ACS Appl. Mater. Interfaces, 2013, 5, 1269–1278 CAS.
- C. Engemann, R. Franke, J. Hormes, C. Lauterbach, E. Hartmann, J. Clade and M. Jansen, Chem. Phys., 1999, 243, 61–75 CrossRef CAS.
Footnotes |
| † Electronic supplementary information (ESI) available: Infrared spectroscopy, nitrogen physisorption experiments and additional characterization of the materials. See DOI: 10.1039/c4cp05151c |
| ‡ Present address: Brembo S.p.a., Advanced R&D, Viale Europa 2, 24041 Stezzano (BG), Italy. |
| This journal is © the Owner Societies 2015 |

