
Structures and optical properties of two phases of SrMgF4†
Alexander P.
Yelisseyev
a,
Xingxing
Jiang
bc,
Ludmila I.
Isaenko
ad,
Lei
Kang
bc,
Lei
Bai
b,
Zheshuai
Lin
*b,
Alina A.
Goloshumova
a,
Sergei I.
Lobanov
a and
Dmitry Y.
Naumov
e
aInstitute of Geology and Mineralogy, Siberian Branch of the Russian Academy of Sciences, 3 Ac. Koptyug ave, Novosibirsk 630090, Russia
bBCCRD, Key Laboratory of Functional Crystals and Laser Technology, Technical Institute of Physics and Chemistry, Chinese Academy of Sciences, Beijing 100190, China. E-mail: zslin@mail.ipc.ac.cn
cUniversity of Chinese Academy of Sciences, Beijing 100049, China
dNovosibirsk State University, 2 Pirogova str., 630090, Novosibirsk, Russia
eInstitute of Inorganic Chemistry, Siberian Branch of the Russian Academy of Sciences, 3 Ac. Lavrentyev ave, Novosibirsk 630090, Russia
First published on 4th November 2014
Abstract
SrMgF4 has an extremely large bandgap Eg of 12.50 eV as obtained from reflection dispersion. The symmetry of this crystal is monoclinic P21 at room temperature and transforms to the orthorhombic Cmc21 phase near 478 K as the temperature increases. The acentric character of the low-temperature (LT) phase is confirmed by pyroelectric luminescence at T < 440 K. The fundamental absorption edge of the LT phase is located at 122 nm (10.15 eV). A considerable difference between the absorption edge and bandgap Eg is due to the strong exciton absorption. The first-principles electronic structure, refractive indices, nonlinear susceptibility and polarizability were calculated for both LT and high-temperature (HT) phases. Band-to-band transitions are direct for the LT phase but indirect for HT. In spite of relatively low birefringence (∼0.017) and nonlinear susceptibility (∼0.044 pm V−1, an order lower than that in KDP), SrMgF4 crystals are considered promising for nonlinear optics thanks to their transparency far in the vacuum ultraviolet spectral region.
Introduction
The tetrafluoride of Sr and Mg (SrMgF4, SMF) was synthesized for the first time 30 years ago.1,2 Banks et al.1 identified SrMgF4 as orthorhombic. A negative test for the second harmonic generation led them to suggest the space group Cmcm with a = 3.917(2), b = 14.451(8) and c = 5.637(2).1 It was surprising because all crystals in the isostructural BaMF4 (M = Mg, Mn, Fe, Co, Ni, Zn) family belong to a pyroelectric symmetry class Cmc21. Some of the BaMF4 compounds were observed to undergo phase transitions of different natures.3–5 These materials are unique for optical applications in the vacuum ultraviolet (VUV) to mid-IR spectral range because of the combination of nonlinear optical (NLO) properties in a wide transparency range from 125 nm to 13 μm3; birefringent effects and quasi-phase-matching were demonstrated in BaMgF4.3 Later detailed X-ray structural studies on SMF established its monoclinic symmetry P1121 at low temperature with parameter a doubling and c tripling6 compared with the orthorhombic Cmcm previously reported in the literature.1A possible existence of the structural phase transition in the SMF crystal was discussed.2,6,7 The presence of local mirror planes in the superstructure of Sr atoms at low temperature allows one to suppose the existence of the high-temperature phase.6 This possibility was also suggested taking into account the thermal abnormality of SMF near 1082 K in differential thermal analysis data,1 whereas its melting temperature is about 1153 K. On the basis of X-ray structural data,6 Abrahams et al. showed that this crystal meets the structural criteria of ferroelectricity.7 They predicted the value of spontaneous polarization at room temperature (Ps ≈ 11 × 10−2 C m−2), which is typical of 2D ferroelectrics, and phase transition to the paraelectric state near Tc = 450 K with the symmetry change: P21 (Z = 12) ↔ P21/m (Z = 12).7 Recent polarization-optical observations and preliminary X-ray structural studies in the 90–1200 K range for the SrMgF4 crystal revealed a non-intrinsic ferroelastic phase transition with P1121 (Z = 12) ↔ Cmc21 (Z = 4),8 and both phases remain pyroelectric, in contrast to the results by Abrahams.7 In addition, the SMF reflection and photoluminescence were studied in detail using the synchrotron radiation9 and its energy band gap was estimated to be Eg = 12.50 eV. To date there are no experimental data concerning the fundamental absorption edge of SrMgF4, as well as its electronic structure and nonlinear susceptibility.
In the present work the sizable SMF single crystals were obtained (Fig. 1), and the structures of both low-temperature (LT) and high-temperature (HT) phases were determined. The pyroelectric luminescence measurements confirmed that the LT phase is noncentrosymmetric. The transmission spectrum of the LT phase of SMF was recorded and the absorption edge was found to be 122 nm (10.15 eV). Its red-shift in comparison with Eg = 12.50 eV (ref. 9) is a result of strong excitonic absorption. The electronic structures, refractive indices, nonlinear susceptibility and polarizability were calculated by first-principles theory for both LT and HT phases.
 | ||
| Fig. 1 Single crystal SrMgF4 sample, 2 mm thick. | ||
Results and discussion
In this work the structures of both LT and HT phases for SMF were accurately determined for the first time.Structures of LT and HT SMF phases
 | ||
| Fig. 2 The structure of SrMgF4: low-temperature (a) and high-temperature (b) phases. Green spheres are Sr ions located among the MgF6 polyhedra. Different colors of MgF6 octahedra in section (a) shows that they are turned each other and are crystallographically nonequivalent. | ||
 | ||
| Fig. 3 The coordination of Sr ions in LT and HT SrMgF4 structures. | ||
| Symmetry information for the LT phase: (i) 1 − x, y − 1/2, −z; (ii) x, y, z − 1; (iii) 1 − x, y − 1/2, 1 − z; (iv) x, y, z + 1; (v) x − 1, y, z; (vi) 1 − x, y + 1/2, −z; (vii) 1 − x, y + 1/2, 1 − z; (viii) 1 + x, y, z. Symmetry information for the HT phase: (i) −x + 1/2, −y + 1/2, z − 1/2; (ii) x − 1, y, z; (iii) x − 1, y, z − 1; (iv) x, y, z − 1; (v) −x + 1, −y + 1, z − 1/2; (vi) −x, −y + 1, z − 1/2; (vii) x + 1, y, z; (viii) −x + 1, −y + 1, z + 1/2; (ix) x + 1, y, z + 1; (x) x, y, z + 1; (xi) −x + 1/2, −y + 1/2, z + 1/2; (xii) x, −y + 1, z + 1/2. | |
|---|---|
| LT phase | |
| Sr1–F5 | 2.376(3) |
| Sr1–F24(i) | 2.439(3) |
| Sr1–F3 | 2.456(3) |
| Sr1–F10 | 2.481(3) |
| Sr1–F16 | 2.482(3) |
| Sr1–F11(ii) | 2.524(3) |
| Sr1–F8 | 2.654(3) |
| Sr2–F5 | 2.440(3) |
| Sr2–F4 | 2.455(2) |
| Sr2–F10 | 2.457(3) |
| Sr2–F24(iii) | 2.523(3) |
| Sr2–F11 | 2.536(3) |
| Sr2–F13 | 2.606(2) |
| Sr2–F12 | 2.623(2) |
| Sr3–F9 | 2.454(3) |
| Sr3–F10 | 2.462(3) |
| Sr3–F8 | 2.484(3) |
| Sr3–F22 | 2.532(3) |
| Sr3–F18 | 2.545(3) |
| Sr3–F19 | 2.577(2) |
| Sr3–F14 | 2.647(3) |
| Sr3–F20 | 2.655(2) |
| Sr3–F15 | 2.663(3) |
| Sr4–F9 | 2.485(3) |
| Sr4–F11 | 2.503(2) |
| Sr4–F18(iv) | 2.508(3) |
| Sr4–F8(iv) | 2.531(3) |
| Sr4–F19 | 2.548(3) |
| Sr4–F15 | 2.738(2) |
| Sr4–F14(iv) | 2.742(3) |
| Sr4–F23 | 2.780(3) |
| Sr4–F7 | 2.951(3) |
| Sr4–F17(v) | 3.187(3) |
| Sr5–F21(ii) | 2.386(3) |
| Sr5–F18 | 2.462(3) |
| Sr5–F20 | 2.489(3) |
| Sr5–F3(vi) | 2.534(3) |
| Sr5–F4(vii) | 2.562(3) |
| Sr5–F7(vii) | 2.569(3) |
| Sr5–F2(vii) | 2.607(2) |
| Sr5–F24 | 2.665(3) |
| Sr5–F4(vii) | 2.562(2) |
| Sr5–F7(vii) | 2.569(3) |
| Sr5–F1(vi) | 2.691(2) |
| Sr6–F21 | 2.421(3) |
| Sr6–F3(vii) | 2.495(3) |
| Sr6–F20 | 2.497(3) |
| Sr6–F4(vii) | 2.538(3) |
| Sr6–F19 | 2.568(3) |
| Sr6–F6(vii) | 2.716(3) |
| Sr6–F17 | 2.757(3) |
| Sr6–F2(vii) | 2.758(3) |
| Sr6–F23(viii) | 2.844(2) |
| Sr6–F1 (vii) | 2.896(3) |
| HT phase | |
| Sr(1)–F(3)(i) | 2.462(8) |
| Sr(1)–F(1) | 2.478(7) |
| Sr(1)–F(1)(ii) | 2.478(7) |
| Sr(1)–F(3)(iii) | 2.526(6) |
| Sr(1)–F(3)(iv) | 2.526(6) |
| Sr(1)–F(4)(iv) | 2.669(11) |
| Sr(1)–F(2)(v) | 2.760(5) |
| Sr(1)–F(2)(vi) | 2.760(5) |
| Sr(1)–F(1)(i) | 2.941(7) |
Pyroelectric luminescence (PEL)
SMF crystals demonstrate a spontaneous emission in the 80–440 K range as the sample temperature changes (both upon cooling and heating) on the sample at rate β = dT/dt about 20 K min−1 (Fig. 4). Such emission is typical only for pyroelectrics and is interpreted as a result of the modification in atomic polarization on the crystal surface or in its volume due to the change in temperature.10 The strength of the pyroelectric field can reach tens of kV. It is interesting that both onset temperatures at which PEL disappears (upon heating) and appears (upon cooling) are close to that of LT ↔ HT phase transition in SMF. The occurrence of PEL in SMF indicates that there is no symmetry center at T < 440 K which agrees with the results of structural analysis. Since the HT phase remains noncentrosymmetric, the absence of PEL at T > 478 K in SMF is supposed to be the result of much smaller pyroelectric coefficient γ above this temperature. | ||
| Fig. 4 Spontaneous emission (PEL) in SMF crystals upon heating (a) and cooling (b). Heating/cooling rate β is about 20 K min−1. | ||
We have also observed the PEL effect in typical NLO crystals such as LiIO3, β-BaB2O4 (BBO), LiB3O5 (LBO), Ag3AsS3, LiNbO3, LiGaS2, and KTP.11 Main features of their PEL spectra are listed as follows:10
(1) The PEL intensity decreases as the size of pyroelectric crystals decreases. PEL disappears completely when the crystal size becomes smaller than 1 mm. Charge Q on the opposite faces of the pyroelectric crystal is proportional to the sample volume (∼R3), whereas the distance between these faces is proportional to the sample diameter (R). As a result intensity E of the pyroelectric field is roughly proportional to R2 and falls quickly in line with the electric breakdown probability as R decreases. The other reason may be the leakage of the charge along the defect states in the near-surface layer: its efficiency also increases as the sample becomes smaller.
(2) The intensity and frequency of PEL pulses depend considerably on the rate of temperature increase/decrease β. Both intensity and frequency decrease as β falls.
(3) PEL is most intense in the temperature ranges with maximal values of pyroelectric coefficient γ. Thus, in LiIO3 near 140 K the pyroelectric coefficient is γ = 5 × 10⁻⁵ coulomb m−2 K−1, which is 5 times higher than that at room temperature.11 Indeed, PEL is observed at low temperatures but it disappears at T > 200 K. Special measurements showed that PEL also takes place near 570 K in LiIO3 which corresponds to a sharp γ maximum in the α → β phase transition.
(4) PEL weakens to be completely disappear near room temperature in the Li-containing crystals as the increase of Li+ ionic conductivity suppresses the generation of the pyroelectric field.
(5) Shining with X-rays and photoexcitation upon heating/cooling or at low temperature before heating can heavily suppress PEL: the temperature range where PEL takes place becomes narrower and PEL disappears completely.
Optical transmission
The transmission spectrum of the LT phase of SrMgF4, recorded at 300 K using three different spectrometers, is given in Fig. 5; it covers all the transparency range from VUV to mid-IR. One can see in the inset that a shortwave edge of fundamental absorption is located at 122 nm (hν = 10.15 eV) at the 0 transmission level and there are no noticeable spectroscopic features on the long-wave edge at 11.8 μm. Taking into account that the Raman spectrum of SMF covers the 100–450 cm−1 range on the wave number scale, we suppose that the IR limit is due to the two-phonon absorption. Unfortunately, there are several slightly pronounced shoulders in the VUV region. Additional absorption bands near the fundamental absorption edge are more pronounced in the inset with the extended scale. The UV absorption spectrum can be decomposed into 4 components, as shown in Fig. 6. We separated four Gaussian components with maximums at 6.3, 7.65, 9.1 and 10.05 eV, which have the full widths at the half-maximum FWHM = 1.8, 1.2, 1.4 and 0.72 eV, respectively: these bands are likely to be attributed to the electronic transitions in some point defects such as vacancies or cation antisite defects. Taking into account the ionic radii of cations (0.86 A and 1.27 A for Mg2+ and Sr2+ in the fluorine environment,12 respectively), it is expected that the dominant antisite defects are small Mg ions occupied at the large Sr sites (MgSr). We suppose that the SMF transparency will be improved if the concentration of corresponding defects decreases. For crystals of multicomponent compounds this happens usually when crystal composition is close to the stoichiometric one.13 A rapid increase of absorption is observed only at hν >10 eV. | ||
| Fig. 5 Transmission spectrum in the VUV to near IR spectral range for a low-temperature MSF phase at T = 300 K, d = 1.2 mm. In the inset: detail in the shortwave range for SMG plates 0.5 mm and 1.2 mm thick: curves 2 and 3, respectively. Curve 4 shows the transmission spectrum of a 1 mm thick SMF plate, reconstructed from the reflection spectrum supposing only excitonic absorption near the fundamental absorption edge, without any features related to defects. | ||
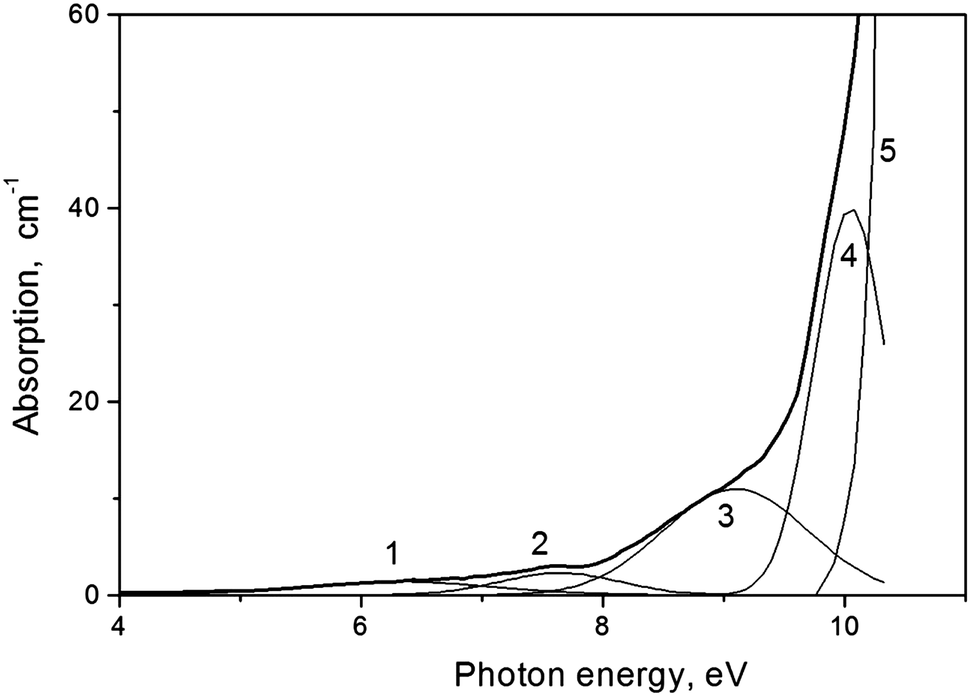 | ||
| Fig. 6 Decomposition of the room-temperature absorption spectrum for LT-SMF near the fundamental absorption edge: there are 4 gaussians centered at 6.3, 7.65, 9.1 and 10.05 eV (curves 1–4) whereas (5) shows an intense edge absorption. | ||
Photo- and X-ray-excited luminescence
An intense luminescence with photon energies in the range from 1 to 6 eV is observed in photoluminescence (PL) spectra. Typical PL spectra at 10.6, 10.9 and 3.8 eV excitations are shown by curves 1–3 in Fig. 7a in comparison with the spectrum of X-ray excited luminescence (XL, curve 4). The photoluminescence excitation (PLE) spectra of 3.1 and 4.8 eV emissions are given in Fig. 7b. PL spectra 1–2 and PLE spectra 5–6, recorded for the LT phase of SMF at 10 K using the synchrotron radiation, are taken from ref. 9. PLE spectra demonstrate intense relatively narrow bands in the 10–11.5 eV range and a weaker band near 11.8 eV. Such spectra are typical of excitonic excitations in the wide-gap dielectrics BaMgF4,14 SrF2,15 and MgF2.16 Narrow PLE bands are somewhat shifted to low energies in comparison with the excitonic peak in reflection and absorption spectra: the latter has maximum near 11.4 eV in the spectrum (7). The profile of the dominating 10.7 eV PLE band is caused by two competitive processes. The low-energy slope of this band is determined by an absorption/excitation increase whereas the high-energy negative slope is due to surface energy losses. The intensity of the excitonic absorption peak is high (about 106 cm−1) and just absorption in its low energy wing determines the fundamental absorption edge. The transmission spectrum calculated for a 1 mm thick SMF plate taking into account only exciton absorption, with the zero absorption of point defects, is shown as curve 4 in Fig. 5. Thus, the calculated absorption edge was predicted to be 10.5 eV (ref. 9) which is close to the experimental 10.15 eV value in the present paper. The difference between these values can be partly explained by temperature effect: transmission was measured at room temperature, whereas reflection spectra have been recorded at T = 10 K in ref. 9. The experimental absorption edge is expected to shift about 0.2 eV to lower the sample temperature and the agreement would be better. PLE and calculated absorption spectra of SMF agree well at an assumption concerning the surface losses of energy and the diffusion of electronic excitations (EE) in SMF, the length of EE diffusion being 70 nm.9 PL emission in the 3.5–4.6 eV range (the 3.7 and 4.2 eV bands) is excited in the exciton band at 10.7 eV with a shoulder near 11.0 eV (components C and D in terms of ref. 9). PL in the 5.0 eV band is excited in the 10.5 eV band (B-component). Taking into account that both these PL emissions are excited only in the exciton bands near the absorption edge and the Stokes shift for them is large (about 6.5 eV), they may be related to self-trapped excitons.17 As follows from the spectrum (3) in Fig. 7a, the low-energy PL in the 2–3.5 eV range (bands at 2.45, 2.67 and 2.0 eV) can be excited effectively by the 3.8 eV light from the SMF transparency range as well as in the 6.0 eV band.9 The main part of these emissions is also excited by the X-rays: in this case hot charge carriers thermalize with further EE transfer both to excitons and point defects (see (4) in Fig. 7a). The low-energy PL emissions can be associated with radiative recombination in some non-identified point defects: they may be color centers based on anion vacancies, structural defects in cation sublattices as well as impurity defects. The variety of features in the PL and PLE spectra may be due to different nonequivalent positions for each ion (6, 6 and 24 for strontium, magnesium and fluorine ions, respectively, in the MgSrF4 structure). Such crystallographically nonequivalent positions differ in coordination number, bond length, and in the intensity of the crystal field. | ||
| Fig. 7 (a) PL spectra of the LT phase of SrMgF4 at 10.6 eV (1), 10.8 eV (2) and 3.8 eV (3) excitations. The XL spectrum is given for comparison (4). (b) PLE spectra for 3.6 eV and 5.0 eV emissions are shown by (5) and (6) curves, respectively. Spectra 1–2, 5–6 are taken from ref. 10. The absorption spectrum (7) was reconstructed from the reflection spectrum in ref. 10. Spectra (1–2, 5–6) were recorded at 10 K, whereas spectra (3, 4) were obtained at 300 K. The arrow shows the band gap Eg = 12.5 eV in SMF. | ||
The presence of intense excitonic bands near the absorption edge makes the analysis of the edge shape and the exact determination of the Eg values from optical transmission difficult. SMF crystals belong to the SrF2–MgF2 system. Binary components of this system crystallize in the cubic fluorite (SrF2) and tetragonal rutile (MgF2) structures.2 Although the SMF structure is formally different from those of SrF2 and MgF2, its electronic structure should inherit some features of the binary compounds. In terms of the SMF structure, the main translational motive in SMF is a continuous network of MgF2 octahedra. A comparison of optical constants for SrF2, MgF2 and MgSrF4 shows that values for the latter are between the parameters for binary compounds. Indeed, the Eg values for E∥c and E⊥c polarizations in MgF2 are 12.8 and 13.4 eV, respectively, whereas for the SrF2 band gap it is about 1 eV narrower: 11.25 and 11.44 eV, according to different authors.9 Excitonic absorption peaks are located at 10.6 and 12.1 eV for SrF2 and MgF2, respectively, in comparison with Eg = 11.4 eV in SMF. The high energy edge of the fundamental absorption is considerably shifted to lower energies: 9.5 and 11 eV for SrF2 and MgF2,9 respectively, whereas for SMF it is 10.15 eV. A considerable difference between the absorption edge and Eg takes place also in the NLO crystal BBO:9 the absorption edge is located near 6.2 eV and the band gap of the direct Γ–Γ transition is 7.5 eV: their difference is due to intense excitonic absorption in the boron–oxygen group as well as due to the charge transfer transitions O–Ba.18,19
First-principles results
Based on the obtained structural data (ESI†), the electronic structures were calculated for LT and HT phases of SMF. The density of states (DOS) and partial density of states (PDOS) projected on atom species are plotted in Fig. 8a and b, and show the very similar electronic characteristics in both phases. The Sr 4s and 4p orbitals are located at −29 eV and −12 eV, respectively, while the F 2s orbitals are located at −20 eV. All electrons originally on the Mg 3s and Sr 5s shells are almost lost and move into the F 2p shell, which dominantly occupy the top of the valence band. All orbitals are quite localized and there is a very weak hybridization indicating that the chemical bonds between the constituent atoms are almost ionic rather than covalent. | ||
| Fig. 8 DOS and PDOS projected on constitutional species of atoms in (a) LT phase and (b) HT phase of SrMgF4 (unit: electrons/eV). The vertical dashed lines indicate the valence band maximum. | ||
The electronic band structures of low-T and high-T phases along the lines of high symmetry points in the Brillouin zone of MgSrF4 are shown in Fig. 9a and b, respectively. The density of states in the LT phase is much higher than that in the HT phase since Z = 12 for the former and Z = 4 for the latter. One can see that direct electronic transitions in the Γ point are responsible for the fundamental absorption edge for the LT phase, but there are indirect Σ → Γ transitions for the HT phase and the direct gap at the Γ point is about 0.09 eV larger than the indirect one. The calculated bandgap energies of the LT and HT phases are 6.64 eV and 6.74 eV, respectively. The discrepancy between calculated and experimental values is due to the notorious bandgap prediction problem by density functional theory. However, the relative magnitude of bandgap energies can be determined from the DFT values of a similar system. Thus, it is predicted that the LT and HT phases actually have close bandgap energies.
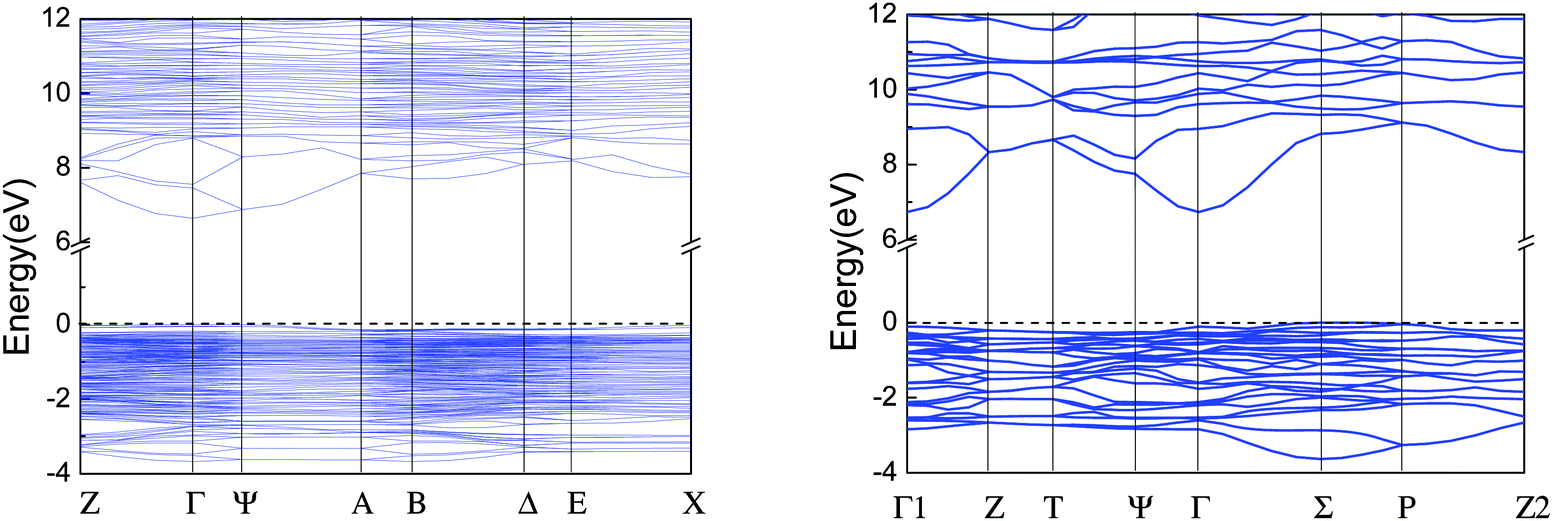 | ||
| Fig. 9 Comparison of the electronic band structure along the lines of high symmetry points in the Brillouin zone for (a) LT phase and (b) HT phase of SrMgF4. | ||
In order to elucidate the difference of pyroelectric behaviors in the LT and HT phases of SMF, the response of the materials to an applied electric field, i.e., the polarizabilities, were calculated. The matrices of polarizability tensors for the dynamic (optical, ω = ∞) and static (ω = 0) electric fields are listed in Table 2. Clearly, both dynamic and static polarizabilities are considerably (6 to 12 times) larger for the LT phase of SMF. Our calculated results are consistent with the fact that the LT phase is less ordered in comparison with HT: this originates from the larger distortion of the Mg position from the gravity center of the MgF6 octahedron in the former phase. This conclusion agrees with the predictions of Abrahams7 concerning relatively high spontaneous polarization (∼10 μC m−2) for SMF at room temperature as well. More importantly, this result also confirms that the PEL phenomenon in SMF is much more evident at low temperatures (Fig. 3) since larger pyroelectricity is often accompanied by larger polarizability.20 Consequently, it is of great importance to measure polarization experimentally and confirm ferroelectric properties of SMF. If SMF is related to ferroelectrics it is possible to change the direction of the spontaneous polarization vector using an external electric field and realize the quasi-phase matching (QPM) regime as in the case of potassium titanyl phosphate KiTiOPO4 (KTP) or lithium niobate LiNbO3 (LN).21
| Dynamic (optical) polarizability (ω → ∞) | Static polarizability (ω = 0) | ||||
|---|---|---|---|---|---|
| LT MgSrF4 | |||||
| 86.58 | 0.00 | 0.01 | 960.79 | 0.00 | 61.67 |
| 0.00 | 90.18 | 0.00 | 0.00 | 672.11 | 0.00 |
| 0.01 | 0.00 | 91.10 | 61.67 | 0.00 | 473.58 |
| HT MgSrF4 | |||||
| 15.31 | 0.00 | 0.00 | 75.65 | 0.00 | 0.00 |
| 0.00 | 14.36 | 0.00 | 0.00 | 174.71 | 0.00 |
| 0.00 | 0.00 | 14.98 | 0.00 | 0.00 | 82.29 |
Table 3 lists the calculated values of refractive indices ni and birefringence Δn, at 523 and 1064 nm as well as the static SHG coefficient in SMF. For both phases the refractive indices vary in the 1.42–1.44 range and birefringence is 0.016–0.018. The previous Kramers–Krönig transform analysis gave 1.4464, 1.621 and 1.632 for MgF2, SrF215 and SrMgF49 at 7.87 eV. Since ni decreases in line with photon energy, our calculated values are consistent with these results. Moreover, the calculated Δn values agree well with the available experimental data.8 The Δn values for SMF are 2.5–3 times smaller in comparison with the widely-known NLO crystals for the VUV-UV-visible range (see Table S1 in the ESI†). The maximum components of SHG coefficients dij are 0.044 pm V−1 for LT, 2 times higher than that for HT (0.021 pm V−1). However, even this value is very small; it is an order lower than that of KDP and about 2 orders lower than that of BBO (Table S1, ESI†). Nevertheless, SMF may be promising for VUV NLO applications thanks to its transparency down to 122 nm (or Eg ∼ 10.15 eV), shorter than those in almost all known commercial NLO crystals used in VUV (see Table S1, ESI†).
| LT phase | HT phase | ||||
|---|---|---|---|---|---|
| hν = 1.165 eV (λ = 1064 nm) | 2.33 eV (532 nm) | 1.165 eV (1064 nm) | 2.33 eV (532 nm) | ||
| Linear optical properties | n x | 1.4278 | 1.4330 | 1.4409 | 1.4422 |
| n y | 1.4408 | 1.4463 | 1.4231 | 1.4281 | |
| n z | 1.4438 | 1.4493 | 1.4366 | 1.4465 | |
| Δn | 0.0160 | 0.0163 | 0.0178 | 0.0184 | |
| SHG coefficients (pm V−1) | d 21 = 0.022 | d 31 = −0.021 | |||
| d 22 = 0.044 | d 32 = −0.009 | ||||
| d 33 = −0.078 | |||||
To date BaMgF4 is the most studied among the SMF relatives. It has the same Cmc21 structure as that of HT SMF; small Δn ∼ 0.02 and dij (0.015 to 0.039 pm V−1) values. BMF is transparent in the 0.125–13 μm range and is ferroelectric in the 4 kV cm−1 coercive field, and its QPM was realized for SHG.3,4 For the LT phase of SMF calculated nonlinearity is slightly larger and the transparency range is slightly wider in VUV compared with BaMgF4, so the studies of QPM on SMF are of great importance.
Conclusions
We have obtained the sizable SrMgF4 single crystals and determined the structures of LT and HT phases. Intense pyroelectric luminescence at T < 440 K confirms the absence of a symmetry center for the LT phase. The transmission spectrum of the LT phase of SMF was recorded and the shortwave fundamental absorption edge was established at 122 nm (10.15 eV). Its considerable shift in comparison with the bandgap value (12.5 eV) is explained by strong excitonic absorption.The electronic structure was calculated for LT and HT phases of SMF, and two types of band-to-band transitions were established: direct Γ → Γ for LT and indirect, Σ → Γ, for HT. Energy band gap values for these SMF phases were found close to each other.
Main optical parameters for SMF were calculated: refractive indices, birefringence, and nonlinear susceptibility. The LT phase has higher nonlinear susceptibility, but it is still 1 and 2 orders lower than that in KDP and BBO, respectively. Several times higher polarizability of the low-symmetry LT phase allows one to explain why pyroelectric luminescence is observed only for this phase in SMF crystals.
Experimental and computational details
Crystal growth
The SrMgF4 synthesis was carried out from the mixture of fluorides SrF2 and MgF2 at 1670 K temperature in the presence of the fluoride agent (CF4). To remove oxygen-containing impurities the starting chemicals were annealed under the dynamic vacuum for 24 h at 770 K. A glass–graphite crucible with a conic bottom was filled with the synthesized substance and placed into a hermetically sealed silica ampoule evacuated at 10−1 Pa pressure. Crystals were grown using the Bridgman technique in a two-zone furnace at 1470 K and 970 K temperatures in different zones. The rate of the ampoule sinking was about 1 mm per day, whereas the temperature gradient in the growth area was 10–20 K cm−1. Crystals were cooled in the regime of the switched-off furnace. The obtained transparent colorless crystals of about 1 cm3 in volume (Fig. 1) were obtained after annealing under vacuum for a day.Crystal structure
Pure and optically transparent single crystals of 0.19 × 0.13 × 0.11 mm3 in size were used for the X-ray structural study. Investigation was carried out on a Bruker APEX DUO diffractometer (MoKα-radiation, graphite monochromator, CCD detector) in the 2.41–28.28° angle θ range {Bruker AXS Inc. (2004), APEX (Version 1.08), SAINT (Version 7.03) and SADABS (Version 2.11) Bruker Advanced X-Ray Solutions. – Madison, Wisconsin, USA}. All structural determinations were carried out using software SHELX.22,23 For crystal structure analyses we used the Xshell program.24,25 The graphics visualization of the structures was performed via the BS program (Balls & Sticks ver. 1.42 by Sung J. Kang & Tadashi C. Ozawa). The SMF structure was studied at room temperature and at 550 K. The sample was heated by a directed hot air flow. As a result we confirmed that there are two different phases below and above the phase transition at 478 K.8Spectroscopic studies
Transmission spectra were recorded using a UV-2501PC Shimadzu spectrometer in UV-to-near IR, whereas in mid-IR we used a Fourier-Transform spectrometer Infralum FT-801. The VUV transmittance spectrum was recorded using a McPherson Vacuum UV Analytical Spectrophotometer VUVAS 2000 spectrometer. The photoluminescence (PL) spectra were recorded using a LabRam microRaman spectrometer at 325 nm excitation from a He–Cd laser. X-ray excited luminescence (XL) was recorded using a MDR2 diffraction monochromator with photomultipliers FEU100 and cooled FEU83 as emission detectors; a table 1 kW X-ray set-up was used for excitation. Pyroluminescence (PLE) was recorded as a spontaneous emission from the pyroelectric crystal both upon its heating or cooling at a rate of about 20 K min−1 in the temperature range from 100 K to 550 K: we used a FEU100 photomultiplier.First-principles computational methods
The first-principles calculations were performed using CASTEP,26 a plane wave pseudopotential total energy package based on density functional theory (DFT).27 The exchange–correlation functional developed by Ceperley, Alder,28 Perdew and Zunger29 (CA-PZ) in the local density approximation (LDA)30 form was adopted. The optimized norm-conserving pseudopotential31 in the Kleinman–Bylander32 form allows us to use a relatively small basis set without compromising the computational accuracy, and the Sr 4s24p65s2, Mg 3s2 and F 2s22p5 are treated as the valence electrons. A kinetic energy cutoff of 900 eV and the Monkhorst–Pack33k point mesh of 7 × 7 × 4 and 3 × 1 × 3 were chosen for HT and LT phases, respectively. Our tests showed that the computational parameters above are accurate enough for the present purpose.Based on the electronic structures, the optical refractive indices and SHG coefficients for the LT and HT SMF crystals were determined from the virtual electronic transitions between the valence and conduction bands.34,35 The polarizabilities in the LT and HT SMF crystals were obtained by the linear response method in the density-functional perturbation theory,36 in which the polarizability is calculated through computing the second derivative of the total energy with respect to a given perturbation in ionic positions.
Acknowledgements
This work was partly supported by the Ministry of Education and Science of the Russian Federation, the NSF of China (Grants 11174297 and 11474292), China “973” project (Grant 2011CB922204), and the Special Foundation of the Director of Technical Institute of Physics and Chemistry, CAS.References
- E. Banks, S. Nakajama and M. Shone, New Complex Fluorides EuMgF4, SmMgF4, SrMgF4, and Their Solid Solutions: Photoluminescence and Energy Transfer, J. Electrochem. Soc., 1980, 127, 2234–2239 CrossRef CAS PubMed.
- O. Bingyi and E. Banks, Binary System SrF2-MgF2: Phase Diagram and Study of Growth of SrMgF4, Mater. Res. Bull., 1982, 17, 1185–1188 CrossRef.
- E. G. Villora, K. Shimamura, K. Sumiya and H. Ishibashi, Birefringent- and Quasi-Phasematching with BaMgF4 for VUV and Mid-IR All Solid State Lasers, Opt. Express, 2009, 17, 12362–12378 CrossRef CAS.
- J. F. Scott, Phase Transitions in BaMgF4, Rep. Prog. Phys., 1979, 12, 1055–1084 CrossRef.
- R. V. Pisarev, B. B. Krichevtzov, P. A. Markovin, O. Y. Korshunov and J. F. Scott, Optical Phenomena in BaMnF4 Near Its Phase Transition, Phys. Rev. B: Condens. Matter Mater. Phys., 1983, 28, 2677–2685 CrossRef CAS.
- N. Ishizawa, K. Suda, B. E. Etschmann, T. Oya and N. Kodama, Monoclinic Superstructure of SrMgF4 with Peroskite-type Slabs, Acta Crystallogr., Sect. C: Cryst. Struct. Commun., 2001, 57, 784–786 CAS.
- S. C. Abrahams, Structurally Ferroelectric SrMgF4, Acta Crystallogr., Sect. B: Struct. Sci., 2002, 58, 34–37 CrossRef CAS PubMed.
- S. V. Melnikova, L. I. Isaenko, A. A. Goloshumova and S. I. Lobanov, Investigation of the Ferroelastic Phase Transition in the SrMgF4 Pyroelectric, Phys. Solid State, 2014, 56, 757–760 CrossRef CAS.
- N. Ogorodnikov, V. A. Pustovarov, S. I. Omelkov, L. I. Isaenko, A. P. Yelisseyev, A. A. Goloshumova and S. I. Lobanov, A Far Ultraviolet Spectroscopic Study of the Reflectance, Luminescence and Electronic Properties of SrMgF4 Single Crystals, J. Lumin., 2014, 145, 872–879 CrossRef PubMed.
- P. Yelisseyev, L. I. Isaenko and M. K. Starikova, Luminescence in Lithium Iodate α-LiIO3, J. Opt. Soc. Am. B, 2012, 29, 1430–1435 CrossRef.
- D. N. Nikogosyan, Nonlinear Optical Crystals: A Complete Survey, Springer, 2005 Search PubMed.
- R. D. Shannon and C. T. Prewitt, Effective ionic radii in oxides and fluorides, Acta Crystallogr., Sect. B: Struct. Crystallogr. Cryst. Chem., 1969, 25, 925–946 CrossRef CAS.
- A. Yelisseyev, Z. S. Lin, M. Starikova, L. Isaenko and S. Lobanov, Optical transitions due to native defects in nonlinear optical crystals LiGaS2, J. Appl. Phys., 2012, 111, 113507 CrossRef PubMed.
- S. C. Buchter, T. Y. Fan, V. Liberman, J. J. Zauhovky, M. Rothshild, E. J. Mason, A. Cassanho and H. P. Jenssen, Periodically Poled BaMgF4 for UV Frequency Generation, Opt. Lett., 2001, 27, 1693–1695 CrossRef.
- T. Tomiki and T. Miyata, Optical Studies of Alkali Fluorides and Alkaline Earth Fluorides in VUV Region, J. Phys. Soc. Jpn., 1969, 27, 658–678 CrossRef CAS.
- M. W. Williams, R. A. MacRae and E. T. Arakawa, Optical Properties of Magnesium Fluoride in the Vacuum Ultraviolet, J. Appl. Phys., 1967, 38, 1701–1705 CrossRef CAS PubMed.
- A. K. S. Song and R. T. Williams, Self-Trapped Excitons, Springer Verlag, Berlin-Heidelberg, N.Y., 1996 Search PubMed.
- V. Kisand, R. Kink, M. Kink, J. Maksimov, M. Kirm and I. Martinson, Low-Temperature Optical Spectroscopy of Nonlinear BBO Crystals., Phys. Scr., 1996, 54, 542–544 CrossRef CAS.
- W. D. Cheng, J. S. Huang and J. X. Lu, Electronic Structures and Nonlinear Optical Coefficients of β-BaB2O4, Phys. Rev. B: Condens. Matter Mater. Phys., 1998, 57, 1527–1533 CrossRef CAS.
- M. Roessle, K. W. Kim, A. Dubroka, P. Marsik, C. N. Wang, R. Jany, C. Richter, J. Mannhart, C. W. Schneider, A. Frano, P. Wochner, Y. Lu, B. Keimer, D. K. Shukla, J. Strempfer and C. Bernhard, Electric-Field-Induced Polar Order and Localization of the Confined Electrons in LaAlO3/SrTiO3 Heterostructures, Phys. Rev. Lett., 2013, 110, 136805 CrossRef.
- V. S. Pasiskevicius, S. Wang, J. A. Tellefse, F. Laurell and H. Karlsson, Efficient Nd: YAG Laser Frequency Doubling with Periodically Poled KTP, Appl. Opt., 1998, 37, 7116–7119 CrossRef CAS.
- G. M. Sheldrick, SHELX97 Release 97-2, University of Gottingen, Germany, 1998 Search PubMed.
- G. M. Sheldrick, A short history of SHELX, Acta Crystallogr., Sect. A: Found. Crystallogr., 2008, 64, 112 CrossRef CAS PubMed.
- D. Y. Naumov and E. V. Boldyreva, Software for localization and visualization of cavities in crystal structures and supramolecular assemblies, J. Struct. Chem., 1999, 40, 86–93 CrossRef CAS.
- N. E. Kashcheeva, D. Y. Naumov and E. V. Boldyreva, Software for calculating Dirichlet domains and examples of its application for the analysis of crystal structures of cobalt(III) nitropentaammines, Z. Kristallogr., 1999, 214, 534–541 CrossRef CAS.
- S. J. Clark, M. D. Segall, C. J. Pickard, P. J. Hasnip, M. J. Probert, K. Refson and M. C. Payne, First Principles Methods Using CASTEP, Z. Kristallogr., 2005, 220, 567–570 CrossRef CAS.
- W. Kohn and L. J. Sham, Self-Consistent Equations Including Exchange and Correlation Effects, Phys. Rev., 1965, 140, A1133–A1138 CrossRef.
- D. M. Ceperley and B. J. Alder, Ground-State of the Electron-Gas by a Stochastic Method, Phys. Rev. Lett., 1980, 45, 566–569 CrossRef CAS.
- J. P. Perdew and A. Zunger, Self-Interaction Correction to Density-Functional Approximations for Many-Electron Systems, Phys. Rev. B: Condens. Matter Mater. Phys., 1981, 23, 5048–5079 CrossRef CAS.
- R. G. Parr, S. R. Gadre and L. J. Bartolotti, Local Density Functional Theory of Atoms and Molecules, Proc. Natl. Acad. Sci. U. S. A., 1979, 76, 2522–2526 CrossRef CAS.
- A. M. Rappe, K. M. Rabe, E. Kaxiras and J. D. Joannopoulos, Optimized Pseudopotentials, Phys. Rev. B: Condens. Matter Mater. Phys., 1990, 41, 1227–1230 CrossRef.
- L. Kleinman and D. M. Bylander, Efficacious Form for Model Pseudopotentials, Phys. Rev. Lett., 1982, 48, 1425–1428 CrossRef CAS.
- H. J. Monkhorst and J. D. Pack, Special Points for Brillouin-Zone Integrations, Phys. Rev. B: Solid State, 1976, 13, 5188–5192 CrossRef.
- J. Lin, M. H. Lee, Z. P. Liu, C. T. Chen and C. J. Pickard, Mechanism for Linear and Nonlinear Optical Effects in Beta-BaB2O4 crystals., Phys. Rev. B: Condens. Matter Mater. Phys., 1999, 60, 13380–13389 CrossRef CAS.
- Z. S. Lin, J. Lin, Z. Z. Wang, Y. C. Wu, N. Ye, C. T. Chen and R. K. Li, Theoretical Calculations and Predictions of the Nonlinear Optical Coefficients of Borate Crystals, J. Phys.: Condens. Matter, 2001, 13, R369–R384 CrossRef CAS.
- S. Baroni, S. de Gironcoli, A. Dal Corso and P. Giannozzi, Phonons and Related Crystal Properties from Density-Functional Perturbation Theory, Rev. Mod. Phys., 2001, 73, 515–562 CrossRef CAS.
Footnote |
| † Electronic supplementary information (ESI) available: simulated XRD for LT and HT SrMgF4 phases; the CIF file of LT and HT phases of SMF and the main optical properties of wide-band NLO crystals (Table S1). CCDC 1029321 and 1029322. For ESI and crystallographic data in CIF or other electronic format see DOI: 10.1039/c4cp04689g |
| This journal is © the Owner Societies 2015 |